

Abstract
The Critical Assessment of Small Molecule Identification (CASMI) contest is an initiative designed as an unbiased test of manual and automated strategies for the identification of small molecules from raw mass spectrometric data. In this contest, the participants are provided a set of high resolution MS and MS/MS data and asked to identify the unknown structure. CASMI 2016 is the fourth round of this contest in which the author participated in Category 1: Best Identification of Natural Products using a manual approach. The provided high resolution mass spectrometric data were interpreted manually using a combination of fragment and neutral loss analysis, literature consultation, manual database searches, deductive logic and experience. Out of 18 challenges, the author submitted correct structures as lead candidates for 14 challenges and 2nd ranked candidate for four challenges and was declared the winner of this category Pitfalls and challenges encountered during data interpretation are discussed.
Keywords: CASMI, natural products, dereplication, tandem mass spectrometry, small molecule identification, metabolite identification
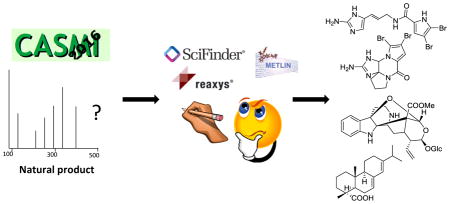
Graphical Abstract
1. Introduction
Mass spectrometry has become an indispensable tool for annotation and identification of small molecules. In natural products research, mass spectrometry is most commonly used for rapid identification of known compounds (dereplication). Such analyses may be done under different scenarios such as phytochemical profiling of a natural resource or identification of active compound(s) in drug discovery programs (Cech and Yu, 2013; Hubert et al., 2015). Whatever the circumstance, the basic idea is to identify compounds without the laborious and expensive process of isolation. In a typical workflow, extracts are separated using high resolution separation methods such as HLPC or UHPLC and mass spectrometric data acquired using high resolution mass analyzers (i.e., qTOF, Orbitrap, ICR). Molecular formulas and tandem mass spectra are then searched in natural product databases and/or spectral libraries. In recent years, various computational tools have been developed to assist in the process (Allen et al., 2015; Duhrkop et al., 2015; Ridder et al., 2014; Scheubert et al., 2013; Schymanski et al., 2014a; Yang et al., 2013).
As simple as this basic process may appear, identifying a compound by relying only on mass spectrometry is not a trivial task. As mass spectrometry is not a de novo identification technique, identifications done solely by mass spectrometry always carry a degree of uncertainty. There are many reasons why identification may be unreliable, including a wrong assignment of molecular formula due to formation of adducted species or in-source fragmentation (Nikolic et al., 2016), few diagnostic ions in the tandem mass spectrum, similarity among spectra of structural isomers, etc. How to measure and express confidence in structural assignments is a matter of active discussion in the mass spectrometry community and various proposals have been put forward in recent years (Creek et al., 2014; Schymanski et al., 2014b; Sumner et al., 2007; Sumner et al., 2014).
The Critical Assessment of Small Molecule Identification (CASMI) contest is an initiative designed as an unbiased test of the merits of various methods and practices used to annotate and structurally identify small molecules using mass spectrometry (Schymanski and Neumann, 2013a; Schymanski and Neumann, 2013b). In this contest, participants are asked to solve the structures of unknown compounds based on a set of high resolution MS and MS/MS data provided by the organizers. CASMI 2016 was the fourth round of this contest held between January and April 2016. It was organized in three categories, one of which was dedicated to identification of naturally occurring compounds (Category 1). This article describes the author’s entry for the Category 1: Best Identification of Natural Products. The author applied a manual approach he routinely uses in his day-to-day activities in the Analytical Core of the UIC/NIH Center for Botanical Dietary Supplements Research.
2. Experimental
The basic approach used to solve the challenges was the same as that described in our previous publications (Newsome and Nikolic, 2014; Nikolic et al., 2012). Briefly, molecular formulas were determined using the elemental composition tool in the MassLynx v4.1 software. The molecular formula calculator was applied with limits reasonable for naturally occurring compounds, i.e., elements C (1 to 60), H (1 to 80), O (0 to 20), N (0 to 7) and S (0–3), double bond equivalence (1–25) and mass accuracy within 10ppm for Challenges 1–10 and 5ppm for Challenges 10–19. Only even electron species were considered as that information was given by the organizers. For Challenges 1, 2, 6 and 7 the observed isotopic pattern characteristic of the presence of two bromine atoms was used to restrict formula candidates to those that contained two bromine atoms and satisfied the specified mass accuracy The hits obtained from the calculator were sorted based on the isotope pattern match and from additional scrutiny of the MS-MS data. In all cases only a single molecular formula that showed the best fit to all of the data was subsequently considered. The molecular formulas were searched in the Reaxys and SciFinder databases with the constraints “isolation from natural product exists” and “occurrence”, respectively and hits prioritized based on the number of published references. These searches are useful as they provide a general overview as to what types of structures one is dealing with. The molecular formulas were also searched in in-house and public spectral databases to quickly check if spectra for a particular molecular formula were available. The public databases consulted included METLIN, MassBank and mzCloud. These databases allow MS/MS spectral searches in the text format provided by the organizers. If no hits were present, the spectra were manually interpreted and candidate compounds eliminated if it was determined that their structures could not fit the available data. This initial round of elimination focuses on simple, easy to predict fragmentation pathways. For example, if the tandem mass spectrum shows loss of guanidine, candidate structures that cannot fragment to produce such a loss are eliminated from consideration. Prenylated flavonoids, as another example, readily eliminate C4H8 unit in positive ion mode, thus if the tandem mass spectrum does not contain such a loss, candidate compounds that are prenylated flavonoids can be eliminated. These arguments also work in reverse, that is, if the spectrum does show loss of C4H8 the prenyl flavonoid candidates are given special consideration. This elimination process typically results in a few candidates that are more thoroughly scrutinized by attempting to fully rationalize the tandem mass spectrum with the proposed structure. This detailed spectral interpretation is done to possibly distinguish structural isomers which may show subtle, not so easy to spot differences in their MS/MS spectra. The final rankings of candidates are based on the author’s judgement as to how well the available data fit the proposed structure.
3. Results and discussion
3.1 Determination of molecular formula
In contrast with previous rounds, for CASMI 2016 the identity of molecular species was provided and included exclusively protonated and deprotonated molecules. This might have been done to accommodate automated methods (Categories 2 and 3) which do not handle well other molecular species such as cationized molecules or metal adducts. As observed during CASMI 2014, the main cause of incorrect formula determination was misassignment of molecular species (Nikolic et al., 2016). Knowing the correct molecular species in advance made determination of molecular formula relatively straightforward. For Challenges 1, 2, 6 and 7, which contained two bromine atoms, it was noted that isotopic abundances were quite different despite the fact that these challenges represent only one molecular composition. The theoretical ratio for major isotopic peaks of m/z 387, 389 and 391 is 51.1:100:49.5, while the measured ratios ranged anywhere from 38.1:100:30.5 to 70.4:100:35.6. These varying ratios required some additional scrutiny from tandem mass data to eliminate other possible formulas with two bromine atoms that would fit well both the accuracy limits and isotopic distribution. Although the organizers could have submitted better quality data for these challenges, these examples demonstrate that in reality analysts have to account for a possibility that instruments do not always produce clean data.
3.2. Determination of molecular structure
Table 1 summarizes the author’s submission for the Category 1: Best Structure Identification on Natural Products. As the table illustrates, 14 challenges were correctly solved while for the remaining four the correct solution was the 2nd ranked candidate. This was the winning performance in this category.
Table 1.
Summary of results in Category 1: Best Structure Identification of Natural Products
| Challenge no. | No. of candidates submitted | Rank of correct candidate |
|---|---|---|
| 1 | 4 | 2 |
| 2 | 2 | 2 |
| 4 | 9 | 1 |
| 5 | 3 | 1 |
| 6 | 3 | 1 |
| 7 | 2 | 1 |
| 8 | 2 | 2 |
| 9 | 1 | 1 |
| 10 | 1 | 1 |
| 11 | 2 | 1 |
| 12 | 1 | 1 |
| 13 | 2 | 1 |
| 14 | 5 | 2 |
| 15 | 1 | 1 |
| 16 | 2 | 1 |
| 17 | 1 | 1 |
| 18 | 2 | 1 |
| 19 | 1 | 1 |
For six challenges, only a single solution was submitted. Those were the cases where tandem mass spectrum could be retrieved from either the in-house or public spectral databases and the match was judged good enough to warrant confidence in a single solution. For alizarin (Ch 16) and purpurin (Ch 18) although the tandem spectra were available, two candidates were submitted to express the uncertainty that other antraquinone analogs having different positions of hydroxyl groups might produce similar spectra. The following discussion will focus on the tools and thought process used to arrive at the solutions for some of the more interesting challenges. Pitfalls encountered along the way are also discussed.
Challenges 1, 2, 6 and 7
SciFinder and Reaxys database search of elemental composition of C11H11N5OBr2 returned four and 16 hits, respectively. Manual inspection revealed similarities between spectra for Challenges 2 and 7. The base peak at m/z 122 could be well explained for the structure of oroidin (see Figure 1 and Supplemental Figure S1), but the author had quite a bit of difficulty rationalizing this peak for other possible candidates. Guided by the preconceived idea that these challenges should be two different compounds, oroidin was submitted as the first choice for Challenge 7 and 2nd choice for Challenge 2. For challenge 2 the structure of 4,5-dibromo-pyrrole-2-carboxylic acid 4-(3-amino-propenyl)-1(3) H-imidazol-2-ylamide, an alkaloid from sponge Agelas Oroides (Forenza et al., 1971) was reluctantly submitted as the first ranked candidate because it is the only one that could be remotely connected with the provided spectrum. In retrospect, this turned out to be a nice twist on the part of the organizers, who acquired tandem mass spectra of the same compound on two different instruments. In contrast to Challenges 2 and 7, the spectra for Challenges 1 and 6 spectra looked quite different although it was noted that loss of guanidino group was common for both spectra. To solve Challenge 1, the participants had only loss of guanidino group and the corresponding protonated guanidine (m/z 60) to go by. Based on the author’s experience with guanidino compounds, this feature is typically characteristic of compounds containing a free guanidino group along with the availability of acidic hydrogen that can be transferred to the guanidino group in the ion-neutral complex (Nikolic et al., 2012). Based on these considerations, a structure of ugibohlin (Goetz et al., 2001) was proposed as this was the only candidate that contained a free guanidino group. On the other hand, the spectrum of Challenge 6 shows losses of bromine radicals in addition to the loss of guanidino group and there was no ion of m/z 60. Losses of methylenediimine (NH=C=NH; 42Da) from the protonated molecule and combined loss of methylenediimine and bromine radical (m/z 267) were also noted. These features fit well with a cyclic guanidino substructure and it was judged that the spectrum for Challenge 6 could fit well with any of known dibromopyrrole alkaloids shown in Figure 1. The structure of dibromophakellin was submitted as top solution based on phytochemical grounds as this compound can be metabolically derived from oroidin. Thus, if oroidin was present in a sample it is reasonable to expect dibromophakellin as well. However, from purely mass spectrometric point of view, distinguishing among these isomers is not easy. The possible fragmentation pathway shown for dibromophakellin in Figure S1 could equally well fit other isomeric structures. Thus, the confidence in this assignment was low. After the solutions were revealed, it was surprising to learn that the MS/MS spectra for dibromophakellin were so different on two instruments of the same type, particularly since such profound differences were not observed for oroidin.
Figure 1.

Chemical structures of the compounds discussed in the text
Challenges 4 and 8
Search of molecular formula C29H37NO5 revealed that the most likely solution is one of the many cytochalasines. The most commonly occurring compound from this group is cytochalasine B, which was submitted as top choice for the Challenge 4. Since the spectra looked very similar it was determined that Challenge 8 likely belonged to the same class of compounds. As cytochalasines are structurally similar and because of the flexibility of the ring many bond cleavages are possible, distinguishing individual isomers is difficult. While the confidence in the cytochalasine skeleton was high, the confidence in each individual assignment was low. In other words, the provided spectra could fit any of the known cytochalasines.
Challenge 5
This challenge turned out to be the most difficult one as only one correct solution was submitted. Reaxys database searching of the formula C27H34N2O10 revealed that the compound is a glucosidated monoterpene indole alkaloid. Most of the known compounds in the Reaxys database were analogs of the alkaloid dihydrocadambine (Figure 1). Thus, an attempt was made to rationalize whether the challenge spectrum could conceivably come from this group of compounds. The key stumbling block was to explain the base peak at m/z 269 with the elemental composition of C16H17N2O2. None of the dihydrocadambine analogs has two oxygens near the beta carboline core, thus it was determined that none of dihydrocadambine analogs are likely solutions. The attention was then directed to the only other possible choice, the alkaloid cymoside (Lemus et al., 2015). The structure of this unusual alkaloid was carefully scrutinized and determined to be a reasonable solution for this challenge (see Figure S3 for proposed fragmentation). For example, several fragment ions such as m/z 240, 226 and 214 correspond to the elimination of various nitrogen-containing fragment units (methyleneimmine, aziridine) which can be rationalized with the presence of a tetrahydro β-carboline substructure. Overall, due to complexity of the structure and a number of difficult to explain fragment ions, the confidence in this assignment was low.
One interesting observation for Challenges 1–9 was that it appears that the compounds were present as constituents of some complex extract rather than as isolated pure compounds. For Challenge 5, for example, there was another chromatographic peak that produced identical MS/MS spectrum to that of cymoside. In addition, possible structures for Challenges 1, 2, 6, 7 are very similar and require careful spectroscopic characterization by NMR for correct assignment. It is not clear why the organizers opted to submit the challenge data this manner, but it is hoped that these structures have been correctly elucidated and that peaks selected from the chromatograms did indeed correspond to the posted solutions.
Challenge 14
This challenge was another one that proved difficult to solve by most participants and deserves a bit more discussion. Reaxys and SciFinder searches of molecular formula C20H30O2 returned over 600 hits. Sorting out hits based on the number of references, the most common compound classes were unsaturated fatty acids, steroid hormones and diterpene resin acids. The author’s in-house spectral library happened to contain a standard spectrum of EPA, the most common fatty acid with the provided molecular composition. The standard spectrum did not match the challenged spectrum, thus EPA was eliminated as a possible solution. Steroid hormones were eliminated by checking spectral databases and literature for available tandem mass spectra. It was found that the unknown spectrum did not contain fragments characteristic for this class of molecules. Incidentally, a METLIN search of the challenge spectrum revealed a near perfect match with the MS/MS spectrum of neoabietic acid, a diterpene resin acid (Figure 2). Therefore, in all likelihood the unknown compound was a resin acid. At this point, a general knowledge of phytochemistry and mass spectrometry was necessary to critically examine the result of the METLIN search. Resin acids with the provided elemental composition differ from each other primarily by the relative positions of the double bonds in the carbon skeleton. Since the carboxylic acid is the primary protonation site in this type of structure, loss of formic acid equivalent (MH-46; MH-H2O-CO; m/z 257) produces a tertiary carbocation which is expected to be a fragment observable in all compounds from this class. After the loss of formic acid equivalent, the MS/MS spectrum will be dominated by various cleavages of the carbon skeleton. An examination of the tandem mass spectrum of neoabietic acid deposited in METLIN reveals numerous skeletal fragments whose origins is not easy to accurately determine without extensive studies. Given the structural similarity among compounds an inevitable conclusion is that tandem mass spectra of this class of compounds will be very similar, if not identical, and that without authentic standards identification of a particular compound from this class is unreliable. Interestingly, METLIN also contains tandem mass spectrum of abietic acid, the most commonly occurring resin acid. However, no matter how search parameters were modified, abietic acid never showed up as the best match in the spectral search. A manual examination of the abietic acid MS/MS spectrum revealed that the spectrum at higher collision energy was of poor quality, thus it was difficult to manually correlate METLIN spectrum with the challenge spectrum. Therefore, neoabietic acid was submitted as top ranked and abietic acid as 2nd ranked solution. A final twist in this story came after an attempt to locate a publication that may report tandem mass spectrum of abietic acid. A recent paper describing identification of active components from balsam fir reports abietic acid as one of the active components (Nachar et al., 2015). The compound was reportedly identified by comparison of the tandem mass spectrum of an authentic standard with that from the unknown. Curiously, the authors report only three (presumably major, but not specifically noted so) fragment ions of m/z 141,115 and 105. Except for the ion at m/z 105, which was a minor fragment in the challenge spectrum, the other two ions were absent both from the challenge spectrum and from the METLIN spectrum of abietic acid. Although this conundrum could be attributed to instrumental differences, it may well be yet another case of mislabeled/misidentified natural product. Most entries in public spectral libraries are created from commercially available standards where the end user assumes that what is on the label is what is in the bottle. Hard data on the validity of this basic assumption are difficult to come by because there is no public venue to report mislabeled standards, but the author has seen his fair share of commercial standards that are incorrectly labeled. In some cases, even the structural class of the molecule was different from what was claimed on the bottle. A recent paper describing a mislabeled synthetic compound shows nicely how mass spectrometry can be used to detect such a problem (Zu et al., 2016). Thus, it is possible that some of the reference standards used to produce spectra of abietic/neoabietic acid were mislabeled. The same problem of compound identity also applies to compounds isolated and characterized by individual investigators. The true extent of misidentified natural products is hard to measure, but cases of misassigned natural products are not at all uncommon (Nicolaou and Snyder, 2005; Pauli et al., 2016).
As evident from the above discussion, the manual approach described here is very effective at arriving at a small number of good structural candidates because it takes into account all available information to arrive at the proposed structure. The key aspect of this approach is investigator’s experience and skill in interpretation of tandem mass spectra. The downside is that this is a labor intensive approach. Some solutions in this contest required as little as ten minutes while others such as Challenge 5 for example, required several hours of dedicated effort. As such, it is well-suited for small problem sets, such as, for example, identification of bioactive compounds in screening assays, but not for high throughput metabolomics studies. Even as computer-based approaches become more accurate, human intervention and scrutiny will still be required to critically examine results obtained from such methods.
Supplementary Material
Highlights.
CASMI2016 challenges were solved using a manual approach
14 challenges were solved correctly; for four challenges the correct solution was 2nd ranked candidate
Manual approach is good for small data sets, but too slow for high throughput metabolomics applications
Acknowledgments
I would like to thank the organizers of the CASMI 2016 contest for their efforts in making this contest possible. I also thank the Office of Dietary Supplements and the National Center for Complementary and Integrative Health for financial support (NIH grant P50 AT00155)
Footnotes
Conflict of Interest
The author declares no conflict of interest.
Publisher's Disclaimer: This is a PDF file of an unedited manuscript that has been accepted for publication. As a service to our customers we are providing this early version of the manuscript. The manuscript will undergo copyediting, typesetting, and review of the resulting proof before it is published in its final citable form. Please note that during the production process errors may be discovered which could affect the content, and all legal disclaimers that apply to the journal pertain.
References
- Allen F, Greiner R, Wishart D. Competitive fragmentation modeling of ESI-MS/MS spectra for putative metabolite identification. Metabolomics. 2015;11:98–110. [Google Scholar]
- Cech NB, Yu K. Mass spectrometry for natural products research: challenges, pitfalls, and opportunities. LCGC Magazine. 2013;31:938–947. [Google Scholar]
- Creek DJ, Dunn WB, Fiehn O, Griffin JL, Hall RD, Lei ZT, Mistrik R, Neumann S, Schymanski EL, Sumner LW, Trengove R, Wolfender JL. Metabolite identification: are you sure? And how do your peers gauge your confidence? Metabolomics. 2014;10:350–353. [Google Scholar]
- Duhrkop K, Shen HB, Meusel M, Rousu J, Bocker S. Searching molecular structure databases with tandem mass spectra using CSI:FingerID. P Natl Acad Sci USA. 2015;112:12580–12585. doi: 10.1073/pnas.1509788112. [DOI] [PMC free article] [PubMed] [Google Scholar]
- Forenza S, Minale L, Riccio R. New Bromo-Pyrrole Derivatives from Sponge Agelas-Oroides. J Chem Soc Chem Comm. 1971:1129. [Google Scholar]
- Goetz GH, Harrigan GG, Likos J. Ugibohlin: a new dibromo-seco-isophakellin from Axinella carteri. J Nat Prod. 2001;64:1581–1582. doi: 10.1021/np010202o. [DOI] [PubMed] [Google Scholar]
- Hubert J, Nuzzilard J-M, Renault JH. Dereplication strategies in natural product research: How many tools and methodologies behind the same concept? Phytochem Rev 2015 [Google Scholar]
- Lemus C, Kritsanida M, Canet A, Genta-Jouve G, Michel S, Deguin B, Grougnet R. Cymoside, a monoterpene indole alkaloid with a hexacyclic fused skeleton from Chimarrhis cymosa. Tetrahedron Lett. 2015;56:5377–5380. [Google Scholar]
- Nachar A, Saleem A, Arnason JT, Haddad PS. Regulation of liver cell glucose homeostasis by dehydroabietic acid, abietic acid and squalene isolated from balsam fir (Abies balsamea (L.) Mill.) a plant of the Eastern James Bay Cree traditional pharmacopeia. Phytochemistry. 2015;117:373–379. doi: 10.1016/j.phytochem.2015.07.001. [DOI] [PubMed] [Google Scholar]
- Newsome AG, Nikolic D. CASMI 2013: Identification of Small Molecules by Tandem Mass Spectrometry Combined with Database and Literature Mining. Mass Spectrom (Tokyo) 2014;3:S0034. doi: 10.5702/massspectrometry.S0034. [DOI] [PMC free article] [PubMed] [Google Scholar]
- Nicolaou KC, Snyder SA. Chasing molecules that were never there: misassigned natural products and the role of chemical synthesis in modern structure elucidation. Angew Chem Int Ed Engl. 2005;44:1012–1044. doi: 10.1002/anie.200460864. [DOI] [PubMed] [Google Scholar]
- Nikolic D, Godecke T, Chen SN, White J, Lankin DC, Pauli GF, van Breemen RB. Mass spectrometric dereplication of nitrogen-containing constituents of black cohosh (Cimicifuga racemosa L.) Fitoterapia. 2012;83:441–460. doi: 10.1016/j.fitote.2011.12.006. [DOI] [PMC free article] [PubMed] [Google Scholar]
- Nikolic D, Jones M, Sumner LW, Dunn W. CASMI 2014: Challenges, Solutions and Results Current Metabolomics. 2016:4. in press. [Google Scholar]
- Pauli GF, Niemitz M, Bisson J, Lodewyk MW, Soldi C, Shaw JT, Tantillo DJ, Saya JM, Vos K, Kleinnijenhuis RA, Hiemstra H, Chen SN, McAlpine JB, Lankin DC, Friesen JB. Toward Structural Correctness: Aquatolide and the Importance of 1D Proton NMR FID Archiving. J Org Chem. 2016;81:878–889. doi: 10.1021/acs.joc.5b02456. [DOI] [PMC free article] [PubMed] [Google Scholar]
- Ridder L, van der Hooft JJ, Verhoeven S. Automatic Compound Annotation from Mass Spectrometry Data Using MAGMa. Mass Spectrom (Tokyo) 2014;3:S0033. doi: 10.5702/massspectrometry.S0033. [DOI] [PMC free article] [PubMed] [Google Scholar]
- Scheubert K, Hufsky F, Bocker S. Computational mass spectrometry for small molecules. J Cheminformatics. 2013:5. doi: 10.1186/1758-2946-5-12. [DOI] [PMC free article] [PubMed] [Google Scholar]
- Schymanski E, Neumann S. CASMI: And the Winner is. Metabolites. 2013a;3:412–439. doi: 10.3390/metabo3020412. [DOI] [PMC free article] [PubMed] [Google Scholar]
- Schymanski EL, Gerlich M, Ruttkies C, Neumann S. Solving CASMI 2013 with MetFrag, MetFusion and MOLGEN-MS/MS. Mass Spectrom (Tokyo) 2014a;3:S0036. doi: 10.5702/massspectrometry.S0036. [DOI] [PMC free article] [PubMed] [Google Scholar]
- Schymanski EL, Jeon J, Gulde R, Fenner K, Ruff M, Singer HP, Hollender J. Identifying small molecules via high resolution mass spectrometry: communicating confidence. Environ Sci Technol. 2014b;48:2097–2098. doi: 10.1021/es5002105. [DOI] [PubMed] [Google Scholar]
- Schymanski EL, Neumann S. CASMI: And the Winner is. Metabolites. 2013b;3:412–439. doi: 10.3390/metabo3020412. [DOI] [PMC free article] [PubMed] [Google Scholar]
- Sumner LW, Amberg A, Barrett D, Beale MH, Beger R, Daykin CA, Fan TW, Fiehn O, Goodacre R, Griffin JL, Hankemeier T, Hardy N, Harnly J, Higashi R, Kopka J, Lane AN, Lindon JC, Marriott P, Nicholls AW, Reily MD, Thaden JJ, Viant MR. Proposed minimum reporting standards for chemical analysis Chemical Analysis Working Group (CAWG) Metabolomics Standards Initiative (MSI) Metabolomics. 2007;3:211–221. doi: 10.1007/s11306-007-0082-2. [DOI] [PMC free article] [PubMed] [Google Scholar]
- Sumner LW, Lei ZT, Nikolau BJ, Saito K, Roessner U, Trengove R. Proposed quantitative and alphanumeric metabolite identification metrics. Metabolomics. 2014;10:1047–1049. [Google Scholar]
- Yang JY, Sanchez LM, Rath CM, Liu X, Boudreau PD, Bruns N, Glukhov E, Wodtke A, de Felicio R, Fenner A, Wong WR, Linington RG, Zhang L, Debonsi HM, Gerwick WH, Dorrestein PC. Molecular networking as a dereplication strategy. J Nat Prod. 2013;76:1686–1699. doi: 10.1021/np400413s. [DOI] [PMC free article] [PubMed] [Google Scholar]
- Zu C, Mukhopadhyay S, Hanley PS, Xia S, Bell BM, Grigg D, Gilbert JR, O’Brien JP. Fragmentation of Protonated N-(3-Aminophenyl)Benzamide and Its Derivatives in Gas Phase. J Am Soc Mass Spectrom. 2016;27:917–926. doi: 10.1007/s13361-016-1342-z. [DOI] [PubMed] [Google Scholar]
Associated Data
This section collects any data citations, data availability statements, or supplementary materials included in this article.