Abstract
During cerebral cortex development, progenitor cells undergo several rounds of symmetric and asymmetric cell divisions to generate new progenitors or postmitotic neurons. Later, some progenitors switch to a gliogenic fate, adding to the astrocyte and oligodendrocyte populations. Using time-lapse video-microscopy of primary cerebral cortex cell cultures, it is possible to study the cellular and molecular mechanisms controlling the mode of cell division and cell cycle parameters of progenitor cells. Similarly, the fate of postmitotic cells can be examined using cell-specific fluorescent reporter proteins or post-imaging immunocytochemistry. More importantly, all these features can be analyzed at the single-cell level, allowing the identification of progenitors committed to the generation of specific cell types. Manipulation of gene expression can also be performed using viral-mediated transfection, allowing the study of cell-autonomous and non-cell-autonomous phenomena. Finally, the use of fusion fluorescent proteins allows the study of symmetric and asymmetric distribution of selected proteins during division and the correlation with daughter cells fate. Here, we describe the time-lapse video-microscopy method to image primary cerebral cortex murine cells for up to several days and analyze the mode of cell division, cell cycle length and fate of newly generated cells. We also describe a simple method to transfect progenitor cells, which can be applied to manipulate genes of interest or simply label cells with reporter proteins.
Keywords: Neurobiology, Issue 126, Primary cell culture, cerebral cortex, time-lapse video-microscopy, cell proliferation, neuronal differentiation, cell survival.
Introduction
Neural stem cells (NSC) generate neurons and macroglial cells during cerebral cortex development. At early-corticogenesis, NSCs undergo several rounds of symmetric cell division, and expand the progenitor pool. Then, NSCs divide asymmetrically to generate neurons directly or indirectly through intermediates1. Only at mid- to late-corticogenesis, progenitors switch to generate astrocytes and oligodendrocytes2,3,4. However, the complete mechanisms that control cell proliferation and differentiation, as well as the contribution of fate-restricted progenitors to the generation of unique types of neurons or macroglial cells remain a matter of intense debate4,5,6. The potential of individual cortical NSCs to generate neurons, astrocytes and oligodendrocytes has been extensively studied in vitro and in vivo using a myriad of techniques such as: live imaging in single-cell cultures7,8,9,10,11,12,13; live imaging in high-density cultures cultures3,14,15; live imaging in slice cultures16,17,18; clonal analysis using viral vector-mediated genetic labeling in high-density cultures14,15,19,20,21; clonal analysis in vivo using retrovirus22,23,24,25,26,27,28,29,30,31,32,33; and clonal analysis in vivo using transgenic animals34.
Each of these techniques presents pros and cons. For instance, in vivo lineage tracing is susceptible to the lumping and splitting errors3, leading to conflicting conclusions about the potential of individual cortical progenitors. Moreover, both in vitro and in vivo studies based on the labeling of progenitor cells at early time-points and posterior analysis of cell lineages may be influenced by the undetected occurrence of cell death during lineage-progression35. Therefore, a suitable system to analyze the potential of single NSCs must allow the identification of all cells generated, as well as the appropriate characterization of cell fates within the lineage. Combination of primary cell culture and live imaging provides this setting. Using single-cell culture and time-lapse video microscopy, Temple et al. have shown the switch in the lineage of individual cerebral cortex progenitors from neurogenesis to gliogenesis11. Later, they used the same system to show that different types of neurons are generated from a single cortical progenitor12. However, this system presents an important caveat: only 1% of cortical progenitors isolated at early corticogenesis generate clones of 4 or more progeny9. After the addition of FGF2, the frequency of cells generating 4 or more cells increases to 8 - 10%9. Nevertheless, this number is too small considering that virtually all cortical progenitors are proliferative at this stage. Moreover, the potential effects of FGF2 on fate-specification cannot be ruled out36. To circumvent these limitations, we used high-density cell cultures that support the proliferation of both ventricular (Pax6-expressing) and subventricular (Tbr2-expressing) cortical progenitors15. Moreover, the real-time observation of these cultures has shown that several features of NSC lineage progression are reproduced under these conditions, such as mode of cell division, lengthening of cell cycle, potential of single cells to generate neurons and glia, among others3,15. More recently, we have also used this system to show that CREB-signaling affects the cell survival of immature cerebral cortex neurons in mice37. Thus, we believe that time-lapse video-microscopy of primary murine cerebral cortex cells grown in high density is a powerful and accessible tool to study cellular and molecular mechanisms of cell cycle progression, mode of cell division, cell survival and cell fate specification. The latter can be accomplished using transgenic animals, allowing the identification of specific cell fates on real time38,39,40 or the use of post-imaging immunocytochemistry3,38,41,42.
Here, we provide a step-by-step protocol to prepare primary cerebral cortex cell culture supporting proliferation of NSCs and the subsequent generation of neurons and macroglial cells. We also discuss the use of retroviral-mediated transfection to manipulate gene expression of individual cells, which can be identified and tracked at the single-cell level using time-lapse video microscopy. This protocol can be used to study primary cerebral cortex cells isolated from the beginning to the end of the corticogenesis in rodents, but a few adjustments may be required according to the stage14. NSCs isolated from other sources can also be studied using time-lapse video microscopy of 2D cultures, but the appropriate culturing system should be determined by comparing cell behaviors in vitro and in vivo38,43.
Protocol
All experiments involving live animals described in this protocol are conducted according to the National and International laws and were approved by the local University Animal Care and Use Committee (CEUA/UFRN), under the license 009/2014. The following protocol is performed in a sterile environment. Familiarity with basic cell culture is expected.
1. Dorsolateral Telencephalon Microdissection
Prepare the dissection medium (100 mL): 98.5 mL Hank's Balanced Salt Solution (HBSS), 0.5 mL 5 M HEPES pH 7.4, 1 mL penicillin/streptomycin (10,000 units/mL and 10,000 µg/mL).
Filter-sterilize the dissection medium.
Remove embryonic day 14 (E14) embryos from a pregnant mouse C57/Bl6 (Mus musculus) under anesthesia with isoflurane. NOTE: Consider E0 as the day of vaginal plug detection. Dissection should be completed no later than 1 h after removal from the pregnant mouse. This protocol also applies for embryos E11-E17.
Remove the embryos by hysterectomy under sterile conditions.
Transfer the embryos to a Petri dish with cold dissection medium (4 °C).
Remove the brains from the skull by cutting along the longitudinal fissure. The number of embryos usually varies from five to ten. Each E14 brain yields approximately 2 x 10⁶ cells, including progenitors and postmitotic neurons (1:1 ratio) NOTE: Use the stereomicroscope for the following steps.
Remove the meninges using dissection forceps. Split the telencephalon in the middle to separate the hemispheres. To isolate the dorsolateral telencephalon, cut along the dorsomedial curve and pallial-subpallial boundary using dissection forceps. Transfer the dorsolateral telencephalon to a 2 mL tube with cold dissection medium (4 °C) until all brains are dissected.
2. Cell Dissociation and Plating
Prepare the proliferation medium (50 mL of DMEM+10% FCS): 44 mL Dulbecco Modified Eagle's Medium (DMEM), 5mL Fetal Calf Serum (FCS), 0.5 mL 40% glucose, 0.5 mL penicillin/streptomycin (10,000 units/mL and 10,000 µg/mL). Filter-sterilize the proliferation medium.
Prepare differentiation medium (50 mL of DMEM+2% B27): 48 mL DMEM, 1 mL B27, 0.5 mL 40% glucose, 0.5 mL penicillin/streptomycin (10,000 units/mL and 10,000 µg/mL). Filter-sterilize the differentiation medium.
After micro-dissection of the dorsolateral telencephalon from E14 mice, centrifuge the tube with the collected tissue and cold dissection medium (for 5 min at 4 °C, 340 x g) to precipitate the tissue.
Remove the supernatant with a pipette and add 1 mL of pre-warmed (37 °C) Trypsin-EDTA (0.05%) for chemical digestion. Incubate for 15 min at 37 °C. Add 2 mL of proliferation medium to stop trypsin activity.
Polish the tip of a glass Pasteur pipette over a gas burner or Bunsen burner for few seconds to slightly narrow the aperture. Wash the pipette by aspirating FCS to coat the tip. Avoiding bubbles, dissociate mechanically the cells with a fire-polished and FCS-coated Pasteur pipette.
Centrifuge the cells (for 5 min at 4 °C, 340 x g). Remove supernatant with a pipette. Add 1 mL of proliferation medium and resuspend the cells using a pipette. Repeat this step once.
Prepare a 1:1 dilution of the cell suspension using a 0.4% Trypan Blue solution. Non-viable cells will be blue. Count the number of viable cells (unstained) using a Neubauer chamber.
Dilute the cells in proliferation medium to get 106 cells/mL. Add 500 µL of the cell suspension to each well of a 24 well tissue culture plate (approximately 2.5 × 10⁵ cells/cm2). Incubate cells at 37 °C and 5% CO2. NOTE: Do not use glass coverslips, as they can move during the experiment and change the field of observation. Alternatively, use glass bottom tissue culture plates. NOTE: If you are not using cell-culture treated multidished, it is important to pre-treat your plates with Poly-D-Lysin (50 µg/ml) 2 h at 37 °C. PDL-treated plates can be stored at 4 °C after washing with distilled water.
3. Retroviral-mediated Transfection
NOTE: This is a simple method to transfect only progenitor cells. However, other viral vectors or chemical/electrical transfection can be used to insert genes of interest in cultured cells.
To manipulate gene expression and label cells with fluorescent reporter proteins, add retroviruses carrying plasmids with genes of interest 2 h after cell plating. NOTE: Retroviral vectors only integrate into the genome of dividing cells. Therefore, it is important to infect cells when proliferation is high. NOTE: We used a plasmid containing the Beta-actin/CMV fusion sequence (CAG) and an internal ribosomal entry site (IRES) followed by the coding sequence for the green fluorescent protein (GFP), designated pCAG-IRES-GFP44. Genes of interest could be cloned between the CAG promoter and IRES sequence37.
Dilute the retrovirus in differentiation medium to obtain the desired number of particles per mL. Add 500 µL of differentiation medium with retrovirus to each well. NOTE: The amount of retroviruses used is dependent on its titer and should be calculated to obtain 50 to 100 infected cells per well. This titer allows the identification of isolated GFP-expressing clones, whose relationship can be further confirmed by tracking phase contrast images (see section 6). The titration of retrovirus should be performed using the same cell population45.
4. Time-lapse Video-microscopy
NOTE: This step requires an inverted fluorescence microscope with incubation chamber (see Table of Materials).
After the retrovirus infection, place the tissue culture plate into an incubator connected to temperature and CO2 controllers. NOTE: Preheating the chamber for 3 h prior to starting imaging could help minimize drift and defocus during the acquisition. NOTE: The chamber should maintain the cells at constant conditions of 37 °C and 5% CO2.
Select a position in the XY axis to serve as a zero-point (XY = 0). This will allow a reference to find the positions again in the future, for instance after post-imaging immunocytochemistry (see section 5). NOTE: It is advisable to draw a sign in the plate that can be used as a reference to determine the zero-point.
Select the positions to be imaged at 10X magnification. NOTE: Select 10-15 positions per well to increase the likelihood to observe retrovirally-transfected cells. NOTE: Long-distance high magnification objectives (20X or 40X) can be used to gain higher resolution images. Depending on the working distance of objectives, glass-bottom plates may be required.
Acquire phase contrast images every 5 min and fluorescence images every 3 h to decrease phototoxicity. Check and adjust the focus in the first 3 h of experiment, as it may change while the temperature equilibrates. Check and adjust the focus daily. NOTE: We observe that the focus becomes stable after the first 24 h. However, it is advisable to monitor the focus. Alternatively, use a software-based autofocus system.
After 7 days, stop acquisition and proceed to post-imaging immunocytochemistry (see section 5).
After immunocytochemistry, replace the plate in the microscope incubator, find the zero-point, reset XYZ = 0 and reload the experiment with saved positions. Acquire the fluorescence images of each position using appropriate fluorescence filters.
5. Post-imaging Immunocytochemistry
After 7 days in culture, fix the cell culture with 4% Paraformaldehyde (PFA) fixative for 15 min at room temperature. CAUTION: PFA is toxic and should be handle in a chemical fume hood.
Rinse with 0.5 mL PBS 0.1 M for 5 min. Repeat 3 times.
Incubate in primary antibodies overnight at 4 °C in 0.5% triton and 10% of normal goat serum in PBS 0.1 M. NOTE: Use anti-Microtubule Associated Protein 2 (MAP2) antibody to confirm the neuronal phenotype (mouse IgG1, 1:1,000) and anti-GFP to label the transduced cells (chicken antibody, 1:500). Other antibodies can be used to detect progenitor or glial cells.
Rinse with 0.5 mL PBS 0.1 M for 5 min. Repeat 3 times.
Dilute secondary antibodies in 0.5% triton and 10% of normal goat serum in PBS 0.1 M and incubate for 2 h at room temperature. Recommended dilution: 1:1,000.
Rinse with 0.5 mL PBS 0.1 M for 5 min. Repeat 3 times.
For nuclei staining, incubate the cells for 5 min with 0.1 µg/mL 4′6′-diamino-2-phenylindone (DAPI) in PBS 0.1 M.
Rinse with 0.5 mL PBS 0.1 M for 5 min. Repeat 3 times.
Keep the cells in PBS 0.1 M and protect from light (e.g., wrap the plate with foil).
6. Cell Tracking
NOTE: Here, we briefly describe the main steps to analyze time-lapse video-microscopy data using the software The Tracking Tool (tTt), which is available at the link provided in Table of Materials.
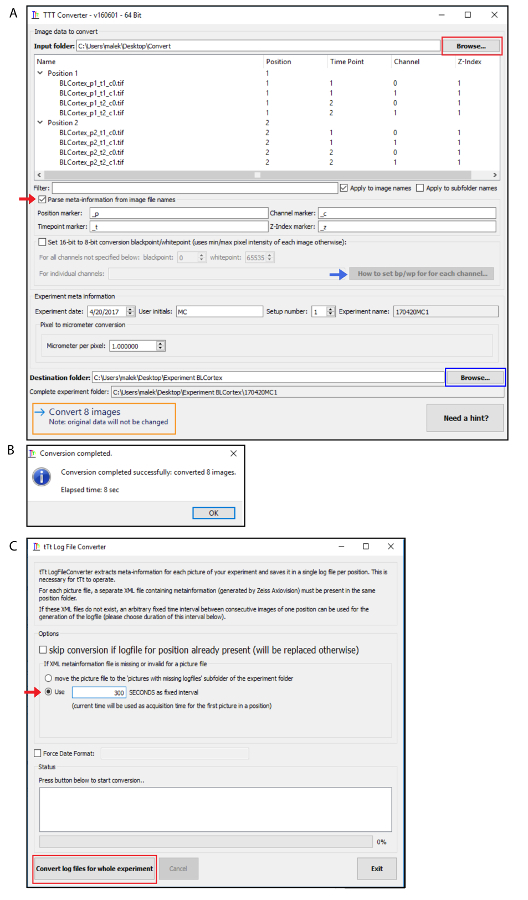
NOTE: If the image acquisition is performed with other software, import the image data with tTt Converter available in the tTt installer (link provided in Table of Materials). Only png, tif or jpg image formats are accepted. Follow the steps shown at Figure 1 A - B after starting the tTt Converter.
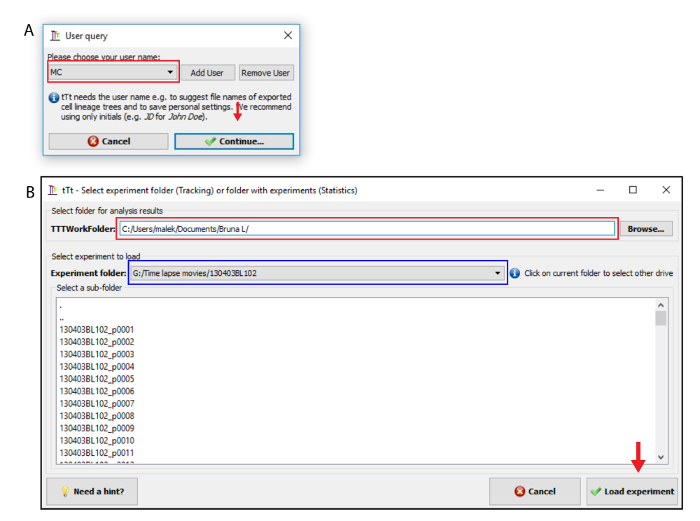
Start the software tTt and choose a user name. Click on "add user" and "continue" button (Figure 2A). Browse and select the "TTTWorkFolder" (Figure 2B). Lineages trees, statistics and exported images will be saved in this folder. Next, select the experiment to be analyzed and load it (Figure 2B).
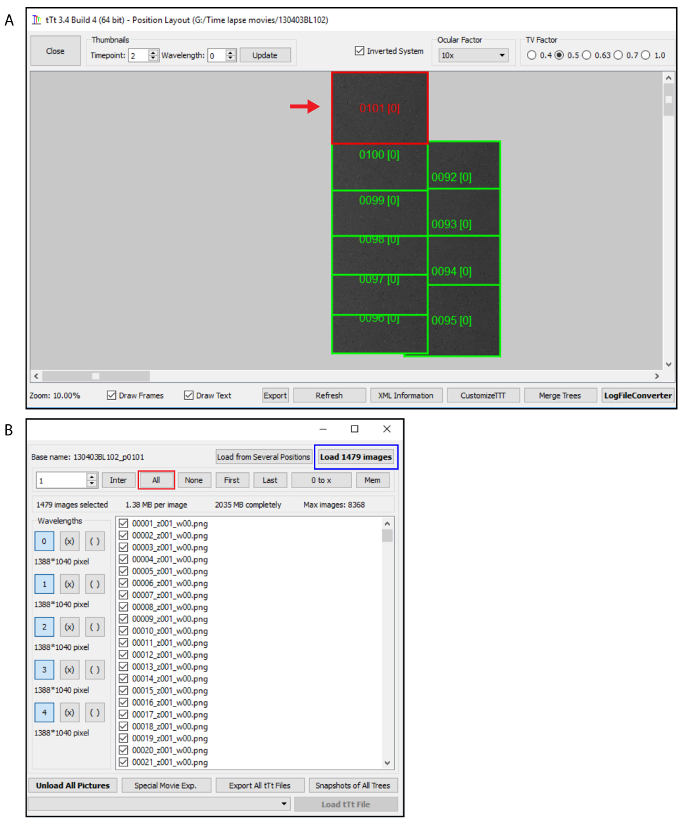
If the images were converted previously by tTt Converter, click on "LogFileConverter" (Figure 3A) and specify the number of seconds between two consecutive time points in the LogFileConverter window. Click on "Convert log files for whole experiment" (Figure 1C).
In a list of images, which appear in the tTt window, select the desired images that by loading manually or using the option displayed in the program. Load images (Figure 3).
Select File > Open > New colony. Click on "Tracking", followed by "Start Tracking" to start the tracking in a chosen position.
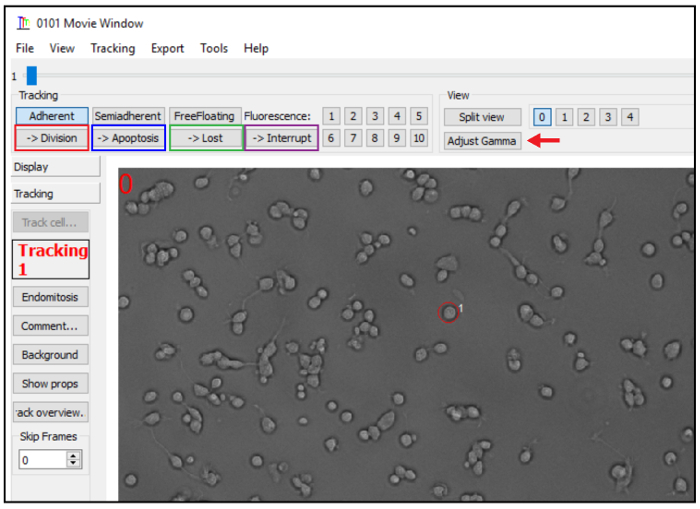
A movie window will appear (Figure 4). Select the cell using the tracking circle and press the key 0. The software will go to the next frame. Keep on positioning the tracking circle around the tracked cell using the mouse and click 0 in each frame to add a track mark on the cell.
Use the keys 1 and 3 to move to the previous or next frame, respectively. To delete a track mark, just click on the correct position to mark and press 0.
If the cell divided, select the button "division" (red rectangle at Figure 4). Continue tracking one daughter cell by pressing Shift+D. To track the second daughter cell, select it in the cell editor and press F2.
If the cell died during the video microscopy, select "apoptosis" (blue rectangle at Figure 4). NOTE: Although the software labels the event as "apoptosis", other mechanisms may be responsible for the cell death.
If the cell leaves the field of observation or intermingles with neighboring cells precluding tracking, select "lost" (green rectangle at Figure 4).
To stop tracking and continue later click on "interrupt" (purple rectangle at Figure 4). NOTE: In the Cell editor window a tree will be generated during the tracking. To save the lineage tree, select File > Save > Current tree (in the Cell editor window).
To start tracking a different cell, click on the cell using the right mouse button or select the cell using the left mouse button and click on Tracking > Start Tracking.
To export the movie with the tracking data, the software should not be in "tracking mode". To turn off the tracking mode, execute step 6.10. In the Movie window select Export > Movie. Set up the format, range of frames, number of frames per second and bitrate. Click on "Start export".
7. Quantifications
NOTE: Several measurements can be performed using video microscopy data46. Here, we describe three possibilities that are exemplified later in the "representative results" section.
Quantify the cell survival for each cell lineage by dividing the number of cells alive at different time points by the total number of cells generated before these time points were reached within individual clones37.
Quantify the proportion of symmetric progenitor (SP, both daughter cells continue to proliferate), asymmetric (A, one daughter cell continues to proliferate and the other becomes postmitotic), or symmetric terminal (ST, both daughter cells become postmitotic)15,38.
Measure the cell cycle length by calculating the time span of proliferating cells between their generation and division15.
Representative Results
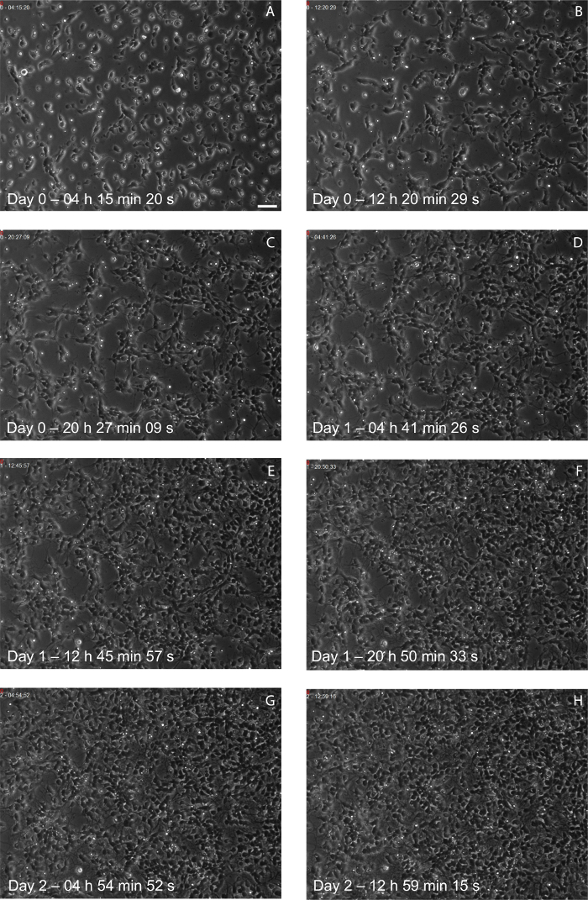
Primary cultures of cerebral cortex cells isolated from embryos E14 contain both progenitor and neuronal cells. During the period of imaging, progenitors undergo several rounds of cell division, increasing the number of cells (Figure 5 and Video Figure 1).
Retroviral-mediated transfection of a few progenitor cells facilitates the identification of cell clones (Figure 6). Note that GFP expression is detectable after 24 h. At this time-point, it is possible to identify GFP-expressing cells in phase contrast images and track them back to complete the lineage. The GFP images included here do not have a good contrast because: 1) endogenous GFP expression was observed a few days after retroviral transduction; 2) images were taken using a 10X long-distance objective through the plastic bottom of a 24-well plate; and 3) the fluorescence exposure time is set to the minimum detection of GFP signal without damaging cells (phototoxicity).

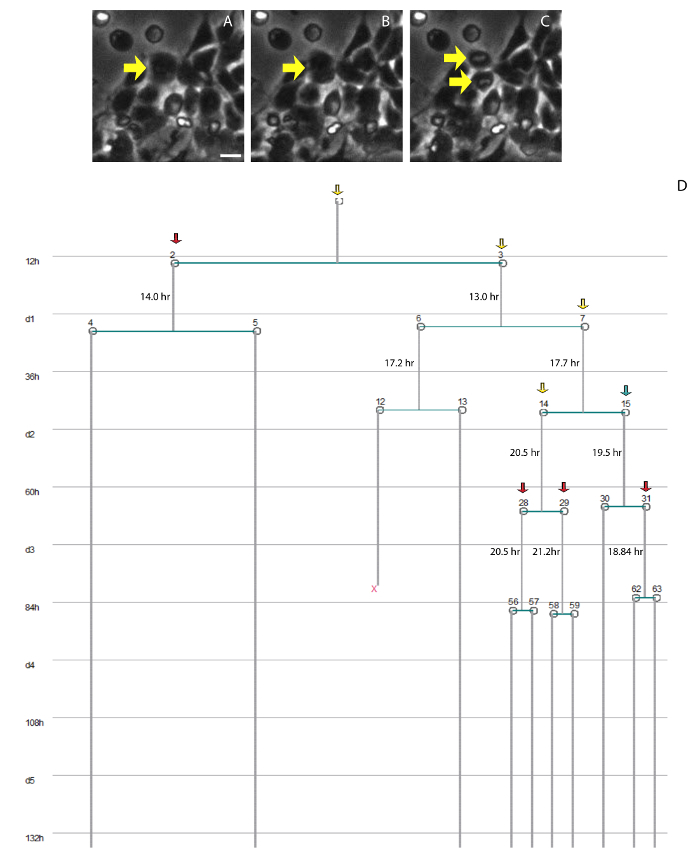
The tracking of single progenitor cells generates lineage trees revealing important information about their lineages (Figure 7). Based on these lineage trees, we can assess the clonal connection among differentiated cells, measure the cell cycle length, evaluate the mode of cell division based on the proliferative behavior of daughter cells (Symmetric Proliferative-both daughter cells undergo new cycle of cell division; Asymmetric - one daughter cell undergoes a new cycle of cell division and the other becomes postmitotic; Symmetric Terminal - both daughter cells become postmitotic), and quantify cell survival, cell speed and cell growth rate3,15,37,47.
Post-imaging immunocytochemistry using antibodies against the neuronal marker MAP2 and the reporter protein GFP shows differentiated neurons and non-neuronal cells generated from cortical progenitors that have been tracked (Figure 8).
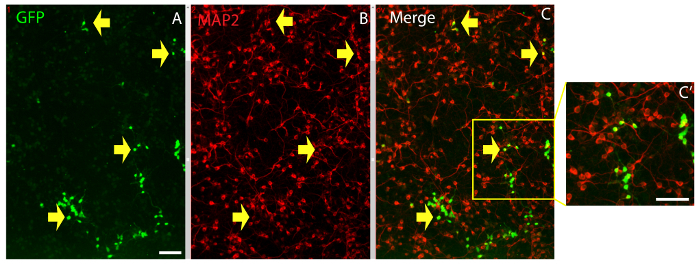
Figure 1. Using "tTt Converter" to analyze time-lapse imaging acquired from another software. (A) Browse the image data to add them directly into the input folder (red rectangle). Activate the "Parse meta-information from image file names" for different positions, imaging channels or z-indexes (red arrow). tTt Converter automatically converts 16-bit images to 8-bit, however to specify the black- and white-point for each imaging channel, it is necessary to enable the "Set 16-bit to 8-bit black/whitepoint" option. More information about this step is available at "How to set bp/wp for each channel" bottom (red arrow). After editing the "Experiment meta information" section, browse the destination folder (blue rectangle) and click on "Convert x images" (orange rectangle). (B) Window of completed conversion. (C) Definition of seconds as fixed interval at "tTt Log File Converter" window (red arrow) before loading the images for tracking. Please click here to view a larger version of this figure.
Figure 2. Selection of experiment at tTt. (A) In the User query window, click on "Add User" and enter user initials followed by selecting the "Continue" option. (B) Browse the folder for analysis at "TTTWorkFolder" section (red rectangle) and select the experiment at "experiment folder" section (blue rectangle). Next load the experiment (red arrow). Please click here to view a larger version of this figure.
Figure 3. Selection of images. (A) Select the position to be analyzed (red rectangle). If the images were converted click on "LogFileConverter" and proceed as shown in Figure 1C. (B) Select the "all" bottom (red rectangle) and load the images (blue rectangle). Please click here to view a larger version of this figure.
Figure 4. Tracking window. (A) Adjust the brightness and contrast using the "adjust gamma" button and select the "Division" (red rectangle), "Apoptosis" (blue rectangle), "Lost" (green rectangle) or "Interrupt" (purple rectangle) option for cell division, cell death, cell lost or to stop tracking, respectively. Please click here to view a larger version of this figure.
Figure 5. Phase contrast images obtained by time-lapse video-microscopy at different time points. (A-H) Photomicrographs showing phase contrast images of a primary cerebral cortex cell culture at (A) Day 0, 04 h 15 min 20 s, (B) Day 0, 12 h 20 min 29 s, (C) Day 0, 20 h 27 min 09 s, (D) Day 1, 04 h 41 min 26 s, (E) Day 1, 12 h 45 min 57 s, (F) Day 1, 20 h 50 min 33 s, (G) Day 2, 04 h 54 min 52 s, and (H) Day 2, 12 h 59 min 15 s. Note the significant increase in cell density over time. Scale bar: 50 µm Please click here to view a larger version of this figure.
Figure 6. GFP expression in retrovirally-transduced cells. Phase contrast images (A-G) and GFP fluorescent images (A'-G') at the same time point. Note that GFP expression is absent during the first hours of imaging and starts to increase over time. (A-A') Day 0, 16 h 01 min 05 s, (B-B') Day 0, 21 h 49 min 26 s, (C-C') Day 1, 06 h 29 min 33 s, (D-D') Day 1, 15 h 35 min 00 s, (E-E') Day 2, 00 h 40 min 10 s, and (F-F') Day 2, 09 h 44 min 28 s. (F'') High magnification of the dashed box in F'. Yellow arrows (B-F) indicate the phase contrast image of a cell expressing GFP (B-F`). Scale bar: 50 µm Please click here to view a larger version of this figure.
Figure 7. Cell lineage of single progenitor cells. (A-C) Phase contrast images showing an example of cell division. (A) Progenitor cell round up. (B) Cell membrane constriction. (C) Mitosis completion. (D)Example of a single-cell lineage tree generated in the software tTt. Colored arrows indicate different modes of cell division: Symmetric Proliferative (yellow arrow); Asymmetric (blue arrow); Symmetric Terminal (red arrow). "X" indicates cell death. Numbers indicate the cell cycle length of the progenitor cells. Scale bar: 50 µm Please click here to view a larger version of this figure.
Figure 8. Post-imaging immunocytochemistry identifies neuronal cells. Cerebral cortex cells immunostained with antibodies against GFP (A) and the neuronal marker MAP2 (B). Merged images in (C) and higher magnification of merged images in (C'). Yellow arrows point to GFP+ cells expressing MAP2. Tracking these cells back to the beginning of the experiment allows the identification of sibling neurons in the culture. Scale bars: 100 µm Please click here to view a larger version of this figure.
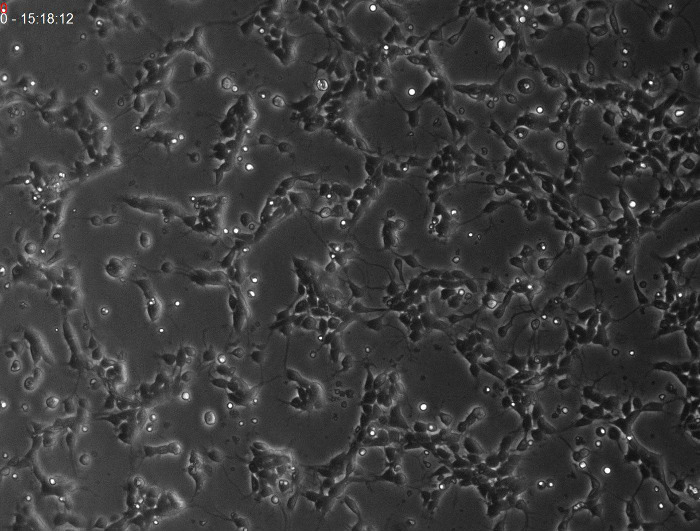 Movie 1. Time-lapse video microscopy of primary cerebral cortex cell culture. Phase contrast images acquired every 20 min displaying the detailed behavior of the cells in vitro.
Please click here to view this video. (Right-click to download.)
Discussion
Real time observation of primary cerebral cortex cells allows the analysis of cell proliferation, mode of cell division, cell cycle length, cell differentiation and cell survival3,14,15,37. More importantly, it permits the study of single-cell lineages, leading to the identification of the intermediate phases enacted during the progression from NSCs to neurons3. Finally, the combination of this culture system with bioengineering tools to manipulate gene expression is a powerful technique to study the cell-autonomous effect of selected targets5. The method described here can be modified to study the lineage of cerebral cortex progenitors isolated at different developmental stages14, as well as NSCs isolated from other sources38,42. Similar methods have also been used to study cell lineages in the developing retina41.
Here, we show a simple experiment using retroviral-mediated transfection to label progenitor cells with a reporter fluorescent protein. However, similar goals can be achieved using other viral vectors, chemical/electrical transfection or transgenic animals expressing fluorescent proteins under the control of neural cell-type specific promoters38,39. All these methods to control gene expression can also be applied to induce or suppress the expression of genes of interest, allowing the study of molecular mechanisms involved in neural stem cell lineage progression15,18,39. We also foresee that this system can be used to evaluate how different expression levels of specific proteins regulate NSC behavior and neuronal/macroglial differentiation, similar to what has been done in the hematopoietic system40. Also, it may help to shed light on the potential of single progenitors to generate separate neuronal lineages.
Compared to other techniques aimed at imaging mammals NSCs in live-animals or in slice cultures, the method described here has some important advantages. Firstly, the low-cost of the method is a significant benefit. Simple inverted microscopes equipped with transmitted and fluorescence lights and a camera controlled by computer-based software can be used to acquire images of 2D cultures for up to several weeks. Secondly, the number of animals used for these experiments is significantly smaller than in other methods. Thirdly, the system allows a precise control of environmental conditions, thus permitting the analysis of cell-autonomous and non-cell-autonomous effects of different manipulations. Finally, individual cells can be unambiguously observed for up to 15 days, allowing the precise reconstruction of large lineage trees, which is currently not possible both in cerebral cortex slice cultures or in vivo. On the other hand, the system may present disadvantages associated with the loss of tissue organization. Therefore, we recommend that the cellular behaviors observed in these 2D cultures should be ideally confirmed by other experiments in vivo.
Previous data using this system show that the cell cycle lengthening of the cortical progenitor in vivo48 is reproduced in vitro15. The neurogenic and gliogenic potential of individual cerebral cortex progenitors are also mimicked in the 2D culture system described here3. Finally, cell proliferation and cell cycle exit ratios observed in vivo can also be mimicked using this cell culture system15,18. Thus, we believe that live-imaging of primary cerebral cortex cells cultured in the conditions described in this protocol is a powerful and user-friendly method to study cellular and molecular mechanisms controlling progenitor cell proliferation, neuronal and glial cell differentiation, and cell fate specification.
Disclosures
The authors have nothing to disclose.
Acknowledgments
This work was supported by CNPq (Conselho Nacional de Desenvolvimento Científico e Tecnológico), CAPES (Coordenação de Aperfeiçoamento de Pessoal de Nível Superior) and FAPERN (Fundação de Amparo a Pesquisa do Rio Grande do Norte).
References
- Kriegstein A, Alvarez-Buylla A. The glial nature of embryonic and adult neural stem cells. Annu Rev Neurosci. 2009;32:149–184. doi: 10.1146/annurev.neuro.051508.135600. [DOI] [PMC free article] [PubMed] [Google Scholar]
- Miller FD, Gauthier AS. Timing is everything: making neurons versus glia in the developing cortex. Neuron. 2007;54(3):357–369. doi: 10.1016/j.neuron.2007.04.019. [DOI] [PubMed] [Google Scholar]
- Costa MR, Bucholz O, Schroeder T, Götz M. Late Origin of Glia-Restricted Progenitors in the Developing Mouse Cerebral Cortex. Cereb Cortex. 2009;19(Suppl 1):i135–i143. doi: 10.1093/cercor/bhp046. [DOI] [PubMed] [Google Scholar]
- Knoblich JA. Mechanisms of asymmetric stem cell division. Cell. 2008;132(4):583–597. doi: 10.1016/j.cell.2008.02.007. [DOI] [PubMed] [Google Scholar]
- Costa MR, Müller U. Specification of excitatory neurons in the developing cerebral cortex: progenitor diversity and environmental influences. Front Cell Neurosci. 2015;8:449. doi: 10.3389/fncel.2014.00449. [DOI] [PMC free article] [PubMed] [Google Scholar]
- Schitine C, Nogaroli L, Costa MR, Hedin-Pereira C. Astrocyte heterogeneity in the brain: from development to disease. Front Cell Neurosci. 2015;9:76. doi: 10.3389/fncel.2015.00076. [DOI] [PMC free article] [PubMed] [Google Scholar]
- Temple S. Division and differentiation of isolated CNS blast cells in microculture. Nature. 1989;340(6233):471–473. doi: 10.1038/340471a0. [DOI] [PubMed] [Google Scholar]
- Davis AA, Temple S. A self-renewing multipotential stem cell in embryonic rat cerebral cortex. Nature. 1994;372(6503):263–266. doi: 10.1038/372263a0. [DOI] [PubMed] [Google Scholar]
- Qian X, Davis AA, Goderie SK, Temple S. FGF2 concentration regulates the generation of neurons and glia from multipotent cortical stem cells. Neuron. 1997;18(1):81–93. doi: 10.1016/s0896-6273(01)80048-9. [DOI] [PubMed] [Google Scholar]
- Qian X, Goderie SK, Shen Q, Stern JH, Temple S. Intrinsic programs of patterned cell lineages in isolated vertebrate CNS ventricular zone cells. Development. 1998;125(16):3143–3152. doi: 10.1242/dev.125.16.3143. [DOI] [PubMed] [Google Scholar]
- Qian X, et al. Timing of CNS cell generation: a programmed sequence of neuron and glial cell production from isolated murine cortical stem cells. Neuron. 2000;28(1):69–80. doi: 10.1016/s0896-6273(00)00086-6. [DOI] [PubMed] [Google Scholar]
- Shen Q, et al. The timing of cortical neurogenesis is encoded within lineages of individual progenitor cells. Nat Neurosci. 2006;9(6):743–751. doi: 10.1038/nn1694. [DOI] [PubMed] [Google Scholar]
- Ravin R, et al. Potency and fate specification in CNS stem cell populations in vitro. Cell Stem Cell. 2008;3(6):670–680. doi: 10.1016/j.stem.2008.09.012. [DOI] [PubMed] [Google Scholar]
- Costa MR, Kessaris N, Richardson WD, Götz M, Hedin-Pereira C. The marginal zone/layer I as a novel niche for neurogenesis and gliogenesis in developing cerebral cortex. J Neurosci. 2007;27(42):11376–11388. doi: 10.1523/JNEUROSCI.2418-07.2007. [DOI] [PMC free article] [PubMed] [Google Scholar]
- Costa MR, Wen G, Lepier A, Schroeder T, Götz M. Par-complex proteins promote proliferative progenitor divisions in the developing mouse cerebral cortex. Development. 2008;135(1):11–22. doi: 10.1242/dev.009951. [DOI] [PubMed] [Google Scholar]
- Noctor SC, Martinez-Cerdeno V, Ivic L, Kriegstein AR. Cortical neurons arise in symmetric and asymmetric division zones and migrate through specific phases. Nat Neurosci. 2004;7(2):136–144. doi: 10.1038/nn1172. [DOI] [PubMed] [Google Scholar]
- Noctor SC, Martínez-Cerdeño V, Kriegstein AR. Distinct behaviors of neural stem and progenitor cells underlie cortical neurogenesis. J Comp Neurol. 2008;508(1):28–44. doi: 10.1002/cne.21669. [DOI] [PMC free article] [PubMed] [Google Scholar]
- Bultje RS, Castaneda-Castellanos DR, Jan LY, Jan YN, Kriegstein AR, Shi SH. Mammalian Par3 regulates progenitor cell asymmetric division via notch signaling in the developing neocortex. Neuron. 2009;63(2):189–202. doi: 10.1016/j.neuron.2009.07.004. [DOI] [PMC free article] [PubMed] [Google Scholar]
- Williams BP, Read J, Price J. The generation of neurons and oligodendrocytes from a common precursor cell. Neuron. 1991;7(4):685–693. doi: 10.1016/0896-6273(91)90381-9. [DOI] [PubMed] [Google Scholar]
- Williams BP, Read J, Price J. Evidence for multiple precursor cell types in the embryonic rat cerebral cortex. Neuron. 1995;14(6):1181–1188. doi: 10.1016/0896-6273(95)90265-1. [DOI] [PubMed] [Google Scholar]
- Heins N, et al. Glial cells generate neurons: the role of the transcription factor Pax6. Nat Neurosci. 2002;5(4):308–315. doi: 10.1038/nn828. [DOI] [PubMed] [Google Scholar]
- Luskin MB, Pearlman AL, Sanes JR. Cell lineage in the cerebral cortex of the mouse studied in vivo and in vitro with a recombinant retrovirus. Neuron. 1988;1(8):635–647. doi: 10.1016/0896-6273(88)90163-8. [DOI] [PubMed] [Google Scholar]
- Luskin MB, Parnavelas JG, Barfield JA. Neurons, astrocytes, and oligodendrocytes of the rat cerebral cortex originate from separate progenitor cells: an ultrastructural analysis of clonally related cells. J Neurosci. 1993;13(4):1730–1750. doi: 10.1523/JNEUROSCI.13-04-01730.1993. [DOI] [PMC free article] [PubMed] [Google Scholar]
- Price J, Thurlow L. Cell lineage in the rat cerebral cortex: a study using retroviral-mediated gene transfer. Development. 1988;104(3):473–482. doi: 10.1242/dev.104.3.473. [DOI] [PubMed] [Google Scholar]
- Walsh C, Cepko CL. Clonally related cortical cells show several migration patterns. Science. 1988;241(4871):1342–1345. doi: 10.1126/science.3137660. [DOI] [PubMed] [Google Scholar]
- Walsh C, Cepko CL. Widespread dispersion of neuronal clones across functional regions of the cerebral cortex. Science. 1992;255(5043):434–440. doi: 10.1126/science.1734520. [DOI] [PubMed] [Google Scholar]
- Parnavelas JG, Barfield JA, Franke E, Luskin MB. Separate progenitor cells give rise to pyramidal and nonpyramidal neurons in the rat telencephalon. Cereb Cortex. 1991;1(6):463–468. doi: 10.1093/cercor/1.6.463. [DOI] [PubMed] [Google Scholar]
- Grove EA, Williams BP, Li DQ, Hajihosseini M, Friedrich A, Price J. Multiple restricted lineages in the embryonic rat cerebral cortex. Development. 1993;117(2):553–561. doi: 10.1242/dev.117.2.553. [DOI] [PubMed] [Google Scholar]
- Mione MC, Danevic C, Boardman P, Harris B, Parnavelas JG. Lineage analysis reveals neurotransmitter (GABA or glutamate) but not calcium-binding protein homogeneity in clonally related cortical neurons. J Neurosci. 1994;14(1):107–123. doi: 10.1523/JNEUROSCI.14-01-00107.1994. [DOI] [PMC free article] [PubMed] [Google Scholar]
- Mione MC, Cavanagh JF, Harris B, Parnavelas JG. Cell fate specification and symmetrical/asymmetrical divisions in the developing cerebral cortex. J Neurosci. 1997;17(6):2018–2029. doi: 10.1523/JNEUROSCI.17-06-02018.1997. [DOI] [PMC free article] [PubMed] [Google Scholar]
- Reid CB, Liang I, Walsh C. Systematic widespread clonal organization in cerebral cortex. Neuron. 1995;15(2):299–310. doi: 10.1016/0896-6273(95)90035-7. [DOI] [PubMed] [Google Scholar]
- McCarthy M, Turnbull DH, Walsh CA, Fishell G. Telencephalic neural progenitors appear to be restricted to regional and glial fates before the onset of neurogenesis. J Neurosci. 2001;21(17):6772–6781. doi: 10.1523/JNEUROSCI.21-17-06772.2001. [DOI] [PMC free article] [PubMed] [Google Scholar]
- Reid CB, Walsh CA. Evidence of common progenitors and patterns of dispersion in rat striatum and cerebral cortex. J Neurosci. 2002;22(10):4002–4014. doi: 10.1523/JNEUROSCI.22-10-04002.2002. [DOI] [PMC free article] [PubMed] [Google Scholar]
- Gao P, et al. Deterministic progenitor behavior and unitary production of neurons in the neocortex. Cell. 2014;159(4):775–788. doi: 10.1016/j.cell.2014.10.027. [DOI] [PMC free article] [PubMed] [Google Scholar]
- Schroeder T. Imaging stem-cell-driven regeneration in mammals. Nature. 2008;453(7193):345–351. doi: 10.1038/nature07043. [DOI] [PubMed] [Google Scholar]
- Morrow T, Song MR, Ghosh A. Sequential specification of neurons and glia by developmentally regulated extracellular factors. Development. 2001;128(18):3585–3594. doi: 10.1242/dev.128.18.3585. [DOI] [PubMed] [Google Scholar]
- Landeira BS, et al. Activity-Independent Effects of CREB on Neuronal Survival and Differentiation during Mouse Cerebral Cortex Development. Cereb Cortex. 2016. pp. 1–11. [DOI] [PMC free article] [PubMed]
- Costa MR, et al. Continuous live imaging of adult neural stem cell division and lineage progression in vitro. Development. 2011;138(6):1057–1068. doi: 10.1242/dev.061663. [DOI] [PubMed] [Google Scholar]
- Pilaz LJ, et al. Prolonged Mitosis of Neural Progenitors Alters Cell Fate in the Developing Brain. Neuron. 2016;89(1):83–99. doi: 10.1016/j.neuron.2015.12.007. [DOI] [PMC free article] [PubMed] [Google Scholar]
- Hoppe PS, et al. Early myeloid lineage choice is not initiated by random PU.1 to GATA1 protein ratios. Nature. 2016;535(7611):299–302. doi: 10.1038/nature18320. [DOI] [PubMed] [Google Scholar]
- Gomes FL, et al. Reconstruction of rat retinal progenitor cell lineages in vitro reveals a surprising degree of stochasticity in cell fate decisions. Development. 2011;138(2):227–235. doi: 10.1242/dev.059683. [DOI] [PMC free article] [PubMed] [Google Scholar]
- Ortega F, Berninger B, Costa MR. Primary culture and live imaging of adult neural stem cells and their progeny. Methods Mol Biol. 2013;1052:1–11. doi: 10.1007/7651_2013_22. [DOI] [PubMed] [Google Scholar]
- Ponti G, Obernier K, Guinto C, Jose L, Bonfanti L, Alvarez-Buylla A. Cell cycle and lineage progression of neural progenitors in the ventricular-subventricular zones of adult mice. Proc Natl Acad Sci U S A. 2013;110(11):E1045–E1054. doi: 10.1073/pnas.1219563110. [DOI] [PMC free article] [PubMed] [Google Scholar]
- Jagasia R, et al. GABA-cAMP response element-binding protein signaling regulates maturation and survival of newly generated neurons in the adult hippocampus. J Neurosci. 2009;29(25):7966–7977. doi: 10.1523/JNEUROSCI.1054-09.2009. [DOI] [PMC free article] [PubMed] [Google Scholar]
- Costa MR, Jagasia R, Berninger B. Directed Neuronal Differentiation of Embryonic and Adult-Derived Neurosphere Cells. In: Doering LC, editor. Protocols for Neural Cell Culture. New York: Humana Press; 2009. pp. 29–49. [Google Scholar]
- Hilsenbeck O, et al. Software tools for single-cell tracking and quantification of cellular and molecular properties. Nat Biotechnol. 2016;34(7):703–706. doi: 10.1038/nbt.3626. [DOI] [PubMed] [Google Scholar]
- Ortega F, et al. Using an adherent cell culture of the mouse subependymal zone to study the behavior of adult neural stem cells on a single-cell level. Nat Protoc. 2011;6(12):1847–1859. doi: 10.1038/nprot.2011.404. [DOI] [PubMed] [Google Scholar]
- Takahashi T, Nowakowski RS, Caviness VS., Jr The cell cycle of the pseudostratified ventricular epithelium of the embryonic murine cerebral wall. J Neurosci. 1995;15(9):6046–6057. doi: 10.1523/JNEUROSCI.15-09-06046.1995. [DOI] [PMC free article] [PubMed] [Google Scholar]


