Abstract
Currently, most in vitro models of wound healing, such as well-established scratch assays, involve studying cell migration and wound closure on two-dimensional surfaces. However, the physiological environment in which in vivo wound healing takes place is three-dimensional rather than two-dimensional. It is becoming increasingly clear that cell behavior differs greatly in two-dimensional vs. three-dimensional environments; therefore, there is a need for more physiologically relevant in vitro models for studying cell migration behaviors in wound closure. The method described herein allows for the study of cell migration in a three-dimensional model that better reflects physiological conditions than previously established two-dimensional scratch assays. The purpose of this model is to evaluate cell outgrowth via the examination of cell migration away from a spheroid body embedded within a fibrin matrix in the presence of pro- or anti-migratory factors. Using this method, cell outgrowth from the spheroid body in a three-dimensional matrix can be observed and is easily quantifiable over time via brightfield microscopy and analysis of spheroid body area. The effect of pro-migratory and/or inhibitory factors on cell migration can also be evaluated in this system. This method provides researchers with a simple method of analyzing cell migration in three-dimensional wound associated matrices in vitro, thus increasing the relevance of in vitro cell studies prior to the use of in vivo animal models.
Keywords: Bioengineering, Issue 126, cell migration, three dimensional, fibrin, wound healing, extracellular matrix, integrins, in vitro wound healing assay
Introduction
Wound healing is a complex process which results in the restoration of tissue integrity following injury. This process is broken into four overlapping stages encompassed by hemostasis, inflammation, proliferation and remodeling, which are each regulated by a complex combination of soluble cues, cell-matrix interactions, and cell-cell communications.1,2 The orchestration of these cues controls a multitude of cellular responses in wound healing including, importantly, cell migration.3,4 Cell migration is a highly dynamic process dependent on both cellular phenotypes and the biochemical and biophysical properties of the extracellular matrix milieu.5 Cells continuously probe their extracellular matrix environment through integrin-mediated pathways; this process allows cells to sense a wide range of matrix properties including topography, rigidity, and confinement. Two-dimensional (2D) analysis of cell migration demonstrates that migration is driven by lamellipodia formation at the leading edge through the generation of actin filament bundles. Subsequent formation of focal adhesions at the leading edge, in combination with actomyosin driven contraction and retraction at the trailing edge, drives the cell forward.6 Three-dimensional (3D) cellular migration is currently not well understood, however, recent studies demonstrate that 3D migration is markedly different than the afore described mechanism in 2D and is likely driven by alterative mechanisms. For example, recent studies by Petrie et al. demonstrated that, depending on the properties of the ECM, cells in 3D matrices can switch between lamellipodium and lobopodium driven mechanisms of migration.7 Because cell migration is a critical component of the wound healing response, 3D models of cell migration are critical for understanding physiological responses to various stimuli during wound healing. Although cell migratory behavior on 2D surfaces has been shown to vary greatly from migration in 3D matrices, most current in vitro models of cell migration during the wound healing process, including the well-established scratch assay, utilize 2D monolayer cultures.5,6,7,8,9,10,11,12,13,14 More recently-developed assays have utilized a 3D matrix, but still culture cells in a monolayer on top of the matrix, thus limiting the ability to truly recapitulate the three-dimensionality of the cell environment in vivo.15
The purpose of the method described herein is to study cell migration in a physiologically relevant 3D model, rather than on a 2D surface, in order to gain a more robust understanding of migration responses associated with the applied stimuli. This method allows for the evaluation of cell migration within a 3D fibrin clot matrix in the presence of factors that activate or inhibit pathways associated with cell migration. A fibrin matrix was chosen for this method due to the critical role fibrin plays in the early stages of wound healing; following injury, a fibrin clot is formed within wound environments to stem blood loss and serves as a scaffold for initial cell infiltration during tissue repair and remodeling.2,16,17,18,19,20 Additionally, fibrin is used clinically as a surgical sealant and the composition of the sealants has been tied to cell migration and ultimate healing outcomes. A previous study by Cox et al. investigated fibroblast migration with fibrin clots comprised of varying fibrin and thrombin concentrations for the purpose of optimizing a fibrin sealant. In these studies, migration of cells out of fibrin clots onto plastic dishes was quantified.20 Here we present a method that allows for quantification of migration of cells within the 3D fibrin environment. While the method described in this protocol specifically uses fibrin, this model can easily be modified to use alternative matrix materials as desired, such as collagen or other 3D matrices. Additionally, we present the use of fibroblast spheroids in this assay because fibroblast migration into the wound bed is of paramount importance to extracellular matrix synthesis and tissue repair/remodeling. However, during the repair process neutrophils are the first cell type to migrate into the wound bed, followed by macrophages. Fibroblasts then begin to infiltrate the wound environment approximately 48 hours after initial injury, at the beginning of the proliferative phase of the wound healing process.19 This assay could be easily modified to include neutrophils, macrophages, or other cell types to assess how alterations in fibrin clot structure affect migration of these cell types.21
To implement this assay, first, a fibroblast spheroid is formed using a modification of techniques previously described for stem cell culture.22 The fibroblast spheroid is subsequently transferred into a 3D fibrin matrix, and outgrowth can then be easily monitored and quantified over several days. This protocol takes into account the 3D of physiological systems by embedding 3D cell spheroids within a fibrin matrix, thus avoiding the limitations in relevance brought about by a using a 2D growth surface with a cell monolayer to model migratory behavior, while still allowing for evaluation of cell behavior in a highly controlled in vitro environment.
Protocol
1. Day 1: Cell and Reagent Preparation
NOTE: All cell and reagent preparation should be performed in a biological safety cabinet to prevent contamination of samples.
Warm filtered Dulbecco's Modified Eagle's Medium (DMEM), fetal bovine serum (FBS), L-glutamine, and penicillin/streptomycin in a 37 °C water bath.
Prepare neonatal human dermal fibroblast (HDFn) media by supplementing warmed DMEM with 10% FBS, 1% penicillin/streptomycin, and 1% L-glutamine.
Thaw a vial of frozen HDFns and centrifuge for 8 min at 200 x g to remove cryopreservation medium. Resuspend cells in prepared HDFn media at a density of 1 x 10⁶ cells/mL and seed into a T-75 culture flask.
Place flask in an incubator (37 °C, 5% CO2) to allow cell proliferation.
Store HDFn media at 4 °C.
Prepare pro- and anti-migratory reagents as needed.
2. Day 3: Spheroid Preparation
Perform the following in a culture hood to prevent contamination of samples.
When cells reach 80% confluency, aspirate media and add 5 mL of 0.25% Trypsin-EDTA. Store flask in a 37 °C incubator for 5 min to fully detach cells from the flask surface.
Add 5 mL of warmed media to the flask to neutralize the trypsin.
In a microcentrifuge tube, mix 10 μL of Trypan Blue and 10 μL of the cell suspension.
Centrifuge the original cell suspension for 8 min at 200 x g.
While the cell suspension is being centrifuged, add 10 μL of the Trypan Blue cell suspension to a hemocytometer and perform a cell count.
Following centrifugation, aspirate media without dislodging the cell pellet. Resuspend the cell pellet at a concentration of 1.25 x 10⁵ cells/mL.
Add 5 mL of sterile phosphate buffered saline (PBS) to the bottom of a 10 cm Petri dish to maintain a hydrated environment during spheroid growth.
Invert the lid of the Petri dish. Add several 20 μL drops of the cell suspension onto the inner surface of the Petri dish lid.
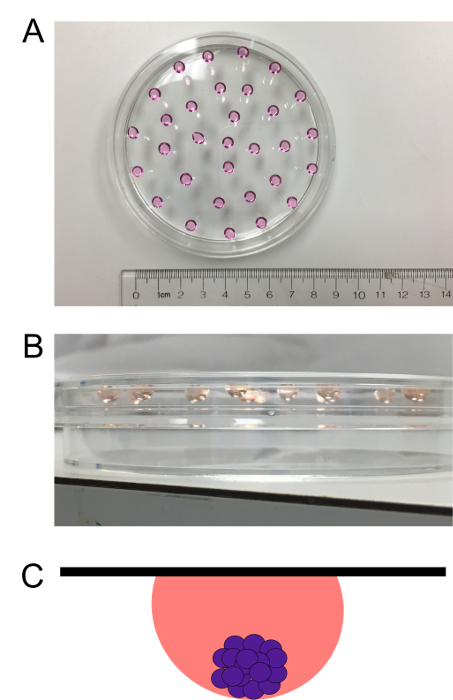
Quickly invert the lid again and place it back on the bottom of the dish, being careful not to dislodge the hanging drops. Figure 1 illustrates successfully formed hanging drops.
Carefully place the dish in a 37 °C incubator and allow spheroids to grow in a hanging drop culture for a period of 72 h.
3. Day 6: Embedding Spheroids into 3D Matrix
Perform the following in a culture hood to prevent contamination of samples.
- For the formation of first fibrin layer, create a clot solution of sufficient volume to add 100 μL of clot solution per well for as many wells as required (1 spheroid per well). Clots are comprised of 10% 10X HEPES buffer by volume (250 mM HEPES, 1500 mM NaCl, 50 mM CaCl2, pH 7.4), 2 mg/mL human fibrinogen, and 0.1 U/mL human alpha thrombin. The remainder of the clot volume is comprised of ultrapure water.
- Add thrombin last and quickly add solution to desired wells in a 48-well plate in order to prevent clots from polymerizing prior to being added to wells.
Gently shake/tap well plate to ensure that fibrin clot mixture is coating the entire well, and then place well plate in the incubator for 1 h to allow the bottom clot layer to polymerize. Do not shake well plate hard enough to induce bubble formation; simply rock plate as necessary until the entirety of the well is coated. If larger clot volumes are used, this step may not be necessary.
- Transfer spheroids to the fibrin layer.
- Remove the well plate and the Petri dish containing spheroids in the hanging drop culture from the incubator and examine spheroids under a microscope. Then place the dish into the culture hood.
- Carefully invert the lid of the Petri dish to allow access to the hanging drop cultures.
- Using a 21 G needle attached to a 1 mL syringe, carefully transfer one drop from the inverted lid into the center of each well, taking care not to puncture the polymerized fibrin layer coating the bottom of the well. To effectively transfer the drop, slowly pull the drop into the needle. Stop pulling the plunger back as soon as the entire drop is inside the needle; pulling the drop back too far may introduce air bubbles, which can disrupt effective spheroid transfer or subsequent imaging.
- Examine the well plate under a microscope to ensure that spheroids have properly transferred into all desired wells.
For the formation of second fibrin layer, create another clot solution using the same preparation as above for creation of the first fibrin layer (step 3.2). Carefully pipette 100 μL onto each spheroid-containing drop and examine under a microscope again to ensure that spheroids are still intact and have not been pushed to the edges of the wells.
Return the well plate to the incubator and allow the second layer to polymerize for 1 h.
4. Day 6: Addition of Pro-migratory or Inhibitory Factors
Warm HDFn media to 37 °C.
Perform the following steps in a hood to prevent contamination.
Prepare media for each group including appropriate concentrations of pro/anti-migratory agents to be evaluated.
Remove the well plate from incubator and place in a culture hood.
Add 500 μL of standard media to each well of the control spheroid group, 500 μL of inhibitory media to each well of the migration-inhibited spheroid group, and 500 μL of pro-migratory media to each well of the migration-enhanced spheroid group.
Return the well plate to the incubator.
Change media every 48 h.
5. Days 6-9: Evaluation of Cell Migration and Proliferation
Image spheroids using brightfield microscopy immediately after addition of media (0 h) and then every 24 h for 72 h. Optional: at each time point, take a z-stack image in order to determine if migration is occurring in planes outside of the primary area of focus. In our experience this does not occur; however, it is useful to ensure this is the case in every experiment.
Use ImageJ to determine cell outgrowth in each well by analyzing percent increase in area for each spheroid by tracing the cell border for each spheroid at each successive time point and using the "Measure" function to obtain the area.
Representative Results
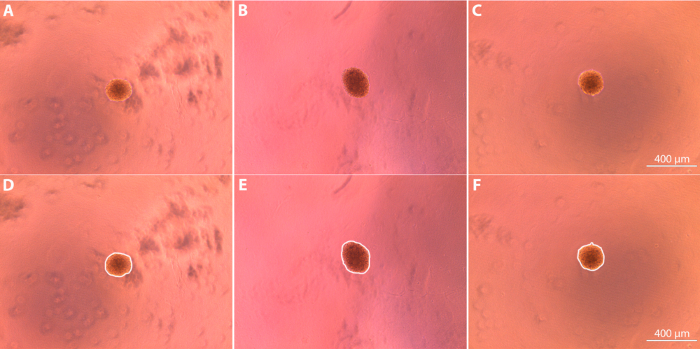
Spheroid culture can be utilized to successfully evaluate the effect of pro and anti-migratory agents on fibroblast migration in vitro 3D fibroblast spheroids can be formed via hanging drop culture over a period of 72 h (Figure 1). Following the culture period, spheroids are embedded within the clot matrix and imaged using brightfield microscopy (Figure 2). The initial areas of the spheroids (depicted in the figure as the areas bounded by the white borders) were determined using ImageJ and used as a reference point to determine the degree of subsequent cell outgrowth from the spheroid bodies. Initial average area measurements for the spheroids were determined to be 4.3 x 104 μm2 ± 1.1 x 104 μm2 for the control spheroids, 4.4 x 104 μm2 ± 1.1 x 104 μm2 for the pro-migratory spheroids, and 4.5 x 10⁴ ± 7.7 x 103 μm2 for the anti-migratory spheroids. Media containing pro- or anti-migratory factors was added to the spheroid-containing clots, and cell outgrowth from the initial spheroid body was imaged every 24 h, with final images taken 72 h after the original media was added (Figure 3).
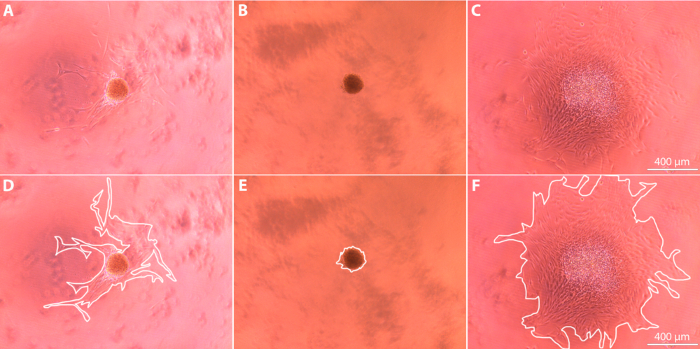
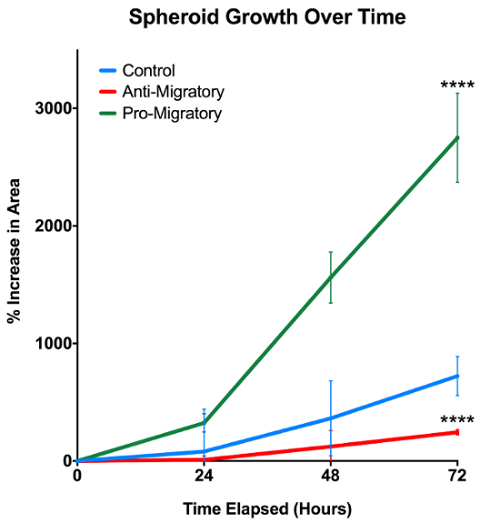
Upon completion of the experiment, spheroid growth over time was analyzed using ImageJ to calculate the changes in spheroid area for each sample. As shown in Figure 3, the outermost edge of the cell cluster at each time point was used to determine the time-specific degree of cell outgrowth. We expect that the out-of-focus spots shown in Figure 3 are cell debris, and we do not count this in our quantification. Full-size images show a clear, continuous cell border emerging from the spheroid body; it is this border that is traced when determining outgrowth. Cell outgrowth was quantified by normalizing the cell outgrowth area relative to the original spheroid body area at t = 0 h, and then expressing the growth as a percentage of the original spheroid area. Quantification of the cell outgrowth over the 72 h period reveals that spheroids exposed to a pro-migratory agent exhibit a significantly increased degree of migration away from the original spheroid body in comparison to spheroids exposed to a migration-inhibitory agent and to control spheroids exposed to standard media (p <0.0001, Figure 4). Conversely, spheroids exposed to an anti-migratory agent exhibited significantly decreased degree of migration away from the original spheroid body when compared to control spheroids (p <0.0001).
For comparison, we have provided an example of a scratch assay (Figure 5). This assay was performed by seeding fibroblasts at 500,000 cells/cm2 on 24 well-plates coated with 2 mg/mL fibrinogen. Fibroblasts were allowed to grow overnight. The well surface was then scratched with a pipette tip, and cell migration into the scratch area was imaged over 24 hours. As shown in representative images presented in Figure 5A, there are limitations to this assay; scratches are not very reproducible and in some cases, the boundaries are not clearly delineated. However, the overall migration trends in the presence of pro- and anti-migratory factors are the same as those present in the 3D spheroid assay, despite the aforementioned variability and the differences in modes of migration. It should be noted that migration rates are faster in the 2D scratch assay, compared to the 3D spheroid assay. Closure was fastest in the presence of the pro-migratory agent and all samples cultured in the presence of the pro-migratory agent were completely closed within 24 h.
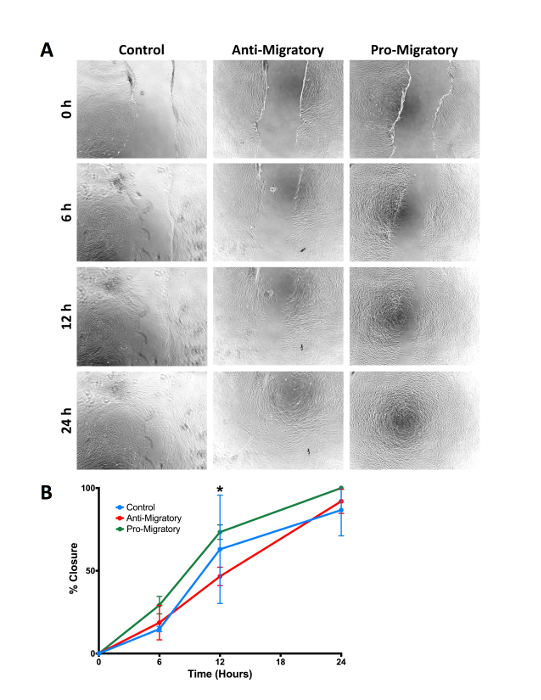
Figure 1: Human dermal fibroblasts in a hanging drop culture. Cells are left in a hanging drop culture for 72 h to induce spheroid formation. A top (A) and side (B) view of the hanging drop culture are presented. (C) Schematic depicting side view of spheroid formation in a hanging drop. The black line represents the top of the plate, the pink sphere represents the media, and the purple spheres represent the cells within the spheroid. Please click here to view a larger version of this figure.
Figure 2: Spheroid appearance after initial embedding in fibrin matrix (t = 0 h after addition of media) imaged using brightfield microscopy at 10X magnification. (A, D) Control spheroid; (B, E) Spheroid exposed to anti-migratory agent in media; (C, F) Spheroid exposed to pro-migratory agent in media. Images are shown with (D-F) and without (A-C) white lines that indicate the borders used to determine outgrowth area. Please click here to view a larger version of this figure.
Figure 3: Spheroid appearance after 72 h imaged using brightfield microscopy at 10X magnification. (A, D) Control spheroid; (B, E) Spheroid exposed to anti-migratory agent in media; (C, F) Spheroid exposed to pro-migratory agent in media. Images are shown with (D-F) and without (A-C) white lines that indicate the borders used to determine outgrowth area. Please click here to view a larger version of this figure.
Figure 4: Spheroid growth over 72 h. Pro-migratory and anti-migratory agents in media are shown to significantly impact fibroblast migration and proliferation in 3D environments. N = 3/group; **** represents p <0.0001. Error bars represent standard deviations. Please click here to view a larger version of this figure.
Figure 5: Comparison to standard 2D scratch assay. (A) Representative images of cell migration in a standard scratch assay over 24 hours. Fibroblasts were grown in media conditioned with pro- or anti-migratory factors, and differences in scratch closure were quantified over time. (B) Percent closure over time for fibroblasts grown in control, pro-migratory, or anti-migratory media. Although there are differences in modes of migration present in this 2D assay vs. the 3D spheroid assay, overall migration trends remain consistent. N = 3/group; * represents p <0.05. Error bars represent standard deviations. Please click here to view a larger version of this figure.
Discussion
This protocol allows for the examination of cell migration in wound healing associated ECMs through an in vitro 3D model. A crucial step in proper execution of the procedure is the proper development of fibroblast spheroids; cell concentration during preparation was optimized to give an initial concentration of 2,500 cells/drop, allowing spheroids to form reliably over an incubation period of 72 h. If an insufficient number of cells are used, spheroids may not aggregate effectively and may break apart upon being transferred and embedded into the fibrin layers. If different cell types are used, initial cell concentration and/or spheroid ripening time may have to be adjusted in order to obtain consistent, stable spheroid formation. For cell types that proliferate more slowly than fibroblasts, a much higher initial cell concentration may be necessary to ensure proper spheroid formation within the 72-hour time span. Cells should not remain in a hanging drop culture longer than 72 h due to the inability to change media on the spheroids while in culture. Differences in initial spheroid size are expected due to inherent biological variability; we address this variability by starting spheroid formation with a consistent number of cells to minimize size differences as much as possible and by normalizing growth over time to allow for data comparisons.
The primary challenge to the implementation of this method is the transfer of spheroids from a hanging drop culture into the clot matrix. This protocol uses a needle and syringe to aspirate the spheroid-containing droplet from the inverted Petri dish lid, but other methods, such as the use of tweezers or of micropipettes attached to trimmed tips, may also be applied to effectively transfer the spheroids from hanging drop to matrix. Spheroids can be transferred reliably by pulling the plunger of the syringe back slightly prior to transferring the droplet, and by ensuring that the droplet is drawn up into the needle slowly so that gas bubbles are not introduced into the droplet. The syringe plunger should only be pulled back just enough to bring the entire droplet into the needle; pulling back any further will also introduce bubbles and interfere with the reliable transfer of the spheroids into the wells of the well plate. Specialized hanging drop culture plates may also be used in order to simplify the spheroid culture, but are a less cost efficient means of doing so than simply using a standard dish.
During wound healing in vivo, fibroblasts that invade the wound area produce extensive serine proteases that result in fibrin matrix degradation. These cells subsequently synthesize new extracellular matrix, predominantly comprised of collagen, in order to repair the damaged tissue.23 This mechanism of migration allows for controlled invasion which is not captured by our method and represents a limitation of the system. It should also be noted that the fibroblasts utilized in this method will secrete proteases that would over time degrade the fibrin network; therefore, if long-term (>72 hours) migration studies are desired, protease inhibitors, such as aprotinin, should be added to the cell culture media.
Despite these limitations, this method provides a simple, cost-effective, and reproducible method in which to study 3D cell migration in vitro. While providing a more physiologically relevant environment than commonly used 2D models, growth analysis in the 3D model described herein maintains the straight forward analysis provided by 2D models. Spheroids are easy to visualize using simple brightfield or phase microscopy and, if desired, this method can easily be modified for use in fluorescence microscopy by fluorescently labeling cell membranes and matrix proteins. This protocol made use of neonatal human dermal fibroblasts due to the role of fibroblast migration in tissue repair/remodeling. If desired, neutrophils, macrophages, keratinocytes or other cell types could be used in this assay to assess how alterations in fibrin clot structure affect migration of other cell types involved in wound healing. The 3D material may also be modified as needed; depending on the desired application, collagen or other 3D matrix materials may be used in lieu of a fibrin matrix in order to provide a physiologically relevant model. A useful model for studying longer-term cell migration in a wound-like environment could be obtained with this protocol by using keratinocytes and collagen rather than fibroblasts and fibrin. The methods described also allow greater flexibility and cost-effectiveness in cell migration and wound healing studies through the implementation of a physiologically relevant in vitro model rather than requiring immediate in vivo work following classic two-dimensional in vitro studies.
Disclosures
The authors have nothing to disclose.
Acknowledgments
Funding for this work was provided through the American Heart Association (16SDG29870005) and the North Carolina State University Research and Innovation Seed Funding.
References
- Chester D, Brown AC. The role of biophysical properties of provisional matrix proteins in wound repair. Matrix Biol. 2016. [DOI] [PubMed]
- Martin P, Leibovich SJ. Inflammatory cells during wound repair: the good, the bad and the ugly. Trends in Cell Biology. 2005;15(11):599–607. doi: 10.1016/j.tcb.2005.09.002. [DOI] [PubMed] [Google Scholar]
- Lin B, Yin T, Wu YI, Inoue T, Levchenko A. Interplay between chemotaxis and contact inhibition of locomotion determines exploratory cell migration. Nat Commun. 2015;6:6619. doi: 10.1038/ncomms7619. [DOI] [PMC free article] [PubMed] [Google Scholar]
- Ngalim SH, et al. Creating Adhesive and Soluble Gradients for Imaging Cell Migration with Fluorescence Microscopy. J Vis Exp. 2013. [DOI] [PMC free article] [PubMed]
- Charras G, Sahai E. Physical influences of the extracellular environment on cell migration. Nat Rev. Mol Cell Biol. 2014;15(12):813–824. doi: 10.1038/nrm3897. [DOI] [PubMed] [Google Scholar]
- Petrie RJ, Yamada KM. Fibroblasts Lead the Way: A Unified View of 3D Cell Motility. Trends Cell Biol. 2015;25(11):666–674. doi: 10.1016/j.tcb.2015.07.013. [DOI] [PMC free article] [PubMed] [Google Scholar]
- Petrie RJ, Gavara N, Chadwick RS, Yamada KM. Nonpolarized signaling reveals two distinct modes of 3D cell migration. J Cell Biol. 2012;197(3):439–455. doi: 10.1083/jcb.201201124. [DOI] [PMC free article] [PubMed] [Google Scholar]
- Carlson MW, Dong S, Garlick JA, Egles C. Tissue-Engineered Models for the Study of Cutaneous Wound-Healing. Bioengineering Research of Chronic Wounds. 2009. pp. 263–280. http://link.springer.com/chapter/10.1007/978-3-642-00534-3_12.
- Doyle AD, Wang FW, Matsumoto K, Yamada KM. One-dimensional topography underlies three-dimensional fibrillar cell migration. J Cell Bio. 2009;184(4):481–490. doi: 10.1083/jcb.200810041. [DOI] [PMC free article] [PubMed] [Google Scholar]
- Fraley SI, et al. A distinctive role for focal adhesion proteins in three-dimensional cell motility. Nat Cell Biol. 2010;12(6):598–604. doi: 10.1038/ncb2062. [DOI] [PMC free article] [PubMed] [Google Scholar]
- Petrie RJ, Doyle AD, Yamada KM. Random versus directionally persistent cell migration. Nat Rev. Mol Cell Biol. 2009;10(8):538–549. doi: 10.1038/nrm2729. [DOI] [PMC free article] [PubMed] [Google Scholar]
- Rommerswinkel N, Niggemann B, Keil S, Zänker KS, Dittmar T. Analysis of Cell Migration within a Three-dimensional Collagen Matrix. J Vis Exp. 2014. [DOI] [PMC free article] [PubMed]
- Jonkman JEN, et al. An introduction to the wound healing assay using live-cell microscopy. Cell Adh Migr. 2014;8(5):440–451. doi: 10.4161/cam.36224. [DOI] [PMC free article] [PubMed] [Google Scholar]
- Lämmermann T, et al. Rapid leukocyte migration by integrin-independent flowing and squeezing. Nature. 2008;453(7191):51–55. doi: 10.1038/nature06887. [DOI] [PubMed] [Google Scholar]
- Chen Z, Yang J, Wu B, Tawil B. A Novel Three-Dimensional Wound Healing Model. J Dev Biol. 2014;2(4):198–209. [Google Scholar]
- Ross R, Benditt EP. Wound healing and collagen formation. The J Cell Biol. 1962;12(3):533–551. doi: 10.1083/jcb.12.3.533. [DOI] [PMC free article] [PubMed] [Google Scholar]
- Sproul EP, Argraves WS. A cytokine axis regulates elastin formation and degradation. Matrix Biol. 2013;32(2):86–94. doi: 10.1016/j.matbio.2012.11.004. [DOI] [PMC free article] [PubMed] [Google Scholar]
- Almine JF, Wise SG, Weiss AS. Elastin signaling in wound repair. Birth Defects REs C Embryo Today. 2012;96(3):248–257. doi: 10.1002/bdrc.21016. [DOI] [PubMed] [Google Scholar]
- Tracy LE, Minasian RA, Caterson EJ. Extracellular Matrix and Dermal Fibroblast Function in the Healing Wound. Adv Wound Care. 2016;5(3):119–136. doi: 10.1089/wound.2014.0561. [DOI] [PMC free article] [PubMed] [Google Scholar]
- Cox S, Cole M, Tawil B. Behavior of Human Dermal Fibroblasts in Three-Dimensional Fibrin Clots: Dependence on Fibrinogen and Thrombin Concentration. Tissue Eng. 2004;10(5-6):942–954. doi: 10.1089/1076327041348392. [DOI] [PubMed] [Google Scholar]
- Brown AC, Barker TH. Fibrin-based biomaterials: Modulation of macroscopic properties through rational design at the molecular level. Acta Biomaterialia. 2014;10(4):1502–1514. doi: 10.1016/j.actbio.2013.09.008. [DOI] [PMC free article] [PubMed] [Google Scholar]
- Bartosh TJ, Ylostalo JH. Preparation of anti-inflammatory mesenchymal stem/precursor cells (MSCs) through sphere formation using hanging drop culture technique. Curr Protoc Stem Cell Biol. 2014;28 doi: 10.1002/9780470151808.sc02b06s28. Unit-2B.6. [DOI] [PMC free article] [PubMed] [Google Scholar]
- Bainbridge P. Wound healing and the role of fibroblasts. J Wound Care. 2013;22(8):410–412. doi: 10.12968/jowc.2013.22.8.407. [DOI] [PubMed] [Google Scholar]


