Introduction
Magnetic resonance imaging (MRI) is frequently used to quantify and determine any association between muscle morphology and neuromusculoskeletal pathology or dysfunction through the evaluation of muscle cross-sectional area (CSA) (1, 2, 3, 4, 5, 6, 7) and muscle fatty infiltrate (MFI) (5, 8, 9, 10, 11, 12). These parameters of muscle morphology are also often investigated to identify expected age-related muscle changes (13, 14).
Many, though not all, studies analysing spinal muscle CSA and MFI report intra-and/or inter-rater reliability as part of their investigations (4, 5, 7, 15, 16), many of which demonstrate strong intra-rater reliability of lumbar erector spinae and multifidus CSA, with an intraclass correlation (ICC) ranging from 0.85 (5, 15) to 0.98 (4) and an inter-rater reliability ranging from 0.77 (7) to 0.85 (5). However, the specific reporting of intra-and/or inter-rater reliability findings is often lacking regarding the description of the methodology of assessor agreement and assessor experience. Further, most studies have published a global muscle CSA ICC for intra-rater reliability by reporting a single value, rather than distinguishing between the right and left sides. Battié and colleagues (17) have, however, detailed lumbar paraspinal muscle volume ICC for both the left and the right sides to range from 0.90 to 0.99 in patients with lumbar radiculopathy. Published inter-and intra-rater reliability outcomes of other trunk muscles have been noticeably limited, although one study was identified to report a global intra-rater reliability of the psoas muscle CSA, which was found to be high with an ICC of 0.92 (15).
Intra-and inter-rater reliability of MFI is less frequently reported in the literature compared to muscle CSA. In addition, due to the range of MFI quantification methods, MFI intra-and inter-rater reliability findings may not be easily compared across studies. Using opposed-phase MRI, intra-rater reliability of lumbar multifidus and erector spinae MFI was found to be high in patients with persistent low back pain, with an ICC range of 0.86 to 0.88 (5). This study also found an equally high inter-rater reliability (ICC 0.85 - 0.87) for MFI in these muscles.
Although the inter-rater reliability of generalised lumbar extensor muscle CSA has been identified, the reporting of inter- and intra-reliability metrics for the left and right sides of individual muscle CSA and MFI is infrequent. Furthermore, reports for other trunk muscles, such as the abdominals are, to our knowledge, lacking. Therefore, the purpose of this study was to identify an inter-rater reliability metric for the quantification of the left and right individual lumbar spine and abdominal muscle volume and MFI between two novice assessors.
Materials and Methods
Participants
Axial MRI scans of 10 healthy male participants from a University population who were recruited as part of a larger study were included. They were included if they were either 18-25 (young group, n=5) or 45-60 (mature group, n=5) years of age, had a Body Mass Index (BMI) of 25 or less (thus not classified as being overweight), and did not have current low back pain or a history of back pain in the last 12 months, previous spinal surgery or spinal fracture, neurological or orthopaedic disease, or open abdominal surgery. Participants were excluded if they were determined, by institutional standards, to be unsuitable for undergoing an MRI exam. All participants received a participant information sheet and provided written informed consent. Ethical approval for this study was secured by the Medical University of Vienna Ethics Committee (1609/2012).
Data collection
Transverse T1-weighted magnetic resonance images of the torso were obtained from the last thoracic vertebra to the sacrum (1.5T Siemens, Erlangen, Germany); slice thickness of 10mm, repetition time (TR) of 9.3ms, echo time (TE) of 4.6ms and rectangular field of view of 78%. Images were stored in DICOM format for processing.
Data analysis
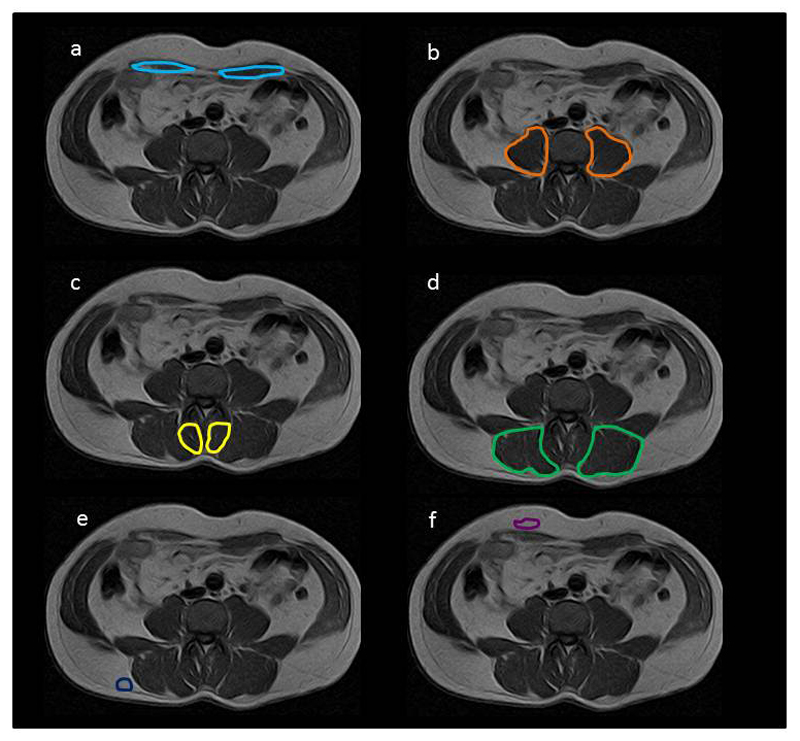
AnalyzeDirect software (Version 11.0) was used for data analysis. Data were analysed by two independent novice assessors; one in Vienna, Austria (SV) and one in Chicago, Il, USA (TDY). The assessors were considered to be novice, as they had less than 500 hours of experience in muscle volume analysis. Both had received training at different time points in tracing the Region of Interest (ROI) of axial muscles using the same software. Training was given by an assessor with more than 10 years of experience in MRI muscle volume assessment (JE). Axial slices from the most caudal aspect of the fifth lumbar vertebral body (L5) to the most cranial aspect of the first lumbar vertebral body (L1) were included for each participant, based on published CT and MRI axial images (18). The left and right sides of the erector spinae (ES), multifidus (M), rectus abdominis (RA), and psoas (PS) muscles of the lumbar spine were manually traced at each level and the ROI quantified (Figure 1). The summative volume of the left and right side for each muscle across L1-L5 was calculated separately. In addition, the combined ROI of M and ES (left and right side separately) was traced and quantified.
Figure 1.
Region of Interest (ROI) of (a) rectus abdominis (RA), (b) psoas (PS), (c) multifidus (M), (d) erector spinae (ES) and (e) back subcutaneous fat (f) abdominal subcutaneous fat.
For MFI, mean pixel intensity from the left and right sides of each muscle across all included slices was reported as a percentage of mean pixel intensity relative to an area of subcutaneous abdominal or back fat from the right side of the body (Figure 1), taken from an axial slice located between L4 and L5. Both assessors agreed on the axial slice to be used for fat ROI prior to data analysis. Fat content for RA was determined relative to abdominal fat and ES, M and PS fat content were determined relative to back fat. Data were evaluated based on the first ROI evaluation of both assessors and further ROI analysis performed two weeks later if low or moderate agreement between the two assessors occurred on the first evaluation.
Statistical Analysis
Statistical analysis was performed using SPSS (IBM, version 19). Normal distribution of muscle volume and MFI data were verified for both assessors using the Shapiro-Wilk test. Agreement between the two assessors for muscle volume and MFI was analysed using an ICC (3,1) and was further evaluated using Bland-Altman plots and Lin’s concordance coefficients.
Results
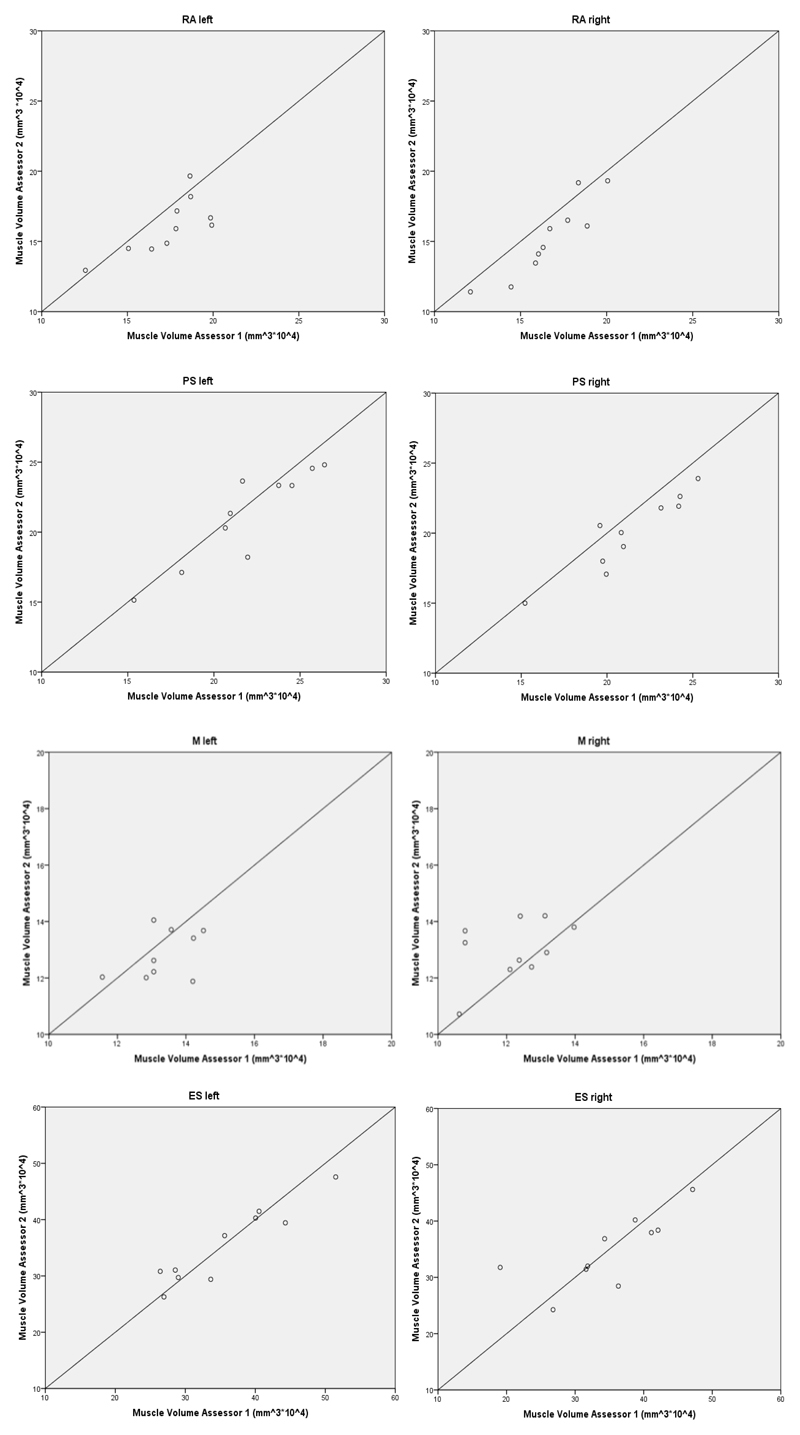
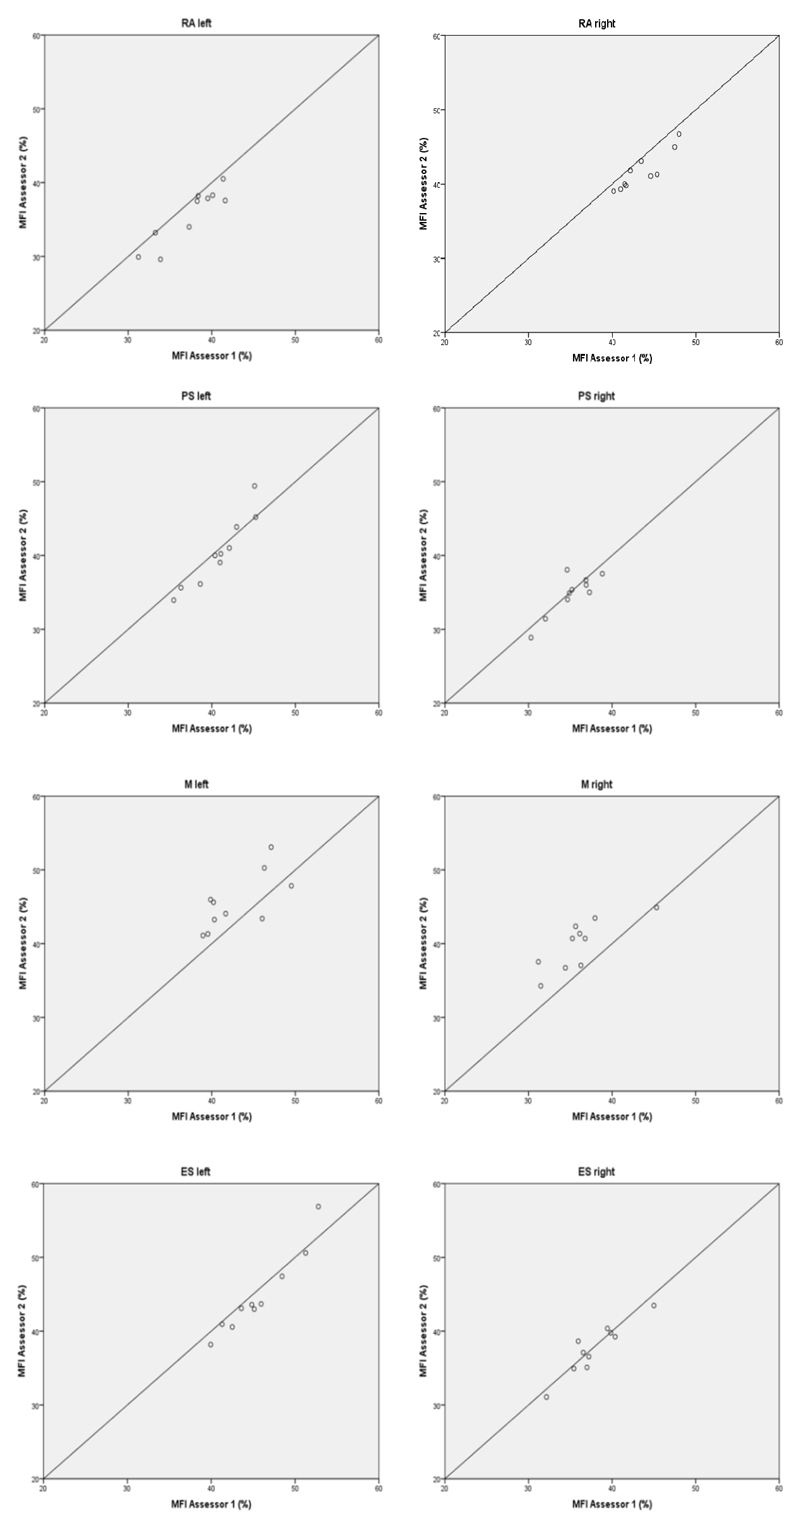
For muscle volume and MFI, RA, PS, ES individually, and M and ES combined showed a high ICC on first evaluation (Table 1). Muscle volume agreement for M was moderate on the first evaluation (ICC M left = 0.42, ICC M right = 0.59) and although M MFI agreement was high (ICC M left = 0.88, ICC M right = 0.931), M ROI was repeated by both assessors after which the agreement for M left volume increased (ICC = 0.82) but not for M right volume (ICC = 0.59). Table 1 shows the ICC for RA, PS and ES from the first evaluation and M ICC from the second evaluation. Figure 2 and 3 show the Bland-Altman plots and Figure 4 and 5 the Lin’s concordance graphs.
Table 1.
Intraclass correlations (ICC) of muscle volume and Muscle Fatty Infiltrate (MFI) for rectus abdominis (RA), psoas (PS), multifidus (M), erector spinae (ES) and M and ES combined (MES). Upper and lower bound confidence intervals (CI) are shown. Data from the first evaluation are shown for RA, PS and ES and M data from the second evaluation.
| Muscle volume | MFI | ||||||
|---|---|---|---|---|---|---|---|
| ICC | CI | ICC | CI | ||||
| lower | upper | lower | upper | ||||
| RA | left | 0.77 | 0.01 | 0.94 | 0.90 | 0.12 | 0.98 |
| right | 0.88 | -0.01 | 0.98 | 0.84 | -0.16 | 0.97 | |
| PS | left | 0.94 | 0.78 | 0.99 | 0.95 | 0.79 | 0.99 |
| right | 0.92 | 0.15 | 0.98 | 0.91 | 0.67 | 0.98 | |
| M | left | 0.82 | 0.27 | 0.96 | 0.83 | 0.29 | 0.96 |
| right | 0.59 | -0.63 | 0.90 | 0.88 | 0.50 | 0.97 | |
| ES | left | 0.96 | 0.84 | 0.99 | 0.96 | 0.85 | 0.99 |
| right | 0.93 | 0.72 | 0.98 | 0.96 | 0.85 | 0.99 | |
| MES | left | 0.905 | 0.512 | 0.978 | 0.784 | 0.120 | 0.947 |
| right | 0.921 | 0.327 | 0.984 | 0.819 | 0.162 | 0.957 | |
Figure 2.
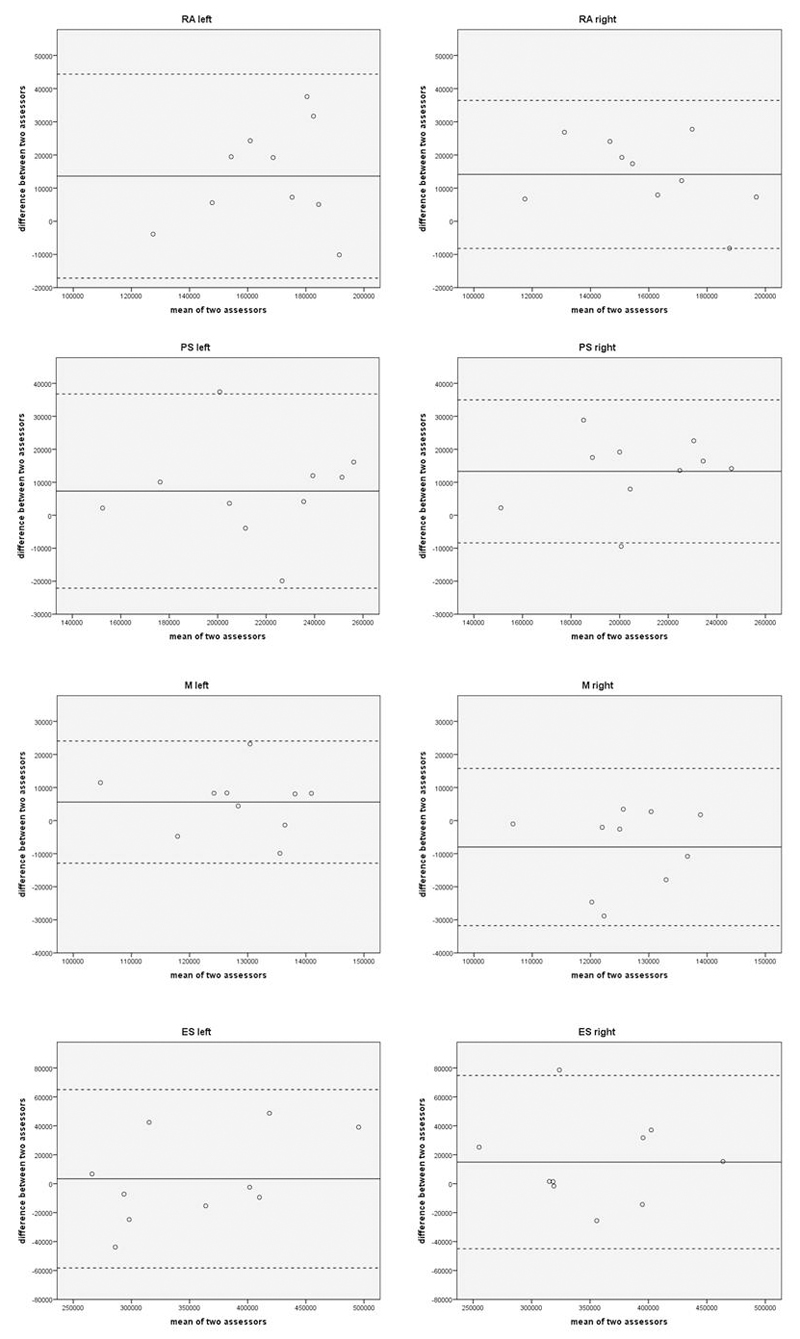
Bland-Altman plots of left and right rectus abdomins (RA), psoas (PS), multifidus (M) and erector spinae (ES) muscle volumes. In each plot, the continuous line represents the mean difference between the two assessors, the bottom broken line the mean minus twice the standard deviation (mean – 2*SD), and the top broken line the mean add twice the standard deviation (mean + 2*SD).
Figure 3.
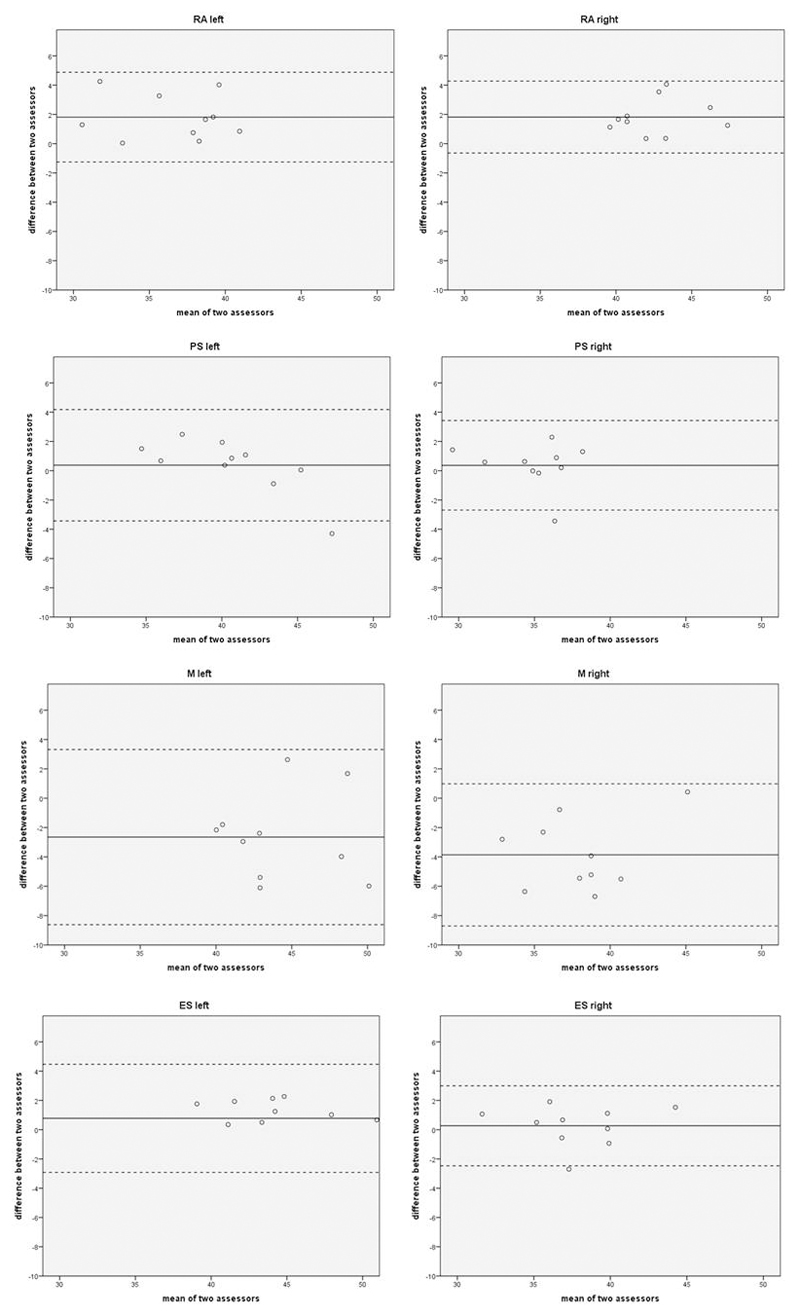
Bland-Altman plots of muscle fatty infiltrate (MFI) of left and right rectus abdomins (RA), psoas (PS), multifidus (M) and erector spinae (ES). In each plot, the continuous line represents the mean difference between the two assessors, the bottom broken line the mean minus twice the standard deviation (mean – 2*SD), and the top broken line the mean add twice the standard deviation (mean + 2*SD).
Figure 4.
Lin’s concordance graphs of muscle volume of left and right rectus abdomins (RA), psoas (PS), multifidus (M) and erector spinae (ES).
Figure 5.
Lin’s concordance graphs of muscle fatty infiltrate (MFI) of left and right rectus abdomins (RA), psoas (PS), multifidus (M) and erector spinae (ES).
Discussion
In order for muscle morphometric data obtained from MRI to be meaningful and transferable, inter and/or intra-rater outcomes should be adequately reported with regard to methodological detail and assessor experience. As this is often lacking, the present study identifies inter-rater reliability of muscle volume and MFI for the left and right sides of several trunk muscles individually. In existing literature, frequently the inter-rater reliability of combined muscles, rather than individual muscles, has been reported (7, 19, 20). To allow comparisons to the existing literature, combined extensor muscle agreement was also investigated in the present study in addition to the analysis of muscles individually. The results of the present study showed a high combined extensor muscle (MES) inter-rater reliability on first evaluation (ICC 0.91 – 0.92) in comparison to other studies. However, differences in the spinal levels analysed and the type of participants included exist between those other studies and the present study. For example, Meakin and colleagues (7) reported a lower inter-rater evaluation between two assessors of lumbar spine extensor muscle volume of 0.77, however this was based on the combined extensor muscles from one axial slice between L3 and L4 only. In that study, the experience of the two assessors was not described. Another study identified an inter-rater reliability of 0.83 to 0.85 for M and ES CSA between two assessors, based on images from 35 participants with low back pain (5). Unfortunately it was not clear from that study which values refer to which muscle and whether these findings are based on combined left and right side data. Furthermore, the experience of one of the assessors was not adequately described. In the cervical spine, extensor muscle CSA inter-rater reliability was also shown to be high between two assessors with an ICC of 0.84 (19), although in that study it was also not described whether these findings relate to combined muscles or individual muscle data or what the experience levels were of the assessors. Kilgour and colleagues (20) have more clearly defined inter-rater reliability between two assessors for some cervical spine muscle CSA individually (ICC of 0.92 for both obliquus capitis inferior and sternocleidomastoid muscles) and some muscles as a group (ICC 0.99 for combined trapezius, splenius and semispinalis muscles), based on T1 weighted MRI from 37 participants, although detail on assessor experience was also lacking.
The findings for M from the present study indicated that a single evaluation of M volume assessment in novice assessors yields only moderate agreement. This may indicate that novice assessors require further experience to more accurately determine M size, as agreement almost doubled on a second evaluation for M left (increase from 0.42 to 0.82), although not for M right. In patients with low back pain, a reduction in M CSA at the symptomatic side has shown to range from 2 to 62% (15) and even as high as 78% (21) using MRI. It has been suggested that M asymmetry greater than 10%, based on ultrasound images, is a potential indicator of dysfunction or pathology (2), although Niemenläinen and colleagues (4) identified a M asymmetry on MRI greater than the suggested 10% in more than 40% of their healthy study population. Unfortunately, all of the above studies were limited in the reporting of inter-rater agreement. The majority of these studies (2,4,15) only included one assessor thus not allowing an inter-rater evaluation, although some of these studies reported intra-rater agreement (4, 15) and some the amount of experience of the assessor (2, 4). Therefore, as intra- and/or inter-rater reliability outcomes are either poorly described or not reported at all, it may be that the asymmetry findings are, to some extent, influenced by within and between assessor reliability and it may be important that further studies report their assessor reliability data in more detail. The implication may be that the suggested 10% natural variability in muscle asymmetry may be considerably larger or smaller and future studies investigating this phenomenon should clearly describe their inter-rater agreement for meaningful interpretations.
We were unable to identify any studies that reported inter-rater reliability outcomes for RA or PS muscle size. Accordingly, the high inter-rater findings from the present study cannot be compared. Equally, due to a lack of reports on MFI inter-rater reliability, comparisons from the present study to existing literature is very limited; however, a high inter-rater reliability (ICC 0.85 - 0.87) for MFI in M and ES muscles using opposed-phase MRI has been shown (5). These values are similar to the findings in the present study for M and ES MFI (M 0.83-0.88; ES 0.96) although a different fat quantification method was used in the present study.
The Bland-Altman plots for muscle volume demonstrate that assessor 1 consistently reported larger measurements for all muscles compared to assessor 2, except for M right. This particular muscle also had the poorest agreement of all the muscles investigated. For all muscles except left and right M, assessor 1 reported a greater MFI compared to assessor 2, however the standard deviation of the mean difference was still very low at less than 3%, therefore good agreement can be assumed for MFI between the two novice assessors for all muscles investigated.
Even though both assessors in the present study should be considered novice assessors in ROI identification for the purpose of determining lumbar spine muscle volume, a high inter-rater reliability was identified for most of the muscles included on first assessment. This would indicate that for the larger muscles with a well-defined border, the reliability between novice assessors can be considered high, although for smaller muscles with less easily defined borders and more internal structure such as M, additional training or a greater number of repetitions of volume assessment of the same images should be considered to improve inter-rater reliability. The experience of the assessors or the number of ROI trials included is often lacking in studies reporting MRI muscle size or MFI inter-rater agreement. However, a novice and experienced assessor have shown high agreement (ICC 0.96-0.97) in identifying M thickness using ultrasound based on the average of three trials at two spinal levels (22). In that study, the experienced assessor had more than 17 years of experience in assessing muscles with ultrasound imaging, whereas the novice assessor had less than 10 hours of experience. That same study also showed that, even based on one trial, inter-rater reliability was good with an ICC of 0.85-0.87. This indicates that in ultrasound, inter-rater reliability of M thickness is high when comparing assessors with different experience levels, regardless of the number of trials included in the analysis. The present study also shows high inter-rater reliability outcomes using MRI for muscle size quantification.
The results of the present study should be interpreted considering some methodological constraints and limitations. Firstly, it would have been valuable to compare the muscle volumetric and MFI data from the novice assessors against those findings obtained by experienced assessors. Secondly, a greater sample size of a broader participant population could be included such as the inclusion of scans from female participants or from patients with low back pain in order to enhance the applicability of the study outcomes across a wider population. Thirdly, a further ROI evaluation could have been performed to highlight whether M volume agreement improved with further evaluations beyond two. These approaches could be adopted in future studies, thus further identifying inter-rater reliability of muscle volume and MFI of the trunk muscles.
In conclusion, first evaluation of muscle volume and MFI yields high to excellent inter-rater agreement, except for the multifidus muscle, where further training and/or experience is required to achieve acceptable reliability outcomes. This may have clinical implications due to the relevance of multifidus atrophy often reported in patients with low back pain, as studies which poorly describe their inter and intra-rater agreement evaluations or do not report this at all could potentially lead to over or under-estimation of the true cut-off of muscle asymmetries which can naturally occur in a healthy and functional population, or patients with low back pain.
Acknowledgements
The authors would like to thank the staff at the Diagnosezentrum Donaustadt, Vienna, Austria, in their assistance with the MRI data collection for this study. This study was made possible with financial support from the Austrian Science Fund (FWF), project number P24020.
References
- [1].Elliott J, Jull G, Noteboom JT, Galloway G. MRI study of the cross-sectional area for the cervical extensor musculature in patients with persistent whiplash associated disorders (WAD) Man Ther. 2008;13:258–265. doi: 10.1016/j.math.2007.01.012. [DOI] [PubMed] [Google Scholar]
- [2].Hides J, Gilmore C, Stanton W, Bohlscheid E. Multifidus size and symmetry among chronic LBP and healthy asymptomatic subjects. Man Ther. 2008;13:43–49. doi: 10.1016/j.math.2006.07.017. [DOI] [PubMed] [Google Scholar]
- [3].Matsumoto M, Ichihara D, Okada E, Chiba K, Toyama Y, Fujiwara H, Momoshima S, Nishiwaki Y, Takahata T. Cross-sectional area of the posterior extensor muscles of the cervical spine in whiplash injury patients versus healthy volunteers - 10year follow-up MR study. Injury. 2012;43:912–6. doi: 10.1016/j.injury.2012.01.017. [DOI] [PubMed] [Google Scholar]
- [4].Niemeläinen R, Briand MM, Battié MC. Substantial asymmetry in paraspinal muscle cross-sectional area in healthy adults questions its value as a marker of low back pain and pathology. Spine. 2011;36:2152–2157. doi: 10.1097/BRS.0b013e318204b05a. [DOI] [PubMed] [Google Scholar]
- [5].Paalanne N, Niinimäki J, Karppinen J, Taimela S, Mutanen P, Takatalo J, Korpelainen R, Tervonen S. Assessment of association between low back pain and paraspinal muscle atrophy using opposed-phase magnetic resonance imaging – A population-based study among young adults. Spine. 2011;36:1961–1968. doi: 10.1097/BRS.0b013e3181fef890. [DOI] [PubMed] [Google Scholar]
- [6].Ulbrich E, Aeberhard R, Wetli S, Busato A, Boesch C, Zimmerman H, Hodler J, Anderson SE, Sturzenegger M. Cervical Muscle Area Measurements in Whiplash Patients: Acute, 3, and 6 Months of Follow-up. J Magn Reson Imaging. 2012;36:1413–1420. doi: 10.1002/jmri.23769. [DOI] [PubMed] [Google Scholar]
- [7].Meakin JR, Fulford J, Seymour R, Welsman JR, Knapp KM. The relationship between sagittal curvature and extensor muscle volume in the lumbar spine. J Anat. 2013;222:608–614. doi: 10.1111/joa.12047. [DOI] [PMC free article] [PubMed] [Google Scholar]
- [8].Kjaer P, Bendix T, Sorensen JS, Korsholm L, Leboeuf-Yde C. Are MRI-defined fat infiltrations in the multifidus muscles associated with low back pain? BMC Medicine. 2007;5:2. doi: 10.1186/1741-7015-5-2. [DOI] [PMC free article] [PubMed] [Google Scholar]
- [9].Elliott JM, O’Leary S, Sterling M, Hendrikz J, Pedler A, Jull G. Magnetic Resonance Imaging Findings of Fatty Infiltrate in the Cervical Flexors in Chronic Whiplash. Spine. 2010;35:948–954. doi: 10.1097/BRS.0b013e3181bb0e55. [DOI] [PubMed] [Google Scholar]
- [10].Elliott J, Pedler A, Kenardy J, Galloway G, Jull G, Sterling M. The temporal development of fatty infiltrates in the neck muscles following whiplash injury: An association with pain and posttraumatic stress. PLoS ONE. 2011;6 doi: 10.1371/journal.pone.0021194. art.no.e21194. [DOI] [PMC free article] [PubMed] [Google Scholar]
- [11].Yanik B, Keyik B, Conkbayir I. Fatty degeneration of multifidus muscle in patients with chronic low back pain and in asymptomatic volunteers: quantification with chemical shift magnetic resonance imaging. Skel Radiol. 2012;42:771–778. doi: 10.1007/s00256-012-1545-8. [DOI] [PubMed] [Google Scholar]
- [12].Arbanas J, Pavlovic I, Marijancic V, Vlahovic H, Starcevic-Klasan G, Peharec S, Bajek S, Miletic D, Malnar D. MRI features of the psoas major muscle in patients with low back pain. Eur Spine J. 2013 doi: 10.1007/s00586-013-2749-x. Article in Press. [DOI] [PMC free article] [PubMed] [Google Scholar]
- [13].Takahashi K, Takahashi HE, Nakadaira H, Yamamoto M. Different changes of quantity due to aging in the psoas major and quadriceps femoris muscles in women. J Musculoskelet Neuronal Interact. 2006;6:201–205. [PubMed] [Google Scholar]
- [14].Asaka M, Usui C, Ohta M, Takai Y, Fukunaga T, Higuchi M. Elderly oarsmen have larger trunk and thigh muscles and greater strength than age-matched untrained men. Eur J Appl Physiol. 2010;108:1239–1245. doi: 10.1007/s00421-009-1337-6. [DOI] [PubMed] [Google Scholar]
- [15].Barker KL, Shamley DR, Jackson D. Changes in the cross-sectional area of multifidus and psoas in patients with unilateral back pain. Spine. 2004;29:E515–519. doi: 10.1097/01.brs.0000144405.11661.eb. [DOI] [PubMed] [Google Scholar]
- [16].Pezolato A, de Vasconcelos EE, Defino HLAD, Nogueira-Barbosa MH. Fat infiltration in the lumbar multifidus and erector spinae muscles in subjects with sway-back posture. Eur Spine J. 2012;21:2158–2164. doi: 10.1007/s00586-012-2286-z. [DOI] [PMC free article] [PubMed] [Google Scholar]
- [17].Battie MC, Niemelainen R, Gibbons LE, Dhillon S. Is level- and side-specific multifidus asymmetry a marker for lumbar disc pathology? The Spine Journal. 2012;12:932–939. doi: 10.1016/j.spinee.2012.08.020. [DOI] [PubMed] [Google Scholar]
- [18].Möller TB, Reif E. Taschenatlas der Schnittbildanatomie Band II: Thorax, Herz, Abdomen, Becken. Stuttgart: Georg Thieme Verlag; 2011. pp. 124–140. [Google Scholar]
- [19].Okada E, Matsumoto M, Ichihara D, Chiba K, Toyama Y, Fujiwara H, Momoshima S, Nischowaki Y, Takahata T. Cross-sectional area of posterior extensor muscles of the cervical spine in asymptomatic subjects: a 10-year longitudinal magnetic resonance imaging study. Eur Spine J. 2011;20:1567–1573. doi: 10.1007/s00586-011-1774-x. [DOI] [PMC free article] [PubMed] [Google Scholar]
- [20].Kilgour AHM, Subedi D, Gray CD, Deary IJ, Lawrie SM, Wardlaw JM, Starr JM. Design and validation of a novel method to measure cross-sectional area of neck muscles included during routine MR brain volume imaging. PLoS ONE. 2012;7 doi: 10.1371/journal.pone.0034444. art.no.e34444. [DOI] [PMC free article] [PubMed] [Google Scholar]
- [21].Hyun JK, Lee JY, Lee SJ, Jeon JY. Asymmetric atrophy of multifidus muscle in patients with unilateral lumbosacral radiculopathy. Spine. 2007;32:E598–E602. doi: 10.1097/BRS.0b013e318155837b. [DOI] [PubMed] [Google Scholar]
- [22].Wallwork T, Hides JA, Stanton WR. Intrarater and interrater reliability of assessment of lumbar multifidus muscle thickness using rehabilitative ultrasound imaging. J Orthopaedics Sports Phys Ther. 2007;37:608–612. doi: 10.2519/jospt.2007.2418. [DOI] [PubMed] [Google Scholar]


