Abstract
Heart Rate Variability (HRV) signal analysis provides a quantitative marker of the Autonomic Nervous System (ANS) function. A wristband-type wireless photoplethysmographic (PPG) device was custom-designed to collect and analyze the arterial pulse in the wrist. The proposed device is comprised of an optical sensor to monitor arterial pulse, a signal conditioning unit to filter and amplify the analog PPG signal, a microcontroller to digitize the analog PPG signal, and a Bluetooth module to transfer the data to a smart device. This paper proposes a novel model to represent the PPG signal as the summation of two Gaussian functions. The paper concludes with a verification procedure for HRV signal analysis during sedentary activities.
Index Terms: Wireless Reflectance Photoplethysmographic Sensor, Heart Rate Variability, Photoplethysmographic Signal Modeling, Design of a Photoplethysmographic Sensor
I. Introduction
Heart Rate Variability (HRV) is a valuable technique that is used to investigate the sympathetic and parasympathetic function of the Autonomic Nervous System (ANS) [1]. The HRV signal is determined based on the variations in the Peak-to-Peak (P-P) time interval of successive cardiac cycles known as R-R intervals [2]. Research has shown that a high HRV is an indication of good health and high level of fitness, whereas a decrease in HRV is associated with fatigue, stress, and even burnout [3]. For decades, the electrocardiogram (ECG) signal has been used to acquire Heart Rate (HR) information so as to detect abnormalities and diagnose heart-related disorders. Although ECG-based heart rate monitoring systems have been broadly used and improved for decades, as yet they have not been significantly upgraded in order to provide user flexibility and portability. This problem, however, may be alleviated by using photoplethysmographic (PPG) sensors. PPG sensors utilize a light-based technology in order to detect the amount of arterial blood volume changes (flow) in a confined area (for example a finger tip) as a consequence of the heart’s beating and pumping action. Basically, PPG sensors detect the differences or changes in the light intensity by reflection from or transmission through the tissue [4]. These differences or reflections are highly associated with the variations in the blood perfusion of the tissue and these variations can assist in detecting the heart-related information of the cardiovascular system [5]. PPG sensors are generally designed to operate in two dissimilar modes, which are called the transmittance mode and reflectance mode [4]. In the reflectance mode, the light source and the photodetector are placed side-by-side on a horizontal axis to be able to detect the reflected signals from the tissue. The benefit of using reflectance mode PPG sensors is that they are not limited to just a few measurement sites; they can be placed on a vast range of measurement locations such as the chest and wrist, which guarantee flexibility of the users specifically during physical activities. Thus, design and development of HR monitoring devices based on reflectance mode PPG sensors have the potential to support a variety of health and fitness-related applications.
I. Heart Rate Monitoring Device
This section explains in more detail the design procedure of the proposed PPG device.
The block diagram of the proposed PPG device as shown in Fig. 1 consists of two main stages: a signal detection stage and a signal conditioning stage. The signal detection stage uses a TCRT1000, which is a reflective optical sensor that is broadly used in a variety of applications. This sensor contains an infrared LED, which acts as an optical transmitter and a photodetector that serves as an optical receiver. Both the infrared (IR) emitter and photodetector are placed side-by-side in a leaded package in such a way that the photodetector can sense and measure the incident lights which are reflected back from the wrist. The signal conditioning stage takes advantage of filters and amplifiers to further manipulate the analog PPG signal and prepare it for the next stage of processing, which is commonly an ADC stage. The PPG signal is filtered and amplified to separate its two main components: the Alternating Current (AC) component and the Direct Current (DC) component. The AC component is mainly associated with the changes in arterial blood volume and is synchronous with the heart pulsation. Therefore, the AC component of the PPG signal provides heart-related information, while its DC component is related to the tissues and average blood volume. It is essential to remove the DC component so as to make the detection of the AC component easier. Thus, in the signal conditioning stage, the output from the TCRT1000 sensor is first passed through a passive High-Pass Filter (HPF) to reduce or preferably remove the DC component. Then, the output from the HPF goes through an active Low-Pass Filter (LPF), which is comprised of a dual-supply op-amp to ensure the output voltage swing between +Vcc and −Vcc rails. The main role of the active LPF is to simply amplify the low frequency signals and at the same time pass on its high frequency components unaffected. By combining the passive HPF and active LPF in the same circuit, two main objectives can be achieved simultaneously. On the one hand, the combination of these two filters can considerably help in eliminating the unwanted DC signal and in reducing the 50/60 Hz noise which is generated from the powerlines; on the other hand, it can assist in amplifying the low frequency AC part of the signal. The output from the first HPF/LPF combination then passes through a similar filtering and amplification stage (two more filtering and amplification stages are added in the proposed circuit) in order to further prepare the analog PPG signal. The PPG signal captured from a subject’s fingertip was displayed on an oscilloscope after going through three stages of filtering and amplification and is shown in Fig. 2a. A summing amplifier was also used after the filtering and amplification stages in order to shift the PPG signal up to the positive portion of the x-axis and make it ready for the next stage. In the ADC stage, an energy-efficient ARM Cortex-M0 microcontroller was used. In this stage, the PPG signal was initially converted to a digital format and subsequently was transmitted via a HC-05 Bluetooth module to a smart device. For purposes of flexibility, Bluetooth connectivity was used in this work. To further maximize the energy efficiency of the applied wireless technology, low-power Medium Access Control (MAC) protocols can also be used for the proposed design. The Printed Circuit Board (PCB) layout of the proposed PPG device was designed using the Altium Designer software and is shown in Fig. 2b, whereas Fig.3 shows the proposed PPG device itself and when it is worn by a subject.
Fig. 1.
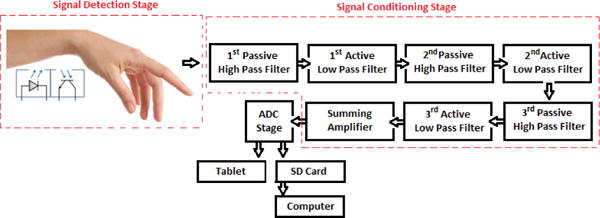
Block diagram of the proposed PPG device
Fig. 2.
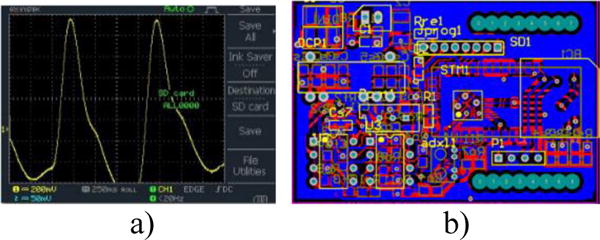
a) PPG signal captured from a subject’s fingertip on an oscilloscope b) PCB layout of the proposed device
Fig. 3.
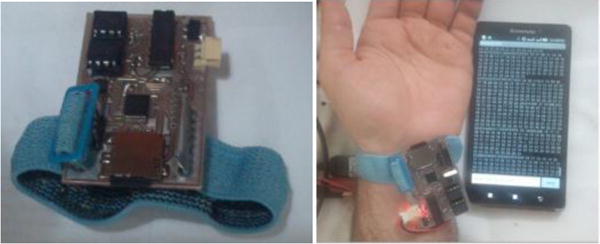
a) Proposed PPG device b) a subject has worn the proposed device.
II. Novel Representation Model of Photoplethysmographic Signal
This section proposes a novel model to represent the PPG signal based on a sum of Gaussian functions. Li et al. previously proposed a similar approach in [6] based on six Gaussian functions to approximate the original PPG signal. However, here we propose a novel approach based on only two Gaussian functions to model the original PPG signal. The new representation model of the proposed PPG signal is innovative and important, as it has the potential to be used in many applications such as diagnostic systems [7]. In addition, the proposed mathematical representation of the PPG signal can also be utilized in many health-monitoring applications that require various signal processing techniques including signal compression, prediction, and reconstruction. An additional advantage of such mathematical modeling is that it also helps to save significant resources used for signal storage, processing, analysis, and transmission. The efficiency of the new signal representation model is calculated based on the number of parameters that are required to approximate the PPG signal. Different number of Gaussians may be used to form signal representations with desired accuracy level. The representation of the PPG signal with a finite number of Gaussian functions is denoted as a Gaussian representation. The Gaussian representation is able to detect the sudden frequency and spatial changes in the PPG signal. In the next section, we show how Gaussian modeling is used to approximate the original PPG signal [8].
A. Gaussian Modeling
One approach to model and construct a photoplethysmographic signal is by the use of Sum of Gaussian (SOG) approximation. It has been proved that any non-Gaussian distribution can be approximated and modelled by a SOG distribution. The PPG signal is a non-Gaussian distribution that can be modelled by SOG functions. In mathematics, a Gaussian function is represented by its parameters; mean μ and varianceσ2. The proposed model for the PPG signal is shown in equation 2
| (2) |
where σ1,σ2,μ1,μ2,a1,a2 are the new parameters of the PPG signal. Fig. 4. Shows how we modeled an original PPG signal by adding two different Gaussian functions.
Fig. 4.
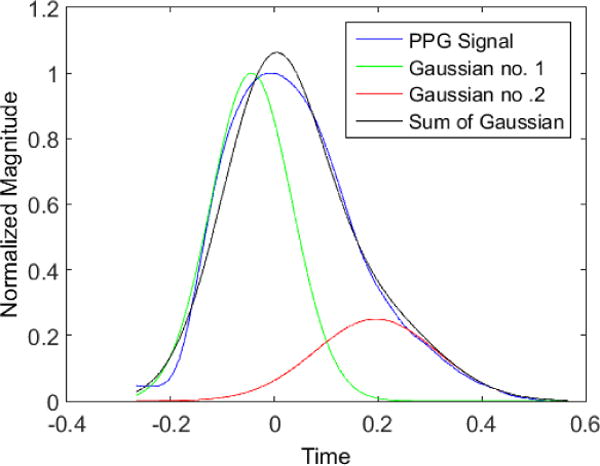
PPG signal is modeled by adding two different Gaussian functions
B. Photoplethysmographic Model Analysis
Our aim in this section is to find all the meaningful features in the PPG signal and mark them on the model introduced in the Section II.A, see Fig. 5. The original PPG signal can be utilized to derive the HRV signal by detecting the peak-to-peak (or P-P intervals) values of the signals. However, it is possible to further simplify the interpretation and understanding of the original PPG signal by taking its first derivative [9] and second derivative [10]. The second derivative of the PPG signal is called the Acceleration Plethysmogram (APG). The APG is indicative of blood acceleration in the finger. The proposed new representation model of the PPG signal discussed above was further analyzed to provide the first and second derivatives of the original PPG signal as can be seen in Figs. 5b and 5c. The APG waveform that is extracted from the proposed model is comprised of two systolic waves and one diastolic wave [10]. These waves are named as follows: the a-wave (known as the early systolic positive wave), the b-wave (known as the early systolic negative wave) and the c-wave (known as the early diastolic positive wave). The c-wave represents the dicrotic notch of the original PPG signal. The dicrotic notch is associated with the closure of the aortic valve and subsequent retrograde blood flow [11]. The clinical usefulness of the second derivative waves of the original PPG signal is further explained in [12]. The b/a and c/a ratios are associated to various health-related factors. An increase of c/a is associated with decreased arterial stiffness and this ratio decreases with age [12], [13]. In [9], it was shown that the b/a ratio is associated with increased arterial stiffness: thus, the ratio of b over a increases with age.
Fig. 5.
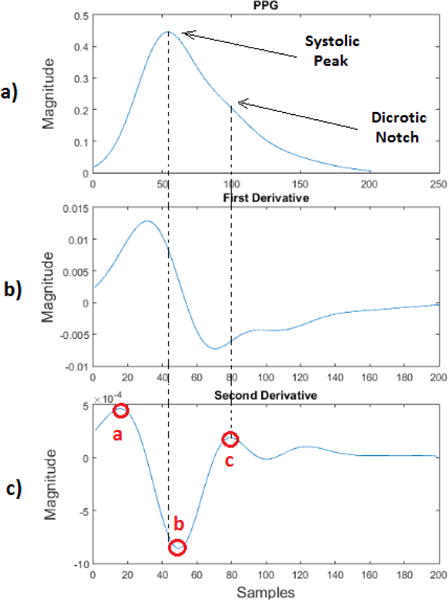
a) Proposed PPG signal model, b) First derivative wave of the proposed PPG signal model, c) Second derivative wave of the proposed PPG signal model.
III. Experimental Results
The PPG data were recorded from a male subject’s wrist using our proposed reflectance mode PPG infrared sensor. The PPG sensor was embedded in a wristband and was comfortably worn by the subject. The data were sampled at 1 KHz and collected from the participant during sedentary and physical activities. During data collection, the subject was initially inactive for 5 minutes and was standing upright without performing any movements. The subject was subsequently asked to walk normally for nearly 5 minutes. Each time, the data were recorded in a SD card.
Next, the raw data saved on SD card was prepared for transmission. The collected data file was uploaded from the SD card into a Matlab program in order to be further processed and analyzed. A peak detection algorithm was required to detect the P-P values of the PPG data and create an additional file containing all the PPG signal peaks. The following steps were taken so as to detect the P-P values of the PPG signals. The first stage was pre-filtering. We fitted a polynomial of degree 6 to the signal and then subtracted the fitted constant values from the signal to remove the DC level. Then a band-pass filter was used to filter out the Additive White Gaussian Noise (AWGN) above 100 Hz. At this stage, the signal was ready. Then we used a matched filter to maximize the signal to noise ratio (SNR). The matched filter was created by the help of a single signal peak. A PPG signal peak was used as a template to match the other peaks. Then the parameters of the two Gaussian waveforms were chosen carefully to resemble the received signal. After convolving the matched filter with the received signal, we used our peak-to-peak detection technique. Fig. 6 shows the result of the peak detection algorithm, which compared each point to its neighbor and found the local maxima in that neighborhood. Since it is physiologically impossible for the heart to produce two beats closer than 200 milliseconds apart, we have eliminated the peaks that are closer than the physiological limit. We compared the result of our peak detection algorithm to the peaks on ECG signal. The ECG signal collected from different sedentary subjects simultaneously with PPG response for 8 minutes was used for comparison. The number of peaks shown in ECG signal was calculated and compared against the number of peaks detected by our algorithm. In all comparisons the peak detection algorithm showed better than 98% accuracy.
Fig. 6.
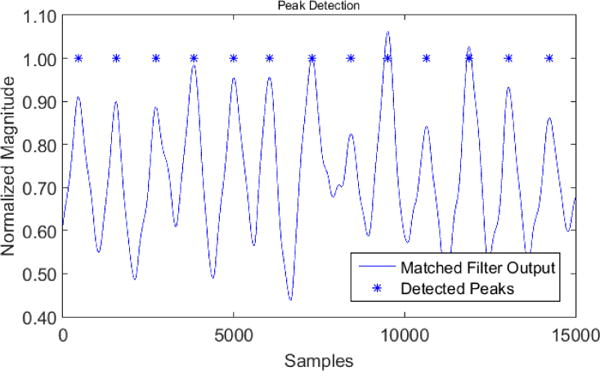
The result of the peak detection algorithm
After peak detection, we could calculate the P-P values by finding the time duration between two peaks. These values were recorded along with the time tags saved to a file to be analyzed by Kubios software.
IV. Heart Rate Variability Analysis
We initially used the sedentary data samples for HRV analysis as shown in Fig. 7. The P-P values of the sedentary data samples were previously calculated using the proposed peak detection algorithm in section IV.B. Generally, HRV signal analysis is performed in both frequency and time domains. Time-domain analysis can help to extract statistical parameters such as mean heart rate. Frequency-domain analysis on the other hand resolves the HRV signal based on particular frequency ranges related to physiological processes. In the frequency-domain analysis, spectral features such as Very Low Frequency (VLF), Low Frequency (LF) and High Frequency (HF) components are computed. The LF component is indicative of sympathetic dominance of the Autonomic Nervous System (ANS), while the HF power spectrum components reflect the parasympathetic dominance. The LF/HF is also an indication of the (sympathovagal) balance, which is indicative of the antagonistic control between the parasympathetic and sympathetic branches of the ANS. A detailed analysis report was generated by the Kubios software and is shown in Fig. 8. This report summarizes the previously mentioned HRV parameters, which were extracted from the PPG data obtained from the participant during sedentary activity.
Fig. 7.

Collected data samples on resting pose of the participant
Fig. 8.
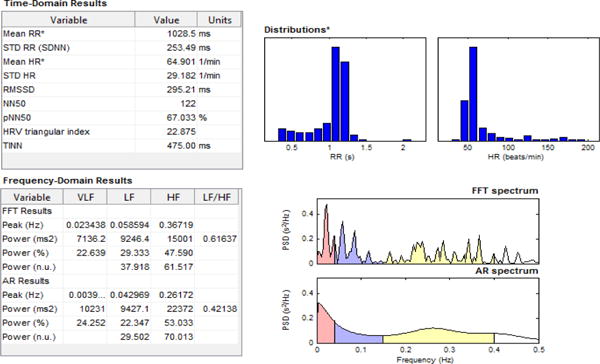
Report of HRV analysis for sedentary data samples by Kubios.
As a pilot investigation, we acquired some PPG data samples during physical activity (walking) as shown in Fig. 9. We then attempted to perform peak detection and HRV signal analysis. Our investigation showed that serious motion artifacts caused by the participant’s hand movement would render our peak detection algorithm ineffective. Development of algorithms for PPG signals during exercise is an important area of future research in our lab. We are currently investigating the use of other sensors in sensor array and single sensor configurations to compare the result.
Fig. 9.

Collected data samples during physical activity of the participant
We conjecture the fusion methods which compensate the HRV signal response during physical activities with the help of gyroscope or accelerometer would be helpful.
V. Conclusion
A wristband-type wireless PPG device was custom-designed and developed to collect the arterial pulse signal. A novel PPG signal model based on the sum of Gaussian functions was also proposed to approximate the original PPG signal. The collected PPG data from participants during sedentary activity were analyzed to measure the HRV signal. However, due to the large motion artifacts of the hand movements, the data that were collected during physical activity were extremely difficult to analyze. Thus, HRV signal analysis was not performed for the data collected during physical activity.
Acknowledgments
This work was supported by the National Institute of Heath Diversity Program Consortium through BUILD award numbers 8UL1GM118970-02 and 8RL5GM118969-02. The experimental procedures involving human subjects described in this paper were approved by the Institutional Review Board.
Contributor Information
M. Ghamari, Department of Electrical and Computer Engineering, University of Texas at El Paso, El Paso, Texas, USA
C. Soltanpur, Department of Electrical and Computer Engineering, University of Oklahoma, Norman, Oklahoma, USA
S. Cabrera, Department of Electrical and Computer Engineering, University of Texas at El Paso, El Paso, Texas, USA
R. Romero, Department of Electrical and Computer Engineering, University of Texas at El Paso, El Paso, Texas, USA
R. Martinek, Department of Cybernetics and Biomedical Engineering, VSB-Technical University of Ostrava, Czech Republic
H. Nazeran, Department of Electrical and Computer Engineering, University of Texas at El Paso, El Paso, Texas, USA
References
- 1.Marek M. Heart rate variability. Annals of Noninvasive Electrocardiology. 1996;1(2):151–181. [Google Scholar]
- 2.Reyes I, Nazeran H, Franco M, Haltiwanger E. Wireless photoplethysmographic device for heart rate variability signal acquisition and analysis. in the IEEE 34th Engineering in Medicine and Biology Society Conference; San Diego, California, USA. August, 2012; [DOI] [PubMed] [Google Scholar]
- 3.Dekker JM, Hannan PJ, Schouten EG. Low heart rate variability in a 2-minute rhythm strip predicts risk of coronary heart disease and mortality from several causes The ARIC Study. Circulation. 2000;102(11):1239–1244. doi: 10.1161/01.cir.102.11.1239. [DOI] [PubMed] [Google Scholar]
- 4.Tamura T, Maeda Y, Sekine M, Yoshida M. Wearable photoplethysmographic sensors—past and present. Electronics. 2014;3(2):282–302. [Google Scholar]
- 5.Allen J. Photoplethysmography and its application in clinical physiological measurement. Physiological measurement. 2007;28(3):R1. doi: 10.1088/0967-3334/28/3/R01. [DOI] [PubMed] [Google Scholar]
- 6.Li D, Zhao H, Li S, Zheng H. Wireless Algorithms, Systems, and Applications. Springer International Publishing; 2014. A New Representation of Photoplethysmography Signal; pp. 279–289. [Google Scholar]
- 7.Tokutaka H, Maniwa Y, Gonda E, Yamamoto M, Kakihara T, Kurata M, Fujimura K, Shigang L, Ohkita M. Construction of a general physical condition judgment system using acceleration plethysmogram pulse-wave analysis. Advances in Self-Organizing Maps Springer Berlin Heidelberg. 2009:307–315. [Google Scholar]
- 8.Goshtasby A, Schonfeld D. Signal representation based on a Gaussian decomposition. Proc 1991 Conf Inform Sei Syst. 1991 [Google Scholar]
- 9.Takazawa K, Tanaka N, Fujita M, Matsuoka O, Saiki T, Aikawa M, Tamura S, Ibukiyama C. Assessment of vasoactive agents and vascular aging by the second derivative of photoplethysmogram waveform. Hypertension. 1998;32(2):365–370. doi: 10.1161/01.hyp.32.2.365. [DOI] [PubMed] [Google Scholar]
- 10.Elgendi M. On the analysis of fingertip photoplethysmogram signals. Current cardiology reviews. 2012;8(1):14–25. doi: 10.2174/157340312801215782. [DOI] [PMC free article] [PubMed] [Google Scholar]
- 11.Blazek R, Lee C. Multi-resolution linear model comparison for detection of dicrotic notch and peak in blood volume pulse signals. Analysis of Biomedical Signals and Images. 2010;20:378–386. [Google Scholar]
- 12.Takazawa K, Kiyoshi Y, Sakai T, Kobayashi T, Maeda K, Yamashita Y, Hase M, Ibukiyama C. Clinical usefulness of the second derivative of a plethysmogram (acceleration plethysmogram) J Cardiol. 1993;23(suppl 37):207–217. [Google Scholar]
- 13.Baek HJ, Kim JS, Lee HB, Park KS. Second derivative of photoplethysmography for estimating vascular aging. Information Technology Applications in Biomedicine, 2007. ITAB 2007. 2007 6th International Special Topic Conference on. IEEE. [Google Scholar]


