

Summary
The immunological synapse (IS) is the junction between an immune cell (e.g. a T or NK cell) and another cell (e.g. an antigen-presenting cell (APC), or a tumor cell). The formation of the IS is crucial for cell-mediated immunity, and as such, an understanding of both the composition of the IS and the factors that drive its formation are essential for understanding how and when NK cells eliminate susceptible target cells. The supported lipid bilayer (SLB) system is a highly effective tool for directly studying the IS. SLBs confer three main advantages: 1) they allow for synapse formation on a level horizontal surface, allowing for direct visualization of the IS under high resolution imaging systems, 2) they mimic the surface of a target cell by providing a fluid mosaic into which surface proteins can be embedded while permitting free motion in two dimensions, which is important for studying the dynamics of synapse formation, and 3) they allow investigators to determine the exact composition of the bilayer, thus in turn allowing them to answer very specific questions about the IS. It is our hope that this chapter will furnish readers with an awareness of the applications of the SLB system for studying the IS in NK cells, and also of a basic knowledge of how to use this system for themselves.
Keywords: Natural killer, NK, immune synapse, immunological synapse, immunosynapse, IS, supported lipid bilayer, SLB, confocal microscopy
1. Introduction
NK cells act as important conductors of cell-mediated immunity. Their ability to kill diseased or malignant cells without prior sensitization makes them a vital part of the immune response. However, similar to cytotoxic T lymphocytes (CTLs), NK cells must form stable contacts with their targets and in order to ‘read’ them and decide whether to kill or to spare. The contact zone between an effector cell and its target is a transient structure composed of different clusters of surface receptors or proteins, which, altogether, is called the immunological synapse (IS). The IS was first imaged directly by confocal microscopy in combination with glass-supported planar lipid bilayers (SLBs) (1). SLBs are phospholipid bilayers supported on flat transparent surfaces (typically a thin glass coverslip), and into which can be embedded any desired proteins, including those necessary for synapse formation. The result is a flat surface that mimics the surface of a target cell, and which thus allows direct visualization of the IS formed on the SLB by immune cells (2) (Fig 1).
Figure 1.
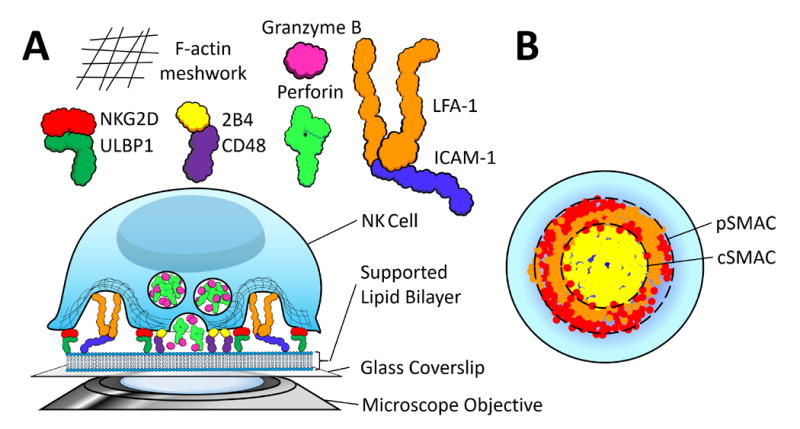
Cartoon illustrating a model of the NK cell synapse formed on the supported lipid bilayer (SLB). Ligands for various NK cell surface proteins are anchored in the SLB, which itself rests on a flat rigid glass surface. NK cells are added atop this bilayer, which they recognize much as they would the surface of a target cell, and an immunological synapses (IS) forms between the surface proteins on the NK cell and the ligands embedded in the SLB. The planar orientation of the bilayer allows for easy and direct imaging of the resulting IS. A] The particular synapse shown here is a model interpreted from the findings of Liu et al (10) and Zheng et al (13). On a lipid bilayer containing 1) ULBP1 (green), 2) CD48 (green), and 3) ICAM-1 (blue), these proteins will be bound by 1) NKG2D (red), 2) 2B4 (yellow), and 3) LFA-1 (orange), respectively, causing a re-organization of the F-actin cytoskeleton and polarization of perforin-positive lytic granules to the synapse. These lytic granules will then be extruded from the cell through regions of F-actin hypodensities, like salt granules through the pores in a shaker. B] The ‘head-on’ view of the IS provided by the SLB system allows for the visualization of the IS’ characteristic ‘bull’s-eye’ structure, which in this case consists of centralized aggregated 2B4 surrounded by an outer ring of LFA-1 and NKG2D. These regions are known as the cSMAC and pSMAC, respectively.
The use of SLBs has proved highly valuable in the study of NK cell synapses. In 2009, Liu et al used the SLB system to study synapse structure as well as the trafficking of cytolytic granules within the intercellular space formed by the IS (3). The authors observed both well-organized natural cytotoxicity synapses mediated by NKG2D, 2B4, and LFA-1 and disorganized antibody-dependent cellular cytotoxicity (ADCC) synapses mediated by CD16 and LFA-1. These findings were, within the same study, validated by a cell-cell conjugation system in vitro, illustrating their translatability from the SLB to actual inter-cellular events. Additionally, Liu et al discovered a hallmark for the cytotoxic IS, bidirectional vesicular traffic at the center of the NK synapse (3). Thus, SLBs have been successfully used to study NK activation.
SLBs can be used in studying NK cell inhibition as well as activation. In 2012, Liu et al used the same SLB system containing human leukocyte antigen (HLA)-E, a ligand for the inhibitory receptor CD94/NKG2A, to discover a novel role of the adaptor protein Crk in controlling NK cell inhibition (4). Abeyweera et al also used this system to visualize NK cell inhibitory synapses and the roles played by immunotyrosine inhibition motif (ITIM) bearing receptors in their formation (5, 6).
Recent advances in fluorescent microscopy (such as the advent of commercially available super-resolution optical microscopes) have further increased the utility of the SLB system. Using stimulated emission depletion (STED) microscopy in combination with the SLB system, Zheng et al demonstrated that perforin-containing granules accumulate at regions of low-density F-actin at the IS when CD16 activating receptors are ligated by bilayer-embedded antibodies against CD16 (7), a finding that corroborates earlier observations made by Rak et al and Brown et al using antibodies fixed on a glass slide (8, 9).
The aim of this chapter is: 1) to familiarize readers to SLB technology, and 2) to provide a detailed instructional protocol on how to carry out this technique. The use of SLBs provides an unparalleled look into the IS, and the fact that investigators can alter the composition of the SLB at will allows for a straightforward reductionist approach towards testing the effect of individual receptors on synapse formation. It is therefore our hope that this chapter will broaden both awareness of and expertise in this technology, which will in turn lead to further advancements in our understanding of the NK cell immunological synapse.
2. Materials
2.1. Lipid Preparation
18:1 (Δ9-Cis) PC (DOPC): 1,2-dioleoyl-sn-glycero-3-phosphocholine (10mg/ml in Chloroform) (Avanti)
18:1 Biotinyl Cap PE: 1,2-dioleoyl-sn-glycero-3-phosphoethanolamine-N-(cap biotinyl) (sodium salt) (10mg/ml in Chloroform) (Avanti)
Compressed Argon gas,
A lyophilizer
Lyophilizer tubes (Labconco)
Chromatography tubes (Santa Cruz)
Octyl-β-D-glucopyranoside (Sigma-Aldrich)
Sonicator (Avanti)
Cleaning Solution: 1 L of 95% ethanol, 120 mL pure H2O, and 60 g potassium hydroxide, KOH.
Dialysis tubing 6.4 mm diameter with a molecular weight cut-off of 12–14 kDa. (Spectrum® Labs)
Dialysis tube closures
Dilution buffer: Prepare 25 mL solution of 25 mM Tris, pH 8.0 (from 1 M stock solution) and 150 mM NaCl (from 5 M stock solution), deoxygenate the solution with argon gas and then add 2% (by weight) n-octyl-β-D-glucopyranoside (OG) detergent. After preparation, filter the solution with a 0.2 micron cellulose acetate membrane and store it at 4°C (see Note 1)
Dialysis buffer: Same as item 2.1.12, but without OG detergent. 25 mM Tris, pH 8.0, 150 mM NaCl (8 liters, aliquoted into 8 1L screw cap bottles). Deoxygenate the buffer with argon gas and store at 4°C (see Note 1)
Compressed Argon gas
Screw cap microcentrifuge tubes (water tight)
2.3. Determination of protein seeding density on the lipid bilayer
Fluorescently-labeled biotinylated protein
96-well V-bottom polystyrene plate (untreated)
Non-functionalized silica beads (Bangs Laboratories)
FACS tubes
Quantum™ MESF beads (Bangs Laboratories)
1.5 mL microcentrifuge tubes
DOPC (400 μM diluted in dilution buffer; see Section 3.1)
Diluted Biotin-PE lipid (80 μM diluted in 4 mM DOPC and dilution buffer; see Section 3.1)
Vortex
Blocking buffer: 5% Casein in PBS, pH 7.3. Dissolve 18 g of casein 250 mL of ultrapure water in a beaker while stirring at RT. While stirring, add 1.26 mL 10N NaOH in 100 μL aliquots. Allow to stir for 2–3 hrs at RT and then place at 4°C overnight at a slow stir.
Wash buffer: HEPES buffered saline (HBS), 1% human serum albumin (HSA).
Streptavidin: 333ng/ml in wash buffer.
2.4. Assembling the Supported Lipid Bilayer
Piranha solution: 3 parts sulfuric acid (H2SO4), 1 part of 30% hydrogen peroxide (H2O2).
25×75 mm glass coverslip
DOPC (400 μM solution in dilution buffer; see Section 3.1)
Diluted Biotin-PE: (80 μM diluted in 4 mM DOPC and dilution buffer; see Section 3.1)
Hemostat
6 lane chamber slide: ibidi Sticky-Slide VI 0.4 (ibidi)
Blocking buffer (see 2.3.10)
Wash buffer: HEPES buffered saline (HBS), 1% human serum albumin (HSA).
Streptavidin
D-Biotin (25mM) (Add company name / no need for catalog number or vendor information)
Type F Immersion Oil
A Leica TCS STED microscope
3. Methods
There are three major processes that go into working with SLBs. The first involves the preparation of the raw lipids, and this can be further sub-divided into the initial prep stage and the subsequent dialysis of the dried lipids. The next phase focuses on determining how densely the bilayers are ‘seeded’ with protein of a given molarity. The final phase deals with the actual assembly of the SLB within the imaging chamber and subsequent addition of the surface proteins and the cells to it. This methods section will detail how our lab in particular works with the SLB system, but the entire process is very amenable to customization. An effort has been made to indicate in the notes some of the places in our protocol where significant flexibility in materials or design is possible.
3.1 Lipid Preparation
Prior to beginning the lipid preparation, submerge glass chromatography tubes to be used in the following steps, into cleaning solution for 20 minutes. Then rinse the tubes three times with distilled water.
Beginning with 10 mg/mL initial stock concentrations of 1,2-dioleoyl-sn-glycero-3-phosphocholine (DOPC) and 1,2-dioleoyl-sn-glycero- 3-phospho-ethanolamine-N-cap biotinyl (Biotin-PE), aliquot 629 μL of DOPC and 88 μL Biotin-PE into separate clean glass chromatography tubes (see Note 2).
Evaporate the chloroform with a stream of argon in a chemical fume hood and seal each chromatography tube with paraffin film (see Note 3).
Lyophilize the liposomes overnight to ensure complete removal of any remaining chloroform (see Note 4).
After lyophilization, dissolve the dried DOPC and Biotin-PE lipids in 2 mL and 200 μL of dilution buffer (see Section 2.1.10), respectively, to make a 4 mM solution of each.
Mix the biotin-PE lipids with the DOPC lipids (see Note 5). Add 0.2 ml of 4 mM Biotin-PE and 1 ml of 4 mM DOPC to 8.8 ml of the dilution buffer to make a final concentration of 80 μM Biotin-PE.
Next, dilute 1 mL of remaining 4 mM DOPC to 400 μM by adding 9 mL dilution buffer.
Ensure homogeneity of the lipid solutions by sonicating until the solution clears, which typically takes about 10 minutes.
Finally, displace any oxygen in the top of the tube with argon and seal with paraffin film.
Now, dialyze the phospholipids to remove the OG detergent. To begin, clean and sterilize the tubing by soaking the newly cut sections in 200 mL of distilled water for 2 minutes at RT, followed by 5 minutes at a boil.
Knot one end of each tube and rinse out the inside with a small volume of dilution buffer. Then squeeze out as much of the wash buffer as possible.
Inside a laminar flow hood, add the diluted phospholipids prepared in 3.1 into each tube – pure DOPC in one and the DOPC/Biotin-PE mixture in the other – and clamp the open ends with a small dialysis tube closure so that we exclude all air (see Note 6).
Submerge the tubes inside the 1L bottles containing dialysis buffer (2.11) and add a magnetic stirring bar into each.
Deoxygenate each bottle with argon, re-cap tightly, and place each of them on a magnetic stir plate set to spin at medium speed overnight at 4°C.
Replace the old buffer from each bottle with new buffer every 12 hrs, 3 times for each bottle.
Label and deoxygenate 20 small screw-cap, water-tight microcentrifuge tubes to aliquot the dialyzed lipids.
Finally, after 36 hrs of continuous dialysis, take both bottles back into a laminar flow hood and remove the dialysis tubes (see Note 7).
Cut the dialysis tubing below the clip, and then carefully divide the dialyzed lipid solution into 1 mL aliquots using the pre-prepared tubes, which should be kept on ice during this process.
When at last all the aqueous lipid solution has been aliquoted, deoxygenate each tube with argon, seal with paraffin film, and store them at 4°C.
3.2 Determination of protein seeding density on the lipid bilayer
Prior to preparing the lipid bilayer for any experiment, one will need to establish how densely protein of a given molarity will seed the bilayer. This is an important consideration, as differing balances of surface proteins on the bilayer can lead to significantly different experimental outcomes (10), and experimental questions that seek to gauge the effect of one protein on another must take this into account. The process for determining the bilayer seeding density of an aqueous protein suspension is important. The basic principle involves coating silica beads with lipids, which are then coated with fluorescently labeled protein. The labeled beads are then read on a flow cytometer and compared to a standard series of beads pre-labeled with the same fluorophore at known MESF (Molecules of Equivalent Fluorochrome - the standard unit of fluorescent intensity) values (see Fig 2).
Figure 2.
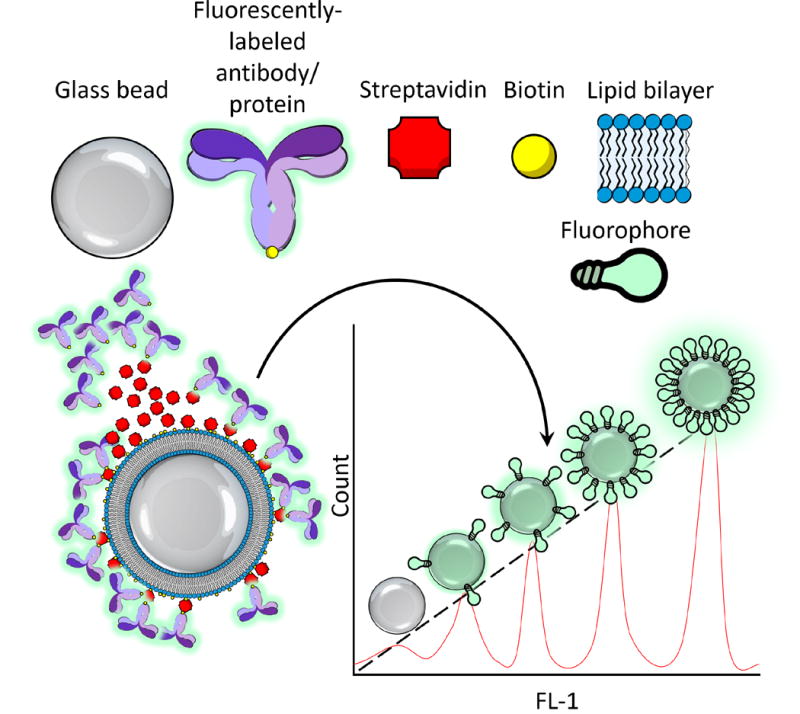
Overview of the principle behind determining the seeding density of a given protein on the SLB. Silica beads of known diameter are coated with the biotinylated phospholipids, followed by streptavidin, and then with biotinylated, fluorescently-labeled protein of various concentrations. These coated beads are then assayed by flow cytometry, and their fluorescent values are plotted against a standard curve established from a series of beads labeled with known numbers of the same fluorophore. From this, the number of molecules of equivalent soluble fluorochromes (MESF) can be correlated with the protein concentration, and dividing by the number of fluorophores per unit protein, the average density of protein coating each bead can be derived. From there, one simply needs to compute the surface area of the bead from its diameter to determine the seeding density of protein per square micrometer of the bilayer as a function of concentration.
Start by creating a graded series of protein dilutions. A typical range begins with 100 μM and is serially diluted 10-fold 5 times, with a total volume of 50 μL for each dilution. The protein(s) must be both fluorescently labeled and possess an anchoring mechanism, such as biotinylation (see Note 2).
In a 96-well, V-bottom plate, add 1 μL of silica beads at a concentration of 0.5–1.0×10⁶ beads/μL (diluted in PBS) into 6 wells, one for each protein dilutions, plus one for blank (negative control).
Next mix together pure DOPC lipids (400 μM;) with diluted biotin-PE lipids (80 μM), at a 1:1 ratio, for a total volume of 2×n+2, where n is our number of wells in a 1.5 mL microcentrifuge tube.
Add 2 μL of the lipid mixture into the wells containing the beads and the blank well.
Then, gently pulse the plate on a vortex in order to mix and promote interaction of the lipids with the silica beads (see Note 8).
Add 150 μL of blocking buffer (see Note 9). Block for 10 minutes, then wash.
To wash, fill each well to capacity (250 μL) with wash buffer, centrifuge at 1000 × g for 2 min, carefully remove the top 200 μL, and repeat twice more for a total of three times.
Add 50 μL of streptavidin at a concentration of 333 ng/mL. Gently pulse the plate on a vortex and then let it sit on a rotary shaker at RT for 15 min in order to let the streptavidin interact with biotin. Wash off the excess, using the same procedure as in step 6.
At this point, add protein and allow it to incubate with the streptavidin on the rotary shaker for 20–30 minutes at RT in the dark. Then wash off the excess, unbound protein with wash buffer as in step 6.
After the final wash, add 50 μL of wash buffer (for a total volume of 100 μL) and transfer the contents from each well to a separate FACS tube. Bring the volume up to 500 μL with wash buffer.
Next add one drop of beads from each bottle of an MESF series into a single tube and bring the volume up to 300 μL with wash buffer.
Run the MESF tube on the cytometer and adjust the voltage of the excitation laser so that each peak in the series is visible in a histogram measuring the intensity of each fluorophore. There should be as many distinct peaks as there were bottles in the series.
Then draw a linear gate spanning the width of each peak at its half-maximal intensity, and assign the mean fluorescent intensity (MFI) for each of these gates to that series of beads (see Fig 3).
Record the data from the MESF series, then read each tube of the protein dilution series. Once this is done, establish an intensity-to-molecule ratio for the fluorophore from the MESF series, and then intrapolate the measured intensity of the protein-labeled beads into the number of fluorophores (see Table 1).
Since this gives only the number of fluorophores, to determine the number of protein monomers, divide the values obtained from step 14 by the average number of fluorophores on each monomer (which can be determined using a spectrophotometer). This will tell what concentration of protein to add to achieve a given density of protein on the lipid bilayer (see Note 10).
Figure 3.
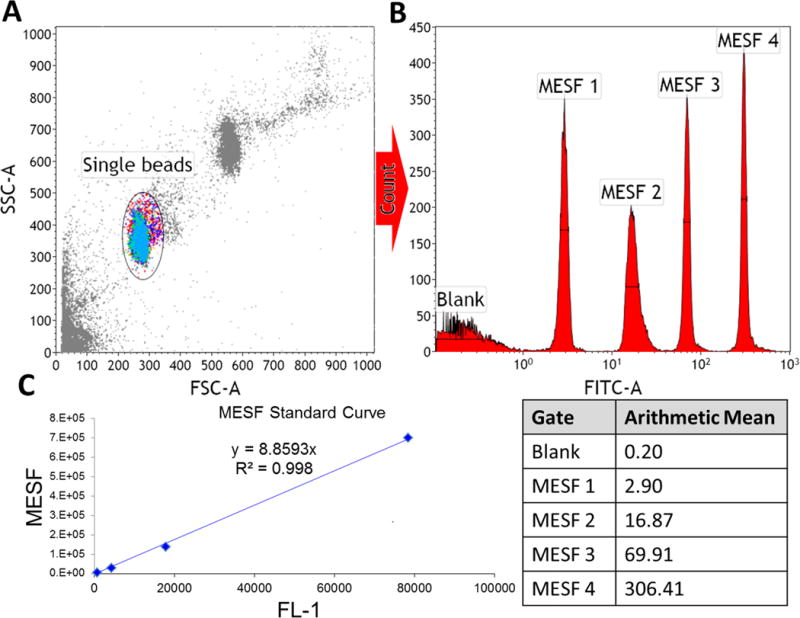
How to calculate the MESF standard curve. A] Run a tube containing equal parts of each tube in the standard MESF series on a flow cytometer, then gate on the single beads in an SSC vs FSC dot plot. B] Plot the singlet population on a unidimensional histogram with the fluorescent channel on the X-axis, and draw a gate spanning the width of each peak at its half-maximal intensity. Record the arithmetic mean for each gate. C] Subtract the arithmetic mean for each peak from the blank value, then plot these against the MESF values (which can be found from the manufacturer). From this, a linear relationship between MESF and fluorescence can be obtained, which can then be used to calculate the MESF of your protein-labeled lipid-coated beads.
Table 1.
Example worksheet for computing the seeding density of a given fluorescently-labeled protein (adapted from the one provided by Bangs Laboratories with the purchase of any of their MESF kits). A linear relationship between fluorescent intensity (FL-1) and number of fluorophores is established from the standard MESF series as described in Fig 3. This yields a standard linear equation of the form y=m*x, where y is the number of fluorophores and x is the measured FL-1. By inputting the measured FL-1 values of the protein-labeled lipid-coated beads into the equation, one can determine the MESF values. These values can then be divided by the labeling efficiency of the protein (moles of fluorophore per moles of protein) to obtain the number of fluorescently-labeled protein monomers per bead. Dividing this number by the surface area of the bead, which can be calculated from its diameter, yields the density of the labeled protein per unit area as a function of its initial molar concentration.
| Quantum MESF Standard Beads
| |||||
|---|---|---|---|---|---|
| Fluorophore: | AF488 | Tube Number | FL-1 | FL-1 minus blank | MESF value |
|
| |||||
| Lot: | B | 48.6 | 0 | 0 | |
| 1 | 741 | 692.4 | 3843 | ||
| 2 | 4320 | 4271.4 | 27657 | ||
| 3 | 17937 | 17888.4 | 136386 | ||
| MESF:FL-1 ratio: | 8.88 | 4 | 78422 | 78373.4 | 699951 |
| Fluorescently-Labeled
Protein-Conjugated Lipid-Coated Beads | ||||||
|---|---|---|---|---|---|---|
| Protein: | OKT3 | Concentration (nM) | FL-1 | FL-1 minus blank | Calculated MESF | Seeding Density (units/μm2) |
|
| ||||||
| Labeling Efficiency: |
0.5 |
0 | 8.34 | 0 | 0 | 0 |
| Mean bead diameter: |
5.06 |
20 | 40.4 | 32.06 | 568 | 7.06 |
| Bead surface area: |
80.44 |
100 | 54.5 | 46.16 | 818 | 10.17 |
| 200 | 275 | 266.66 | 4725 | 58.74 | ||
| 1000 | 578 | 569.66 | 10094 | 125.49 | ||
3.3 Assembling the Supported Lipid Bilayer
This section is similar to 3.3. The primary difference is that this section describes assembling the lipid bilayer on a flat glass surface and incorporates an extra step to eliminate any potential non-specific binding before adding cells. A graphical overview of the entire process can be seen in Fig 4.
Figure 4.
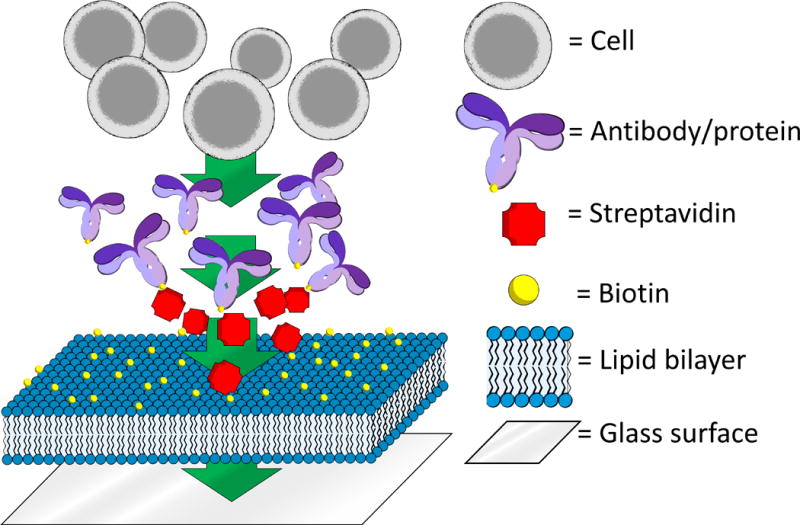
Overview of the process of constructing the SLB. The first step of the process is to add biotinylated lipids to a pre-treated glass surface. Then, streptavidin is added to provide a substrate for biotinylated proteins (here generically represented by an antibody). These proteins are strongly anchored onto the bilayer by the biotin-streptavidin interaction, but remain laterally mobile. Finally, cells are added to the bilayer, where they form protein-dependent contacts and, subsequently, immune synapses.
Clean a standard 25×75 mm glass coverslip by submerging into freshly prepared Piranha solution (see Note 11) for 20 minutes (see Note 12).
While the coverslip is being cleaned, mix the DOPC stock with the diluted biotin-PE at a 1:1 ratio as in the section 3.3. The volume needed varies depending on how many experimental conditions are to be tested. Use 3 μL per condition (see Note 13).
After the coverslip is cleaned, use a plastic hemostat to remove the coverslip from the solution and wash off the Piranha solution with copious distilled water. Then stand the coverslip – still clamped by the hemostat – on one end and allow it to air dry (see Note 14, also Fig 5).
Using a 6-lane flow chamber slide, turn the slide bottom-up and place two 1.5 μL drops of mixed lipids within each lane for each experimental variable to be tested (see Note 15).
Quickly place the coverslip smoothly and firmly over the bottom of chamber (see Note 16, also Fig 6). Follow up by pressing down around and in between each lane using a hemostat (or some other tool with a fine blunt tip) in order ensure a firm seal between the adhesive and the coverslip.
Then, inject 100 μL of 5% casein into each lane that will be used.
Follow with 100 μL of streptavidin, and allow to incubate at RT for 10 minutes.
Wash out the streptavidin by flowing 1 mL of wash buffer through the chamber 3 times (see Note 17, also Fig 7).
Then add protein, suspended in 100 μL of wash buffer, and allow to incubate between 20–30 minutes at RT in the dark. The exact concentration of the protein will depend on the final desired density of the protein on the bilayer, as well as if any other proteins are to be added simultaneously.
Wash as in step 8.
At this point, block any unfilled streptavidin binding sites by adding 100 μL of D-biotin suspended in wash buffer at a 25 nM concentration to each lane. We let this sit for 10 minutes at RT in the dark, and finish by washing as in step 8.
Figure 5.
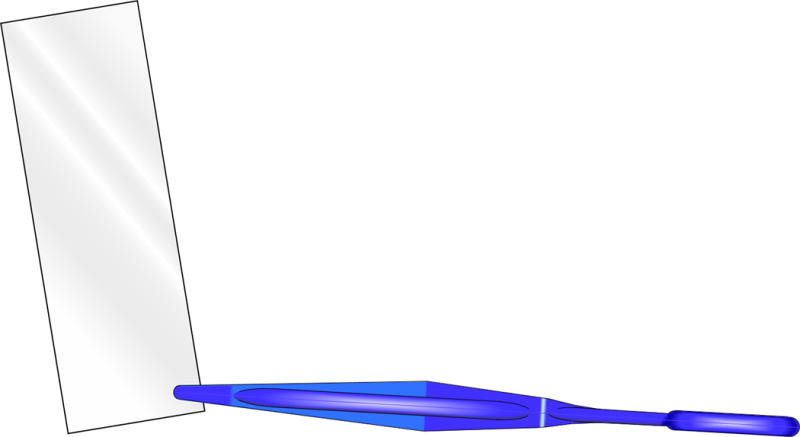
Illustration of how to position a coverslip vertically in order to air-dry, following cleaning with Piranha solution and subsequent rinsing with distilled water.
Figure 6.
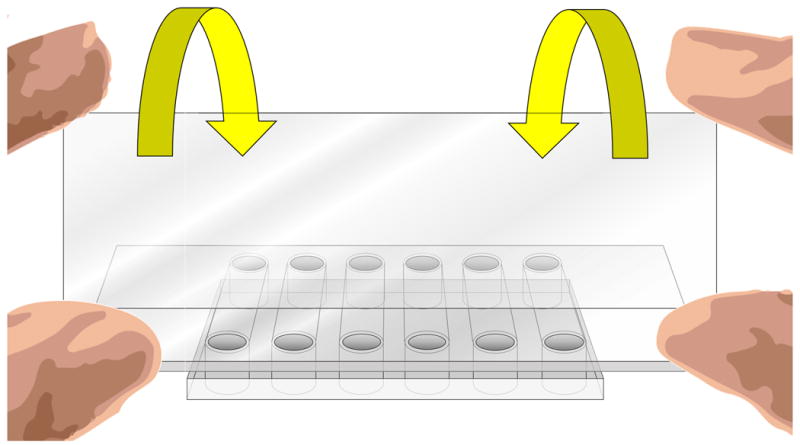
Illustration of how to place the coverslip over the bottom of the flow chamber. With ungloved hands, grasp the edges of the coverslip between your thumb and index finger as pictured. Line up the near edge of the coverslip with the near edge of the chamber, them gently and evenly lay down the coverslip away from yourself until it lies flat against the chamber.
Figure 7.
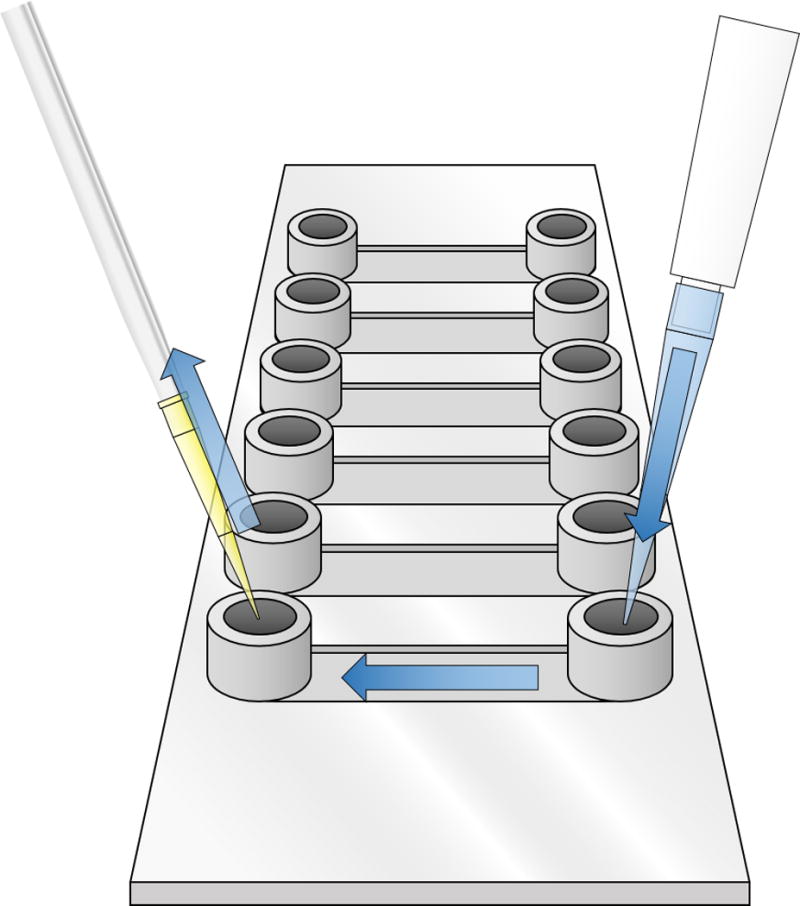
Illustration of how to wash one chamber of the flow cell. A 1 mL pipette is placed at one end, and wash buffer is slowly passed through as suction is applied to the other end.
At this point, the chambers are ready for the cells to be added. Depending on the experiment, this may or may not include an incubation period at 37 °C. The initial steps of synapse formation happen very rapidly (within 10 minutes). However, synapse formation can and will continue to develop over a period of hours. How long the cells are allowed to incubate on the bilayer before imaging them will depend on what stage of synapse formation is desired to be studied.
The chamber slide can be imaged just like a normal microscope slide using confocal or TIRF (total internal reflection fluorescence) microscopy.
Acknowledgments
This work was supported in part by 1R21HL125018-01A1, 1R21AI124769-01, 1R21AI129594-01, 1R56AI130197-01, P50CA126752, the Houston Methodist Career Cornerstone Award, and the Baylor-UT Houston Center for AIDS Research Core Support Grant (number AI36211) from the National Institute of Allergy and Infectious Diseases.
Footnotes
To save time, the dilution and dialysis buffers can be prepared and stored in advance while the lipids lyophilize.
SLBs can be made in a variety of compositions, and can use a variety of different mechanisms in order to anchor surface proteins. These include glycophosphatidylinositol (GPI) anchors, polyhistidine tags, and biotin-streptavidin conjugation. Our lab currently employs the biotin-streptavidin system for its versatility and for the strength of the biotin-streptavidin interactions.
During this step, and all subsequent steps of the procedure in which one must expose the lipids to the air, the samples should be handled, deoxygenated, and re-sealed quickly to minimize oxygenation of the lipids, which will degrade them.
If speed is desired, 60–90 minutes’ lyophilization should suffice.
We recommend diluting the Biotin-PE lipids with the DOPC because the biotinylated phosphate head groups of the biotin-PE lipids have more steric hindrance than the normal DOPC lipids. Thus, proteins embedded in a bilayer composed of pure biotin-PE lipids may display impaired lateral mobility.
Complete air exclusion requires the sacrifice of a small volume of the sample by clamping just below the ‘waterline’.
When removing the dialysis tubes from the bottle, it’s important to do this in a sterile environment such as a biosafety cabinet. As the tubes will be dripping wet, though, you may want to put down some paper towels or a bench diaper beforehand.
We strongly emphasize ‘gently’ when vortexing the plate. Too strong a vortex will send the beads violently flying out of the wells, requiring you to start over.
We block with casein in order to saturate any non-specific binding sites (such as those created by static charge or hydrophobic/hydrophilic forces) on the coated beads with an inert, invisible protein, so that when we add our labeled, biotinylated protein, only the specific streptavidin sites will be available.
This process will need to be repeated for each fluorophore one intends to use, as the intensity of one fluorophore is not equivalent to another.
Sulfuric acid and Piranha solution are both extremely corrosive, and should always be handled with proper PPE in the confines of a chemical fume hood. Always add the hydrogen peroxide to the sulfuric acid slowly - never vice versa.
Treating glass coverslips with Piranha solution has two purposes: the first is to thoroughly clean the coverslip of any organic residues; the second is to hydroxylate the surface of the glass, making it highly hydrophilic (and thus an attractive substrate for the hydrophilic phosphate head groups of our lipids).
Be sure to deoxygenate your stock tubes with argon after opening them. Also, keep them on ice when transporting to and from the refrigerator.
This process can be expedited by using a compressed air canister to ‘blow-dry’ the coverslip.
The drops need not be this exact volume or number. Each drop forms a lipid ‘island’ within the lane. We have found that this volume is good for forming a single drop of sufficient size to capture a large number of cells, but small enough that it does not merge with either side of the lane, which will disrupt the bilayer. The two drops are meant to further increase our ‘capture’ area, but in practice, we often observe that 90% of the cells that do form synapses do so on the first ‘island’ anyway.
A trick we often use in this step is to remove our gloves, which can otherwise get caught between the coverslip and the chamber, and place the coverslip down with our bare fingers. Be sure when doing this, however, that you only grasp the edge of the coverslip. We find it also helps to line up the near edge first and gently lay down the coverslip away from yourself.
In order to flow a large volume of fluid through the chamber, grab a pipette and inject the wash buffer in one end while holding a vacuum line tipped with a narrow pipette tip at the other, as illustrated. Hold the vacuum tip right at the surface of the exit port, and allow the fresh intake of buffer from the other side to raise the volume until it comes in reach of your vacuum.
References
- 1.Grakoui A, Bromley SK, Sumen C, et al. The immunological synapse: a molecular machine controlling T cell activation. Science. 1999;285(5425):221–7. doi: 10.1126/science.285.5425.221. [DOI] [PubMed] [Google Scholar]
- 2.McConnell HM, Watts TH, Weis RM, et al. Supported planar membranes in studies of cell-cell recognition in the immune system. Biochim Biophys Acta. 1986;864(1):95–106. doi: 10.1016/0304-4157(86)90016-x. [DOI] [PubMed] [Google Scholar]
- 3.Liu D, Bryceson YT, Meckel T, et al. Integrin-dependent organization and bidirectional vesicular traffic at cytotoxic immune synapses. Immunity. 2009;31(1):99–109. doi: 10.1016/j.immuni.2009.05.009. [DOI] [PMC free article] [PubMed] [Google Scholar]
- 4.Liu D, Peterson ME, Long EO. The adaptor protein Crk controls activation and inhibition of natural killer cells. Immunity. 2012;36(4):600–11. doi: 10.1016/j.immuni.2012.03.007. [DOI] [PMC free article] [PubMed] [Google Scholar]
- 5.Abeyweera TP, Merino E, Huse M. Inhibitory signaling blocks activating receptor clustering and induces cytoskeletal retraction in natural killer cells. J Cell Biol. 2011;192(4):675–90. doi: 10.1083/jcb.201009135. [DOI] [PMC free article] [PubMed] [Google Scholar]
- 6.Abeyweera TP, Kaissar M, Huse M. Inhibitory receptor signaling destabilizes immunological synapse formation in primary NK cells. Front Immunol. 2013;4:410. doi: 10.3389/fimmu.2013.00410. [DOI] [PMC free article] [PubMed] [Google Scholar]
- 7.Zheng P, Bertolet G, Chen Y, et al. Super-resolution imaging of the natural killer cell immunological synapse on a glass-supported planar lipid bilayer. JoVE. 2015;96 doi: 10.3791/52502. [DOI] [PMC free article] [PubMed] [Google Scholar]
- 8.Rak GD, Mace EM, Banerjee PP, et al. Natural killer cell lytic granule secretion occurs through a pervasive actin network at the immune synapse. PLoS Biol. 2011;9(9) doi: 10.1371/journal.pbio.1001151. [DOI] [PMC free article] [PubMed] [Google Scholar]
- 9.Brown AC, Oddos S, Dobbie IM, et al. Remodelling of cortical actin where lytic granules dock at natural killer cell immune synapses revealed by super-resolution microscopy. PLoS Biol. 2011;9(9) doi: 10.1371/journal.pbio.1001152. [DOI] [PMC free article] [PubMed] [Google Scholar]
- 10.Yokosuka T, Takamatsu M, Kobayashi-Imanishi W, et al. Programmed cell death 1 forms negative costimulatory microclusters that directly inhibit T cell receptor signaling by recruiting phosphatase SHP2. J Exp Med. 2012;209(6):1201–17. doi: 10.1084/jem.20112741. [DOI] [PMC free article] [PubMed] [Google Scholar]