Abstract
The sclera uses unknown mechanisms to match the eye’s axial length to its optics during development, producing eyes with good focus (emmetropia). A myopic eye is too long for its own optics. We propose a multi-scale computational model to simulate eye development based on the assumption that scleral growth is controlled by genetic factors while scleral remodeling is driven by genetic factors and the eye’s refractive error. We define growth as a mechanism that changes the tissue volume and mass while remodeling involves internal micro-deformations that are volume-preserving at the macroscale. The model was fitted against longitudinal refractive measurements in tree shrews of different ages and exposed to three different visual conditions: (i) normal development; (ii) negative lens wear to induce myopia; and (iii) recovery from myopia by removing the negative lens. The model was able to replicate the age- and vision-dependent response of the tree shrew experiments. Scleral growth ceased at younger age than scleral remodeling. The remodeling rate decreased as the eye emmetropized but increased at any age when a negative lens was put on. The predictive power of the model was investigated by calculating the susceptibility to scleral remodeling and the response to form deprivation myopia in tree shrews. Both predictions were in good agreement with experimental data that were not used to fit the model. We propose the first model that distinguishes scleral growth from remodeling. The good agreement of our results with experimental data supports the notion that scleral growth and scleral remodeling are two independently controlled mechanisms during eye development.
Keywords: Myopia, Growth, Remodeling, Emmetropization, Multi-Scale Modeling, Finite Element Method
1 Introduction
Myopia, also known as nearsightedness, has become an epidemic ocular condition [1] that affects nearly 40% of the US adult population [2] and increased from 10% to 90% in some Asian populations [3; 4]. A myopic eye is characterized by an elongated scleral shell as compared to a normal eye [5]. Due to this axial elongation, the focal plane is in front of the retina causing the blurry vision in a myopic eye. Myopia typically develops during childhood when the eye and its tissues are still growing. Myopia is associated with a higher risk of blinding diseases such as glaucoma, retinal detachment and macular degeneration [6–9]. The purpose of this paper is to gain insight into the mechanisms underlying scleral growth and remodeling (G&R) during normal eye development and myopia development.
For many years, myopia has been the focus of extensive investigations and a substantial effort is being devoted to decipher the underlying mechanisms. During eye development, the sclera is thought to simultaneously grow and remodel. Experimental evidence from animal models increasingly points towards the existence of an active emmetropization mechanism that adapts scleral remodeling to match the eye’s axial length to its focal length during eye development, thus, producing eyes with retinal focus [10–13].
Tissue growth involves an increase in tissue mass, which can occur through cell division (hyperplasia), cell enlargement (hypertrophy), and synthesis of extracellular matrix (ECM). Remodeling involves changes in material properties. These material property changes, which often are adaptive, may be due to micro-deformations within the tissue. Most soft tissues such as the sclera are regarded as incompressible or nearly incompressible within the physiological range of deformation due to their high water content. Consequently, micro-deformations that may underly scleral remodeling are thought to lead to volume-conserving deformations at the macro-scale due to the nearly incompressible property of the sclera. Within this paper, we define scleral remodeling as a mechanism that involves the rearrangement of existing material due to micro-deformations that are volume-conserving at the macro-scale, while scleral growth is a mechanism that changes the amount (volume) of scleral tissue.
The scleral ECM exhibits a complex hierarchical structure, which varies across species. We use data obtained from animal experiments in tree shrews. The tree shrew is a well established animal model for myopia and its sclera exhibits a similar hierarchical structure compared to humans [14–18]. The tree shrew as well as the human sclera is mainly composed of type I collagen fibrils at the micro-scale, which form interwoven lamellae at the meso-scale. Inducing myopia in the tree shrew (by either using a negative power lens or a diffuser) has been shown to impact the sclera by: (i) thinning [16]; (ii) reduction in dry weight (3–5%) [16; 19; 20]; (iii) lowering hyaluronan and sulfated glycosaminoglycan (GAG) levels [20]; (iv) increasing enzymatic degradation [21–24]; (iv) decreasing collagen type I synthesis [25]; and (v) increasing scleral creep rate [26; 27]. The aforementioned findings suggest that axial elongation in myopia is not due to accelerated tissue growth as the dry weight and collagen synthesis are reduced. Instead, myopia is likely due to a remodeling mechanism that involves micro-deformations within the scleral ECM, which alter scleral biomechanics (creep rate). McBrien et al. [28] have suggested that myopia underlies biomechanical scleral weakening, which leads to a creep-like elongation of the sclera at normal intraocular pressure (IOP). Summers Rada et al. [10] suggested that the reduction in aggrecan could make it easier for scleral lamellae to slide across each other during myopia development. In a recent inverse computational study, we have predicted that the collagen fibril crimp increases during myopia development and hypothesized that this may be due to intra- and/or inter-lamellar remodeling deformations [29]. Zhu et al. [30] reported that the eyes of tree-shrews and other species can axially shorten when exposed to a myopic defocus (using a positive power lens or by removing a negative power lens after myopia was induced), which suggests that scleral remodeling may be reversible.
Bryant and McDonnell [31] proposed the first computational model to simulate axial elongation in myopia. This has been the only study that attempted to computationally model myopia development. The model was fitted to a very limited set of experimental data available at that time. Bryant and McDonnell [31] used a growth tensor to model axial elongation based on the assumption that myopia is due to accelerated tissue growth, which is in disagreement with experimental data available now. As a part of our ongoing efforts to elucidate G&R mechanisms in myopia, we propose a new multi-scale computational model to investigate the hypothesis that scleral growth and scleral remodeling are two independently controlled mechanisms. We hypothesize that scleral G&R occur simultaneously and both mechanisms contribute to the axial elongation of the eye during development. We assume that scleral growth is solely determined by genetic factors. In contrast, scleral remodeling is assumed to be controlled by both, genetic factors and visual environment (i.e. vision-guided). Our computational multi-scale model is based on the following main assumptions: (i) the sclera deforms due to external loading and G&R; (ii) scleral G&R ceases with age; (iii) scleral remodeling is modulated by the eye’s refractive error; and (iv) scleral remodeling is (initially) reversible.
The model incorporates multiple length scales as the visual stimulus is calculated at the organ-level, which drives scleral remodeling at the lamella-level. Age-dependent scleral growth occurs simultaneously at the tissue-level and ceases with age. Both, scleral G&R lead to scleral elongation at the tissue-level and axial elongation at the organ-level impacting the visual stimulus and closing the vision-guided feedback loop.
This paper is organized as follows: In Section 2 we present our G&R formulation. In Section 3 we fit our model to new and previously published tree shrew data [32]. In Section 4 we investigate the predictive power of our new model by validating it against data that was not used to fit the model [24; 33]. Finally, we discuss the presented model and results in Section 5.
2 Computational Modeling of Scleral Growth & Remodeling
2.1 Evolution Equations
Our approach to model scleral G&R is based on the hypothesis that G&R are two independently controlled mechanisms that occur simultaneously at different rates and cease over time. We propose that the scleral remodeling is vision-guided and that the remodeling rate is up- or down-regulated to match the eye’s axial length with its focal length during emmetropization. Based on the finding that scleral dry weight is only slightly reduced (3–5%) [16; 19; 20] after lens induced myopia, we assume that tissue growth is not significantly altered by any visual stimulus.
We define scleral growth as a genetically determined mechanism that increases scleral tissue volume and mass without changing the tissue density. The growth rate is defined at the tissue-level by introducing the following (strictly convex) evolution equation for the so-called growth stretch λg
| (1) |
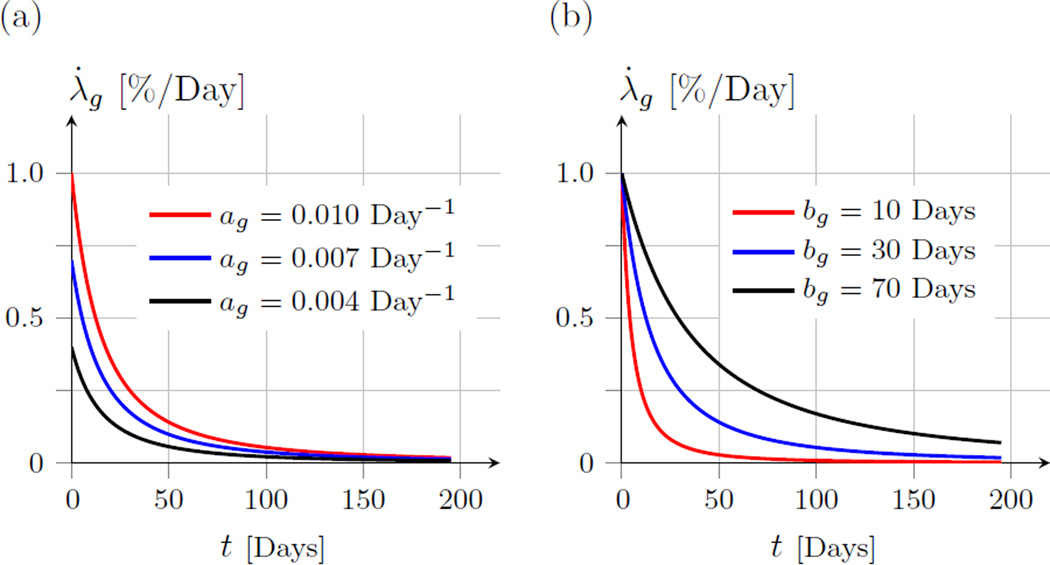
in which, t is time in days, ag and bg are parameters to be determined by fitting experimental data. We define t = 0 as the day at which the animal opens their eyes for the first time. Consequently, t represents time measured in days of visual experience (DVE). The growth stretch λg represents the in-plane elongation of the sclera over time due to tissue growth. ag is a parameter that is related to the growth rate at t = 0 with the unit Days−1. bg has the same dimension as t and determines how quickly the growth ceases with t. Figure 1 shows the growth stretch rate for different values of ag and bg.
Fig. 1.
The growth stretch rate λ̇g as defined in (1). Illustrative plots are shown for different values of ag and bg. (a) Shows the effect of varying the parameter ag while bg = 30 Days. (b) Shows the effect of varying the parameter bg while ag = 0.01 Day−1. The parameter ag represents the growth rate at t = 0, while bg determines the shape of the growth rate function in (1).
We define scleral remodeling as a mechanism that involves internal tissue deformations and restructuring of the ECM at the collagen fibril and/or scleral lamella-level. Similar to our previous work, we model scleral remodeling as a residual stretch between scleral lamellae and the ground substance of the sclera [34]. To mathematically describe the remodeling rate, we propose an independent evolution equation of the remodeling stretch λr by the following multiplicative form
| (2) |
where is the maximum remodeling rate, represents the vision-guided stimulus computed at the organ-level, and δα ∈ [0; 1] represents a factor that accounts for heterogeneous remodeling across the scleral shell. The sclera is assumed to continuously remodel while the eye grows to compensate for environmental changes in refractive error. Based on the refractive state of the eye, scleral remodeling can be upregulated up to its maximum remodeling rate . Consequently, represents the upper bound of the remodeling rate and is defined as
| (3) |
The parameter represents the maximum remodeling rate at t = 0. determines the shape of . Similar to the growth rate (1), the maximum remodeling rate is assumed to be genetically determined and to decrease with age. These assumptions are based on the observation that the relative axial elongation rate (treated eye minus control eye) decreases with age in lens treated tree shrews [32].
Scleral remodeling is assumed to be vision-guided, where in (2) represents one potential cue that the eye uses to alter scleral remodeling: the refractive error of the eye. It is unclear what visual cues the retina detects but it is likely that the retina is sensitive to multiple visual stimuli. Note that other visual cues can be incorporated into our model such as the degree of form deprivation, contrast, wave length of light, and light intensity. Additional cues are likely additive terms that would contribute to , i.e. an animal that wears a negative lens that is also a diffuser would result in a higher remodeling stimulus than one of the single cues alone. Based on the findings by Zhu et al. [30] we assume that scleral remodeling can lead to scleral elongation (positive remodeling) and shortening (negative remodeling). In this paper, we use the generalized Richards’ functions to define the visual stimulus as a function of the eye’s refractive error E
| (4) |
The visual stimulus function is monotonically increasing with E. The impact of the model parameters on the vision stimulus function is illustrated in Figure 2.
Fig. 2.
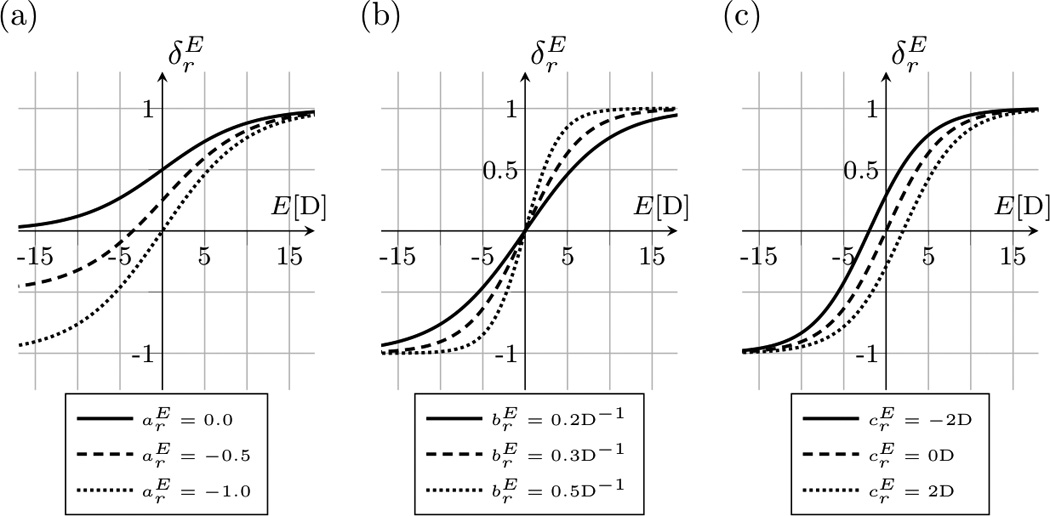
The visual stimulus function as defined in (4). The function increases with the current refractive error E of the eye. (a) Shows the effect of varying the parameter while and . (b) Shows the effect of varying the model parameter while and . (c) Shows the effect of varying the model parameters while and . The parameter represents the lower asymptote. represents the slope of the curve at the inflection point, while shifts the inflection point along the E-axis.
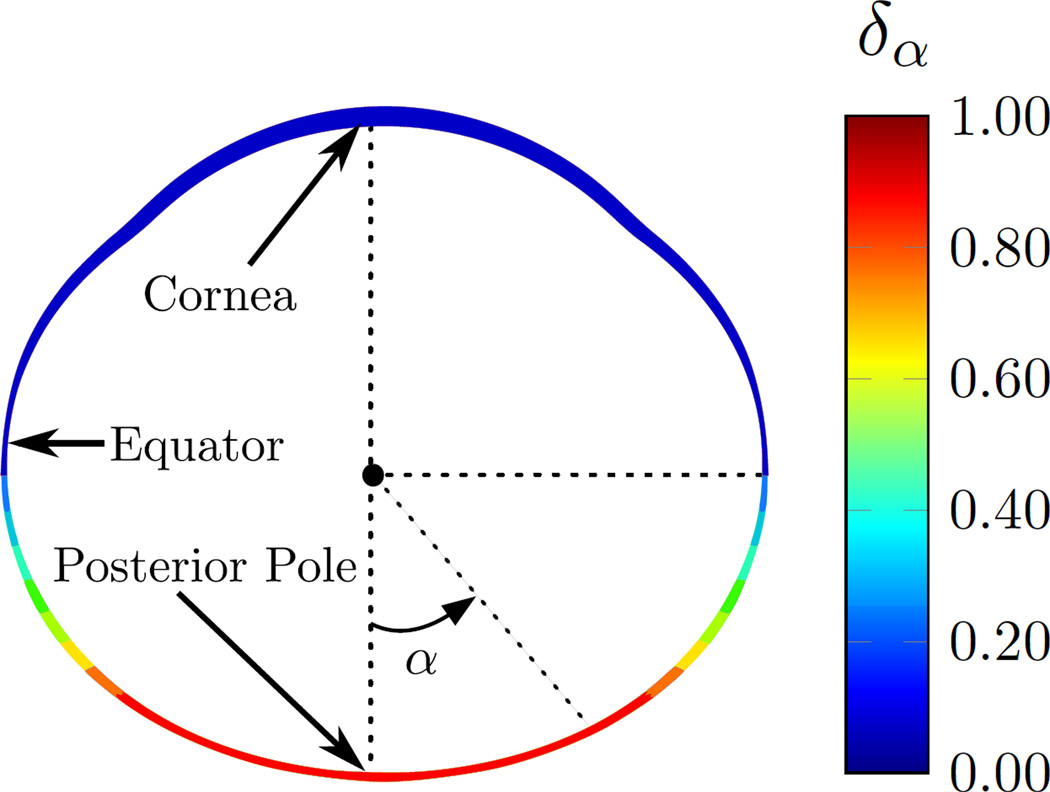
Guggenheim and McBrien [35] reported that MMP-2 upregulation was higher at the posterior sclera as compared to equatorial samples in 5 day form deprived tree shrews. Experiments in chicks and tree shrews have shown that if partial diffusers or negative lenses cover only half of the retina, only that half of the eye elongates [36–38]. These findings suggest that scleral remodeling is locally controlled and heterogeneous across the scleral shell. We use the term δα in (2) to account for heterogeneous remodeling across the scleral shell. We assume that scleral remodeling is highest at the posterior pole and reduces towards the anterior sclera. The heterogeneity factor δα is defined by the following distribution, which is illustrated in Figure 3.
| (5) |
Fig. 3.
The heterogeneity factor δα as defined in (5) is used to model the heterogeneous remodeling rate across the scleral shell. The heterogeneity factor is δα = 1 at the posterior sclera for |α| < π/4 and it gradually decreases to δα = 0 towards the anterior sclera for .
The presented G&R model consists of seven unknown parameters: two parameters that define the age-related growth rate λ̇g (ag, bg); two parameters that define the age-related maximum remodeling rate ; and three parameters that define the vision-guided remodeling stimulus . The temporal discretization of the evolution equations (1) and (2) were realized by an explicit update of the growth stretch λg and the remodeling stretch λr.
2.2 Constitutive equations
The sclera can deform due to external loads (elastic deformations) and tissue G&R (inelastic deformations). Tissue growth is assumed to change the tissue volume without changing the tissue density. Similar to the work by Bryant and McDonnell [31], we adopt the concept of finite volumetric growth [39] and multiplicatively split the deformation gradient F into an elastic part Fe and a growth part Fg
| (6) |
We assume that the eye tissues grow isotropically
| (7) |
where I is the second order identity tensor and the evolution of the growth stretch λg is defined in (1).
The scleral is mostly composed of fibrillar collagen type I, which aggregate into scleral lamellae that are embedded into a soft matrix (ground substance). The ground substance represents all noncollagenous tissue constituents such as elastin, GAGs, proteoglycans, and cells, and is assumed to be isotropic and nearly incompressible. We assume that the total strain energy of the sclera W can be decomposed into the energy contributions of the scleral lamellae Wcol and ground substance Wmat
| (8) |
The strain energy contribution of the ground substance is approximated by an isochoric Neo-Hookean formulation
| (9) |
which is a function of the elastic right Cauchy-Green tensor Ce and the elastic Jacobian Je
| (10) |
Two material parameters are used to define Wmat: the shear modulus μ and bulk modulus κ.
To account for the hierarchical collagenous structure of the sclera, the strain energy contribution of the scleral lamellae is approximated by a distribution of scleral lamellae that are composed of crimped collagen fibrils [40–42]. At the micro-scale, collagen fibrils crimp and buckle when the eye is unloaded. At the meso-scale, collagen fibrils form scleral lamellae that are strongly interwoven. We use a normalized von Mises distribution function ρ(ϕ) [42; 43] to define the in-plane distribution of scleral lamellae as a function of an Eulerian angle ϕ ∈ [−π/2;π/2]
| (11) |
where b is the concentration parameter and I0 the modified Bessel function of the first kind and order zero. The three-dimensional orientations of scleral lamellae are defined by the unit vector e0
| (12) |
A1 and A2 are part of an orthonormal basis Ai, where A1 points in the circumferential and A2 in the meridional direction of our eye model. Note that for b = 0 scleral lamellae are planar isotropic distributed tangential to the scleral shell. We define the strain energy density function of the scleral lamellae as
| (13) |
Scleral lamellae are composed of crimped collagen fibrils. Consequently, the strain energy in each scleral lamella orientation e0(ϕ) is represented by our 1-dimensional model for crimped collagen fibrils Wfib [40] as a function of the lamella stretch λlamella.
To account for scleral remodeling, we define the lamella stretch λlamella in (13) to be the elastic tissue-level stretch λe reduced by the remodeling stretch λr [34].
| (14) |
While the elastic tissue-level stretch λe may differ for different orientations e0(ϕ), the remodeling stretch λr is assumed to be identical for all orientations. The evolution of the remodeling stretch λr is defined in (2).
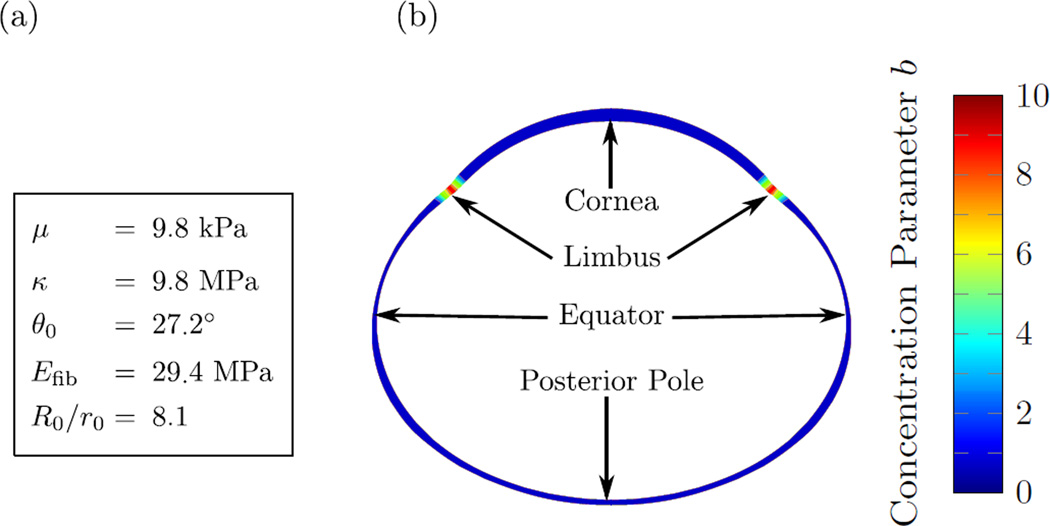
The multi-scale constitutive model consists of six parameters: the shear modulus μ and the bulk modulus κ of the ground substance (tissue-level); the concentration parameter b of scleral lamella orientations (lamella-level); and the collagen fibril crimp angle θ0, the elastic modulus of collagen fibrils Efib, and the ratio R0/r0 between the collagen fibril crimp amplitude and fibril radius (fibril-level). The latter three parameters define the strain energy density of crimped collagen fibrils Wfib in (13). We refer to Grytz and Meschke [40] for a detailed derivation of Wfib. We assume that the eye tissues are nearly incompressible by setting the bulk modulus to κ = 1000μ. We assume that lamellae are planar isotropic distributed (b = 0) in the sclera and cornea, and highly aligned in the circumferential direction at the limbus (b = 10). The remaining material parameters were obtained from our previous inverse fitting of uniaxial tensile test of tree shrew scleral strips [29]. We used the fitted parameters of the youngest normal tree shrew group (24 DVE) from our previous study [29]. The material parameters including the distribution of the concentration factor b across the eye are summarized in Figure 4. We used the material parameters of the sclera to also model the elastic response of the cornea as no other data was available. Note that the choice of the corneal material parameters plays a minor role in our G&R simulations presented in the following two sections as IOP remained constant in all our simulations. In addition, the corneal parameters play a minor role here as myopia development was simulated by modulating scleral remodeling, which is consistent with experimental observations.
Fig. 4.
The elastic model parameters used in this study. (a) The tissue and fibril level parameters that were assumed to be constant throughout the sclera and cornea. (b) Distribution of the lamella-level concentration parameter b showing high lamellar alignment in circumferential direction at the limbus while the remaining parts of the sclera and cornea were assumed to have a planar isotropic distribution of lamellae tangential to the corneo-scleral shell.
3 Inverse Parameter Identification
3.1 Subjects
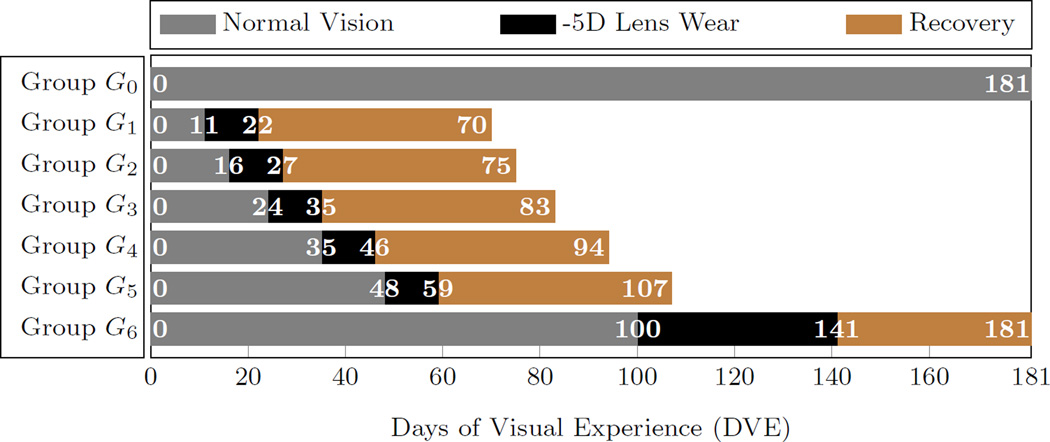
Our G&R model was fitted to previously published data from Norton et al. [32] consisting of 6 groups of tree shrews G1−6 that were treated with a -5D lens on one eye at different ages (n = 5 per group) and one new group of normal animals (no treatment) G0 (n = 7). One group of Norton et al. [32] was disregarded here as it didn’t enrich the cost function used to fit our model. The lens wear started at 11, 16, 24, 35, 48, and 100 DVE in G1−6, respectively. Lens treatment was performed for 11 days in G1−5 and for 41 days in the oldest group G6. The treated eye developed myopia during lens treatment while the refractive development of the control eye remained normal in G1−6. Afterwards, the lens was removed and the animals were allowed to recover from the lens-induced myopia. Only the data of the treated eye of G1−6 were used in this study. The time-dependent visual experience of all groups is summarized in Figure 5. Refractive measurements were made throughout the lens treatment and recovery periods of groups G1−6 using a Nidek ARK-700A infrared autorefractor (Marco Ophthalmic, Jacksonville, FL). In addition to refractive measurements, the axial dimensions were obtained for the new normal group G0 using a Lenstar LS-900 optical biometer (Haag-Streit USA, Mason, OH). Details about the experimental procedures can be found in Norton et al. [32]. The LenStar biometer is known to be calibrated for human eyes [44].
Fig. 5.
The visual experience of the animal groups used to fit the G&R model. G0 represents the normal group without lens treatment. Groups G1–6 represent tree shrews that were treated with a -5D on one eye at different ages. The experimental data of groups G1–6 are from Norton et al. [32]. All simulations started at 11 DVE.
Gann [45] compared the LenStar biometer with A-scan ultrasonography to measure ocular components in tree shrews showing that LenStar measures are typically smaller compared to A-scan measures of the same eye. Based on the regression reported by Gann [45], the axial length measurements of G0 were translated into A-scan equivalent values by means of the following equation
| (15) |
The averaged refractive data of each group was used to fit the G&R model. The earliest refractive measurements were performed at 11 DVE in G0 and G1, which marks the starting age of all our G&R simulations.
3.2 Reduced Optical Eye Model
Following the idea of Bryant and McDonnell [31], we use the reduced schematic eye model proposed by Norton and McBrien [46] to calculate the refractive error E in our G&R simulations
| (16) |
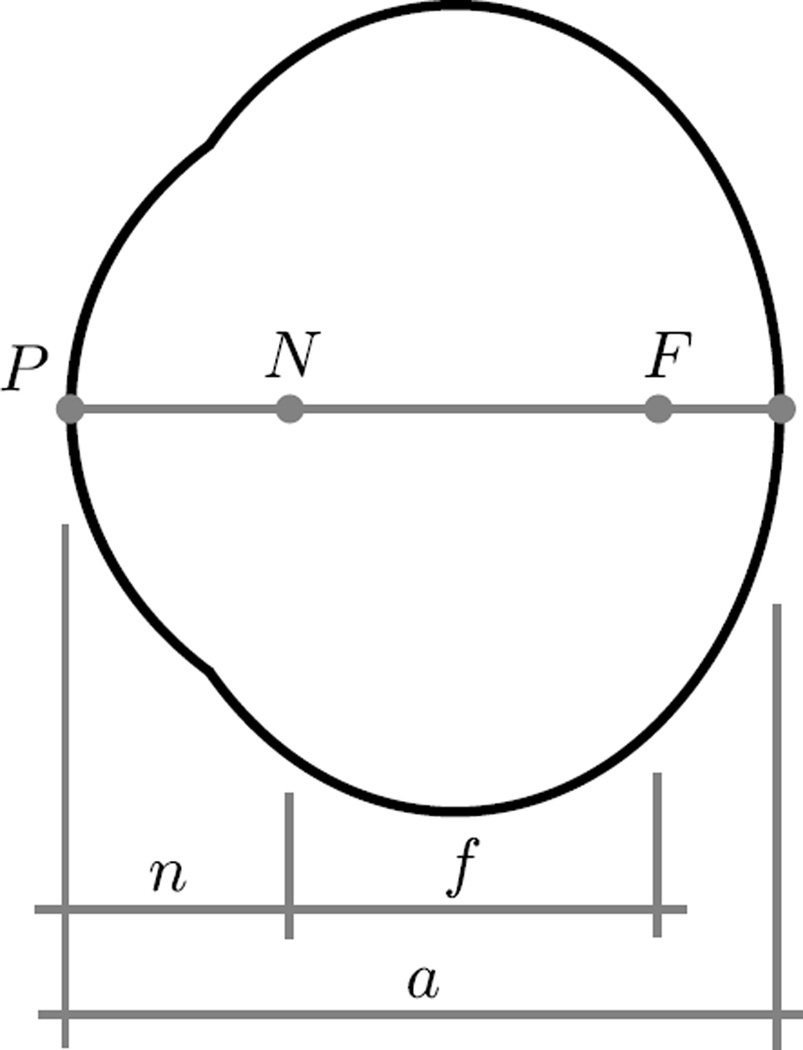
where the axial length a, the nodal length n, and the focal length f are illustrated in Figure 6. L represents the refractive power of a lens when put in front of the eye. L = 0 if no lens is used.
Fig. 6.
The reduced schematic eye model as proposed by Norton and McBrien [46]. The points P, N, and F represent the front of the cornea, posterior nodal point, and posterior focal point, respectively. The quantities n, f, and a represent the posterior nodal length, posterior focal length and axial length, respectively. An eye is emmetropic for a = f + n, myopic for a > f + n, and hyperopic for a < f + n.
To calculate the refractive error in our G&R simulations, two additional assumptions had to be made. First, we assume that the development of the cornea and lens is genetically defined and remains unaffected by the vision-guided mechanism that matches the eye’s axial length to the focal length. This assumption is backed up by experimental observation in humans [5] and tree shrews [47]. Based on this assumption, we can consider that the focal length f and nodal length n remain unaltered during lens wear and recovery in the animal experiments G1−6. Second, we assume that the ratio between the nodal and axial length τ = n/a remains constant over time and unaffected by the emmetropization process. Norton and McBrien [46] experimentally determined this ratio to be τ = 0.447 for tree shrews at 75 DVE. Based on these two assumptions, we can compute the unknown focal length f and nodal length n from the normal group G0, which includes experimental data of both, the refractive error E and the axial length a. If E and a are given, the nodal and focal length can be simply computed from (16) as
| (17) |
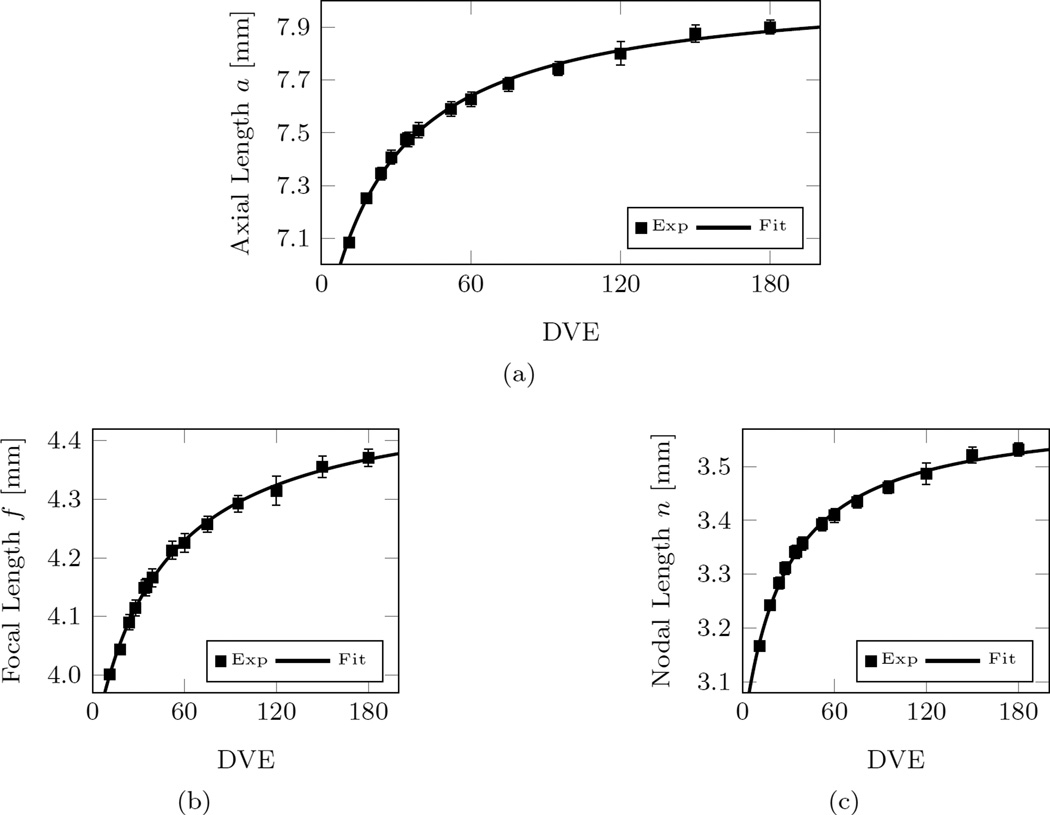
To calculate n and f at any age, curve fits were performed. The best-fit curves are shown in Figure 7 and can be written as
| (18) |
where t represents the time in Days. Our curve-fits differ from [31], who used an exponential fit. The exponential function used by Bryant and McDonnell did not produce good fits for our data, which is mainly caused by the continued axial elongation at older ages in our new normal group G0. Note that our normal group G0 includes measurements at much older ages (up to 180 DVE) compared to the data used by Bryant and McDonnell [31] (up to ~ 80 DVE).
Fig. 7.
Curve-fits and experimental data of the normal group G0 for (a) the axial length; (b) the focal length; and (c) the nodal length. Note that the experimental values of the focal length and the nodal length were computed from the experimentally measured axial length and refractive error by using (17). The reported values in (a) were translated into A-scan equivalent axial lengths using (15). Error bars represent the standard error of mean.
3.3 Finite Element Model of the Tree Shrew Eye
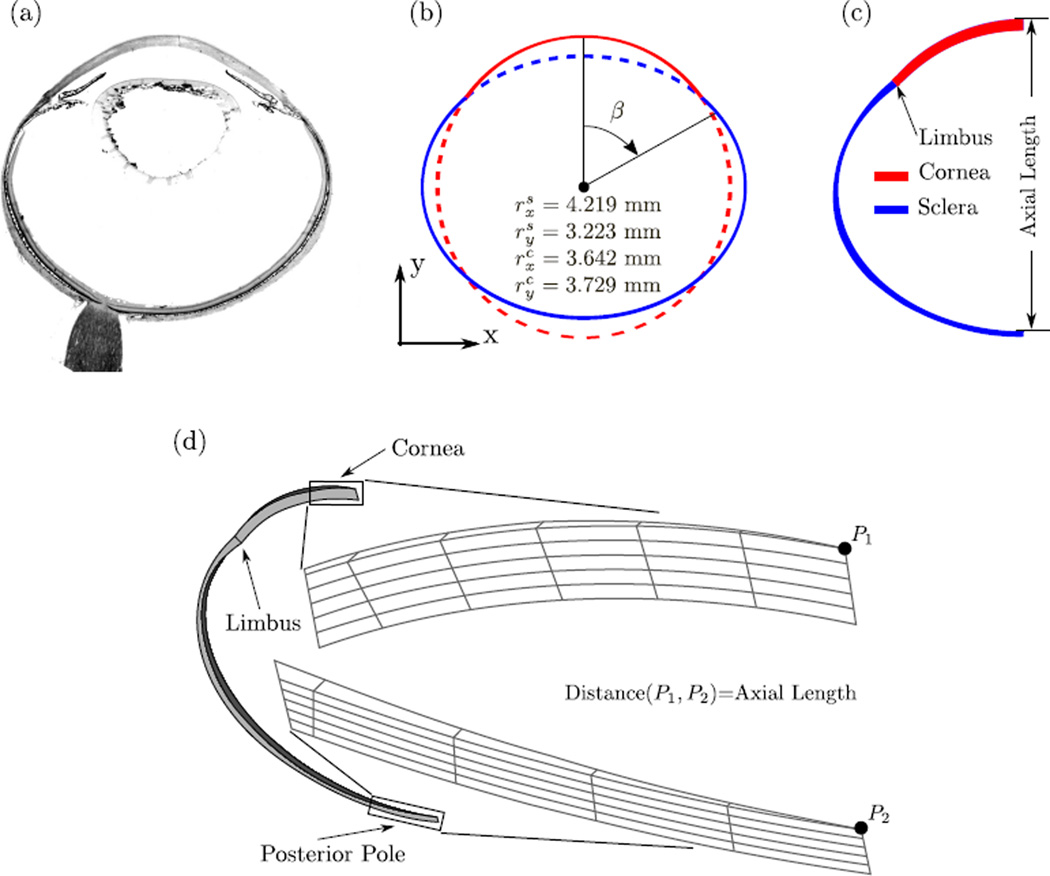
The geometry of the tree shrew eye is approximated by means of two concentric ellipses representing the corneo-scleral shells. We estimated the radii of the two ellipses (Figure 8b) by matching the ellipses to a histological section (Figure 8a) and the average axial length of our normal group G0 at 11 DVE (7.095 mm). To model the scleral thickness, we used the average thickness measurements of the youngest normal group (15 DVE) reported by Kang [48]. The measurement locations were translated into the angle β shown in Figure 8b. As we assume axis-symmetry, nasal and temporal thickness measurements at β and −β were averaged. Table 1 summarizes the symmetrized thickness measures used to create the FE mesh. We used the LenStar data of our normal group G0 to define central corneal thickness in our model (231 µm at 11 DVE). Corneal thickness was gradually reduced from the corneal apex to the first finite element of the sclera at the limbus. In contrast to human corneas, the tree shrew cornea thins towards the limbus, which is well appreciated in the histological section in Figure 8a.
Fig. 8.
(a) Histological section of a tree shrews eye. (b) The two concentric ellipses (dashed and solid lines) used to approximate the tree shrew eye geometry (solid lines). The radii in x and y direction of both ellipses are shown. (c) A 2D view showing the scleral thickness as indicated in Table 1. (d) The axisymmetric FE mesh of a tree shrew eye at 11 DVE with zoomed views of the mesh at the corneal apex and posterior pole. Axis-symmetry was enforced by using axisymmetric boundary conditions at the two surfaces in circumferential direction. A constant IOP of 15 mmHg was applied to the interocular surfaces of the mesh. Axial length was calculated as the distance between points P1 and P2.
Table 1.
The corneal and scleral thickness values with corresponding angles β used to generate the FE mesh. The one corneal thickness measure was obtained at the apex (β = 0) form our normal group G0 at 11 DVE. The original scleral thickness values were obtained from the 15 DVE normal group reported by Kang [48]. Nasal and temporal scleral thickness values were averaged.
| β [deg] Thickness [µm] |
0 | 77.77 | 84.16 | 90.55 | 96.94 | 103.33 | 109.72 | 116.11 | 122.50 |
| 231 | 90.08 | 59.20 | 52.99 | 66.90 | 81.95 | 101.57 | 140.73 | 151.15 | |
| β [deg] Thickness [µm] |
128.88 | 135.27 | 141.66 | 148.05 | 154.44 | 160.83 | 167.22 | 173.61 | 180 |
| 144.94 | 130.11 | 122.62 | 114.85 | 112.00 | 119.41 | 110.71 | 121.98 | 130.69 |
Our constitutive model and G&R formulation was implemented into the open-source code CalculiX [49]. A 2° piece of the axisymmetric tree shrew eye model was discretized into 170 twenty-node quadratic brick elements with reduced integration (C3D20R) and 10 fifteen-node wedge elements (C3D15) as shown in Figure 8d. The intraocular surfaces of the corneo-scleral shell were subjected to 15 mmHg IOP. We used our previously published prestressing method to apply IOP and presstress the model without deforming it [50].
The FE simulations of all groups started at 11 DVE and consists of up to four simulations steps: (i) prestressing at 15 mmHg IOP; (ii) normal development; (iii) -5D lens wear; (iv) recovery from -5D lens wear. The normal group G0 underwent the simulation steps (i) and (ii). The group G1 underwent the steps (i), (iii), and (iv), while the remaining groups G2−6 used all simulation steps (i–iv). The simplified model of the eye’s optical system in Subsection 3.2 was used to translate the axial length of the FE model into the refractive error. Axial length was defined as the distance between the corneal apex point (P1) and the intraocular node (P2) at the posterior pole as shown in Figure 8d.
The seven G&R model parameters ag, bg, and were then fitted by minimizing the cost function
| (19) |
which represents the sum of the squared residuals between the computationally predicted refractive error EFE according to (16) and the experimentally measured refractive error EExp. represents the average experimental refractive errors of group Gi (i = 0, 1, 2, … 6) at day j of visual experience. Ni represents the total number of refractive measurements of experimental group Gi. As we sum the squared residuals over all groups, the parameters obtained by the inverse fitting represent the best overall fit of our G&R model to all experimental groups.
To ensure that the fitting algorithm converged to the global minimum, we used the genetic algorithm implemented by MATLAB (The MathWorks Inc., version R2014b) for our inverse analysis. The population size was set to 150 and proportional fitness scaling was activated. The seven unknown model parameters were constrained according to Table 2. All other options of the genetic algorithm remained in their default setting.
Table 2.
The upper/lower bounds of the model parameters that were used for the inverse FE analysis.
| Parameter | ag | bg | ||||||||||
|---|---|---|---|---|---|---|---|---|---|---|---|---|
| Unit | Days−1 | Days | Days−1 | Days | - | D−1 | D | |||||
| Upper bound | 10 | 10 | 10 | 400 | 2 | 10 | 1 | |||||
| Lower bound | 10−3 | 10−3 | 10−4 | 0.1 | 0.1 | −10 | −1 |
3.4 Results
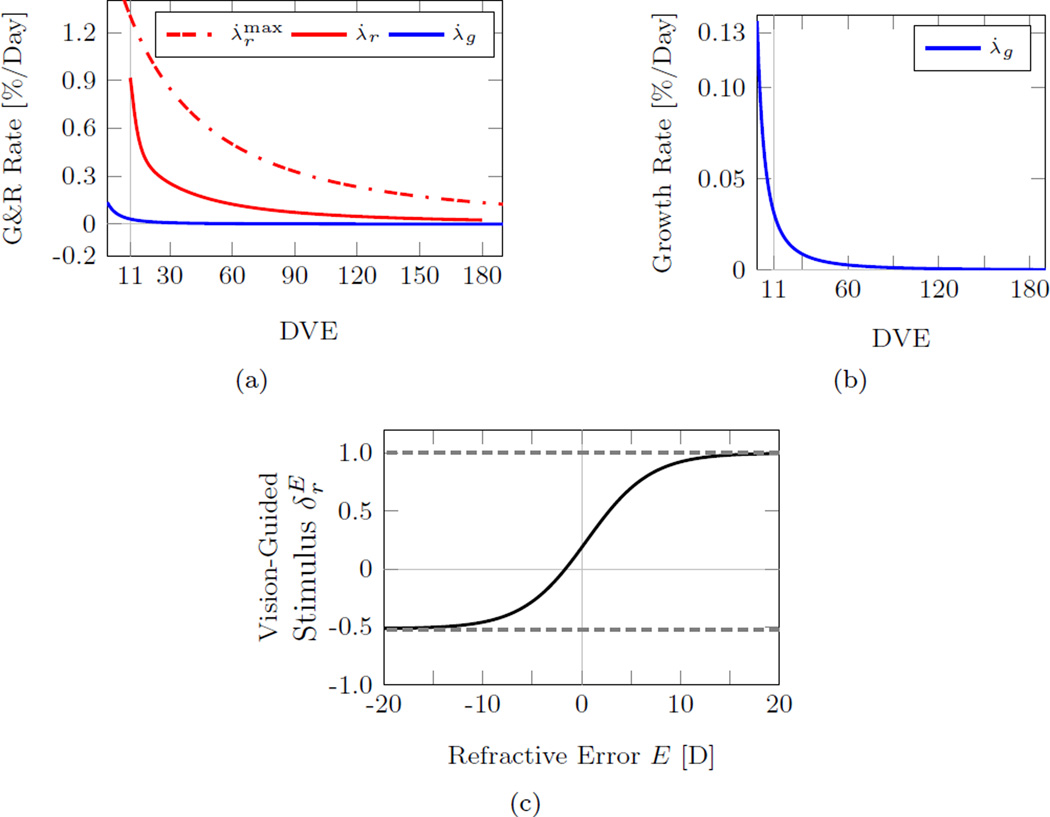
The best fit G&R parameters obtained by the inverse FE analysis are shown in Table 3. Figure 9 shows the growth rate (1), normal remodeling rate (2) and vision-guided stimulus function (4) that were obtained by the inverse FE analysis. Compared to the maximum remodeling rate, the growth rate decreased much faster with age impacting the refractive development of the eye only at very young ages (Figure 9a, b). The vision-guided stimulus function shown in Figure 9c suggests that scleral remodeling continues at a baseline level when emmetropia is reached. Furthermore, it also supports the notion that scleral remodeling can be reversed by scleral shortening as the stimulus function for refractive errors E < −1.66 D.
Table 3.
The best fit parameters of the G&R model obtained from the inverse FE analysis.
| Parameter | ag | bg | ||||||||||
|---|---|---|---|---|---|---|---|---|---|---|---|---|
| Unit | Days−1 | Days | Days−1 | Days | - | D−1 | D | |||||
| Best Fit | 0.00137 | 10.217 | 0.01749 | 69.094 | −0.51324 | 0.3095 | 0.4988 |
Fig. 9.
(a) The fitted normal growth rate (1), normal remodeling rate (2), and maximum remodeling rate (3) showing that scleral growth ceased at younger age compared to normal scleral remodeling. (b) Magnified view of the fitted normal growth rate suggesting that scleral growth impacts the axial development of the tree shrew eye solely at very young ages. (c) The fitted vision-guided stimulus function as defined in (4). At emmetropia (E = 0), the visual stimulus is larger than zero suggesting that scleral remodeling continues at a baseline rate when emmetropia is reached. Scleral shortening occurs for E < −1.66 D.
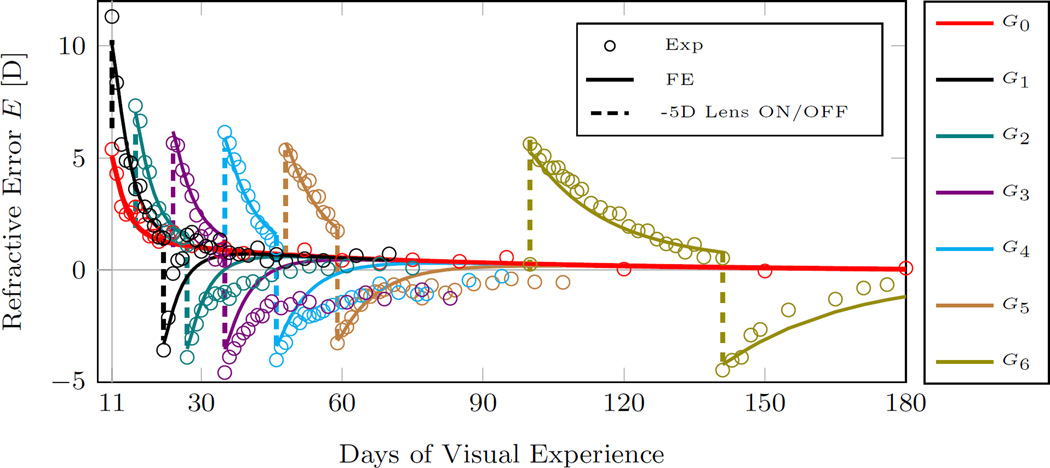
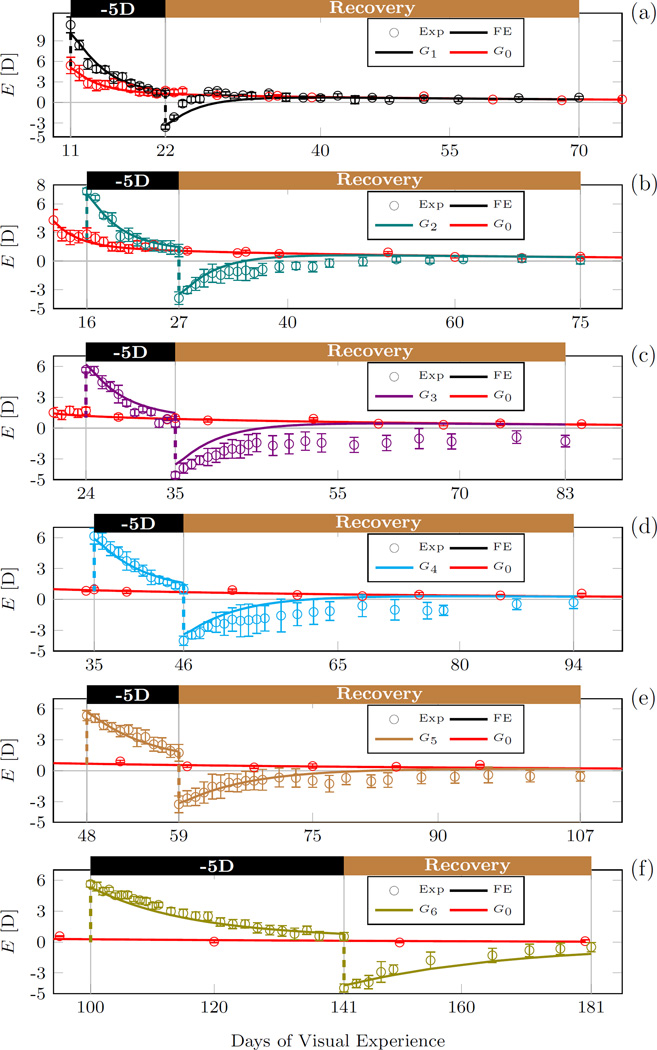
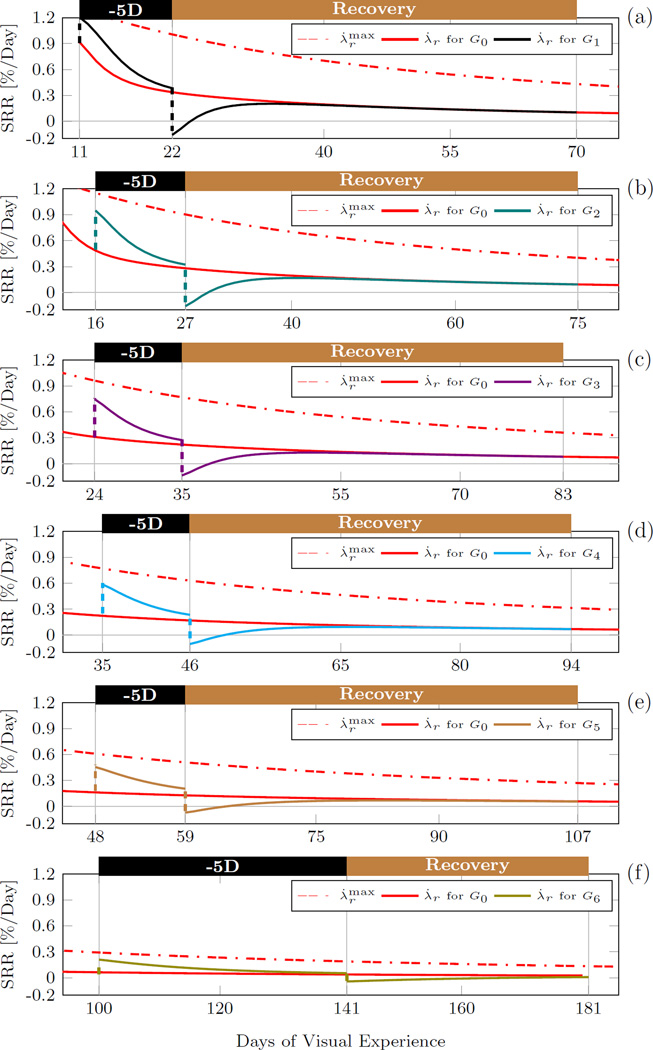
The experimental and computationally predicted evolution of the refractive error in G0−6 are plotted in Figure 10. For clarity, we plot the experimental and computationally predicted refractive error of each lens treated group G1−6 together with the normal group G0 in Figure 11. The evolution of the remodeling rates of each lens treated group G1−6 are plotted in Figure 12 together with the normal remodeling rate of G0 and the maximum remodeling rate. The G&R model replicated well the experimental data of all groups Figures 10, 11). In particular, the normal refractive development and the lens treatment periods were well replicated by the model. The recovery periods were less well matched. However, it is important to note that the variation in the experimental data was much higher during the recovery period as can be seen by the error bars in Figure 11.
Fig. 10.
Plots of the best fit results obtained by the inverse G&R analysis. Shown are the computationally calculated refractive error and the average experimental refractions of groups G0−6. The experimental tree shrew data of groups G1−6 was obtained form Norton et al. [32]. The G&R model replicated well the experimental data well, in particular, the normal development group (G0) and lens treatment period of the lens-treated groups (G1−6). The dashed lines indicate when the -5D lens was put ON or OFF in groups G1−6 (see Figure 5 for treatment history).
Fig. 11.
Magnified plots of the computationally calculated and the experimentally measured refractive errors (average, standard error of mean) of each lens treated group G1−6. The numerical results and experimental data of the normal group G0 is shown in all plots.
Fig. 12.
The scleral remodeling rate (SRR) predicted by the inverse G&R analysis for each lens treated group G1−6. The maximum remodeling rate and the normal remodeling rate λ̇r for G0 is shown in all plots.
Tree shrews are born hyperopic. Consequently, the initial remodeling rate (at 11 DVE) was high in our simulations (close to the maximum remodeling rate) (Figure 9a) but the normal remodeling rate decreased faster than the maximum remodeling rate as the normal eye emmetropized (Figure 10). When the -5D lens was put ON in G1−6, the remodeling rate increased followed by a slow decrease back to the normal remodeling rate as the eye emmetropized to the lens. Due to the age-dependent decrease in the maximum remodeling rate, the remodeling rate slowed with age from group G1 to G6 during lens treatment (Figure 12). When the -5D lens was taken OFF, the remodeling rate decreased to a negative value in all lens-treated groups (G1−6) suggesting that scleral remodeling was not only slowed but temporarily reversed (Figure 12). The remodeling rate returned back to normal levels as the eye recovered from the lens-induced myopia during the recovery period in G1−6.
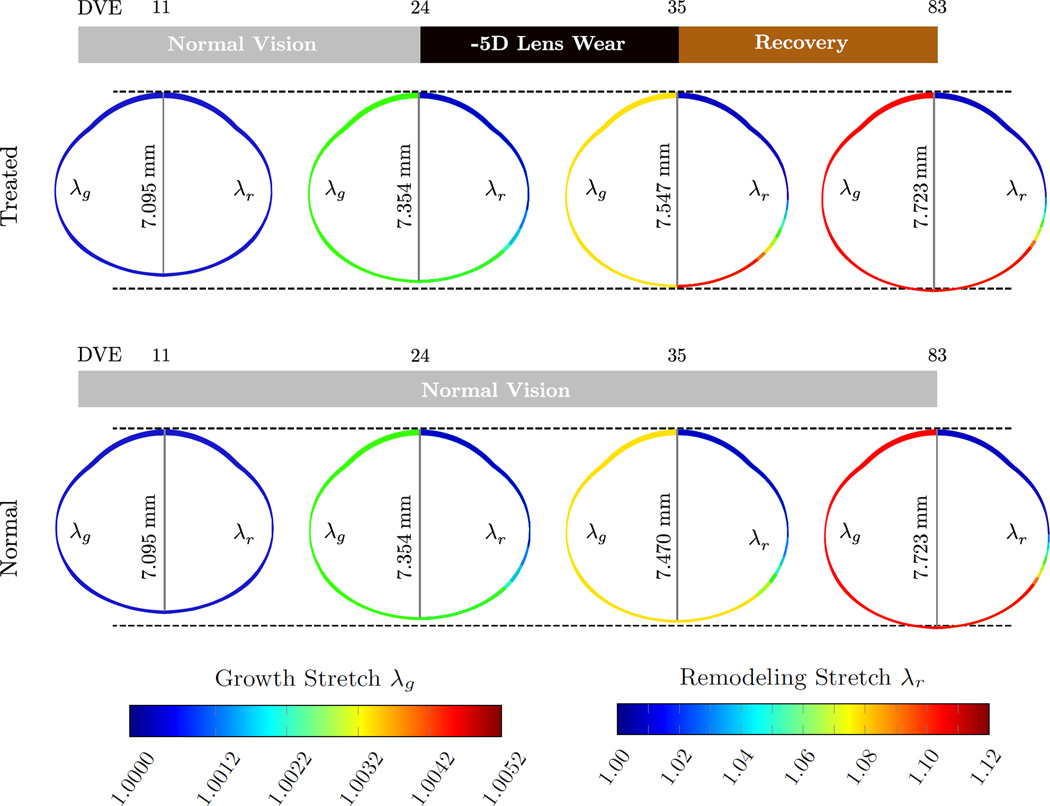
Figure 13 shows the evolution of the FE model including the axial length of the lens-treated group G3 and the normal group G0 for selected DVEs. The contour plot on the left (right) half of each eye shows the evolution growth (remodeling) stretch across the axisymmetric eye model. Based on our assumption that tissue growth is solely genetically controlled, the growth stretch evolved identically in both models. The normal and treated eyes remodeled in the same fashion until the age of 24 DVE. During lens treatment from 24 to 35 DVE the treated eye elongated at a faster rate due to accelerated scleral remolding induced by the -5D lens. Due to the lens-induced increase in the remodeling stretch, the treated eye was axially longer at 35 DVE when compared to the normal eye (7.547 mm vs. 7.470 mm). After the lens was removed, the treated eye recovered from myopia by slowing scleral remodeling resulting in a remodeling stretch distribution and axial length that matched the normal eye at 83 DVE.
Fig. 13.
Evolution of the eye’s axial length, the growth stretch λg (contour plot on left half of the FE model), and the remodeling stretch λr (contour plot on the right half of the FE model) for the lens treated group G3 and the normal group G0 at 11, 24, 35, and 83 DVE. While the growth stretch evolves identically in both models, the remolding stretch increased in G3 during the lens treatment when compared to normal eye development in G0. After the recovery period, the axial length and the remodeling stretch of the lens treated FE model evolved back to normal values.
4 Model Validation
In order to test the predictive power and to validate the proposed G&R model, we compared model predictions to experimental data that was not used to fit the model.
4.1 Susceptibility to Scleral Remodeling and Myopia
Siegwart and Norton [33] induced myopia in tree shrews for 12 days with a translucent occluder (form deprivation) starting at 7, 15, 21, 33, 48, and 63 DVE (n = 5 in each group). In contrast to a negative powered lens, form deprivation induces a constant visual stimulus that leads to progressive axial elongation and progressive myopia. Siegwart and Norton [33] calculated the susceptibility to myopia as the difference in refractive error between the form deprived and control eye after the 12 days of monocular treatment.
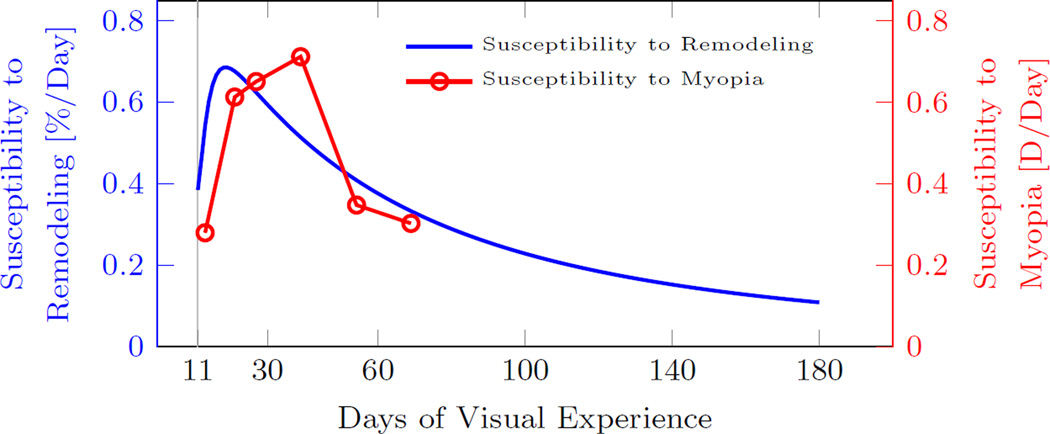
Within our G&R model, the scleral remodeling rate λ̇r decreased during normal eye development due to both, the age-dependent reduction of the maximum remodeling rate and the vision-guided stimulus . Based on our model, a normal eye is susceptible to develop myopia when . We define the susceptibility to scleral remodeling as the difference between the age-dependent maximum remodeling rate and the vision-guided remodeling rate λ̇r during normal eye development (G0). Let’s assume that form deprivation induces a visual stimulus that up-regulates scleral remodeling, which, in the worst case, can accelerate scleral remodeling up to its maximum rate . Consequently, the susceptibility to scleral remodeling should correlate to the eye’s susceptibility to myopia. The numerically predicted susceptibility to scleral remodeling and the experimentally measured susceptibility to myopia [33] are plotted in Figure 14. The numerical results match well the temporal trend of the experimental data well, where both, scleral remodeling and myopia, show an initial increase in susceptibility at juvenile age followed by a decrease in susceptibility at older ages.
Fig. 14.
Susceptibility of tree shrews to scleral remodeling predicted by the G&R model and the susceptibility to myopia experimentally obtained by Siegwart and Norton [33]. The susceptibility to myopia was measured as the difference in refractive error between the treated and control eye after 12 days of monocular form deprivation. The predicted age-dependent susceptibility to scleral remodeling follows the age-dependent trend of the susceptibility to myopia.
4.2 Scleral Remodeling During Form Deprivation
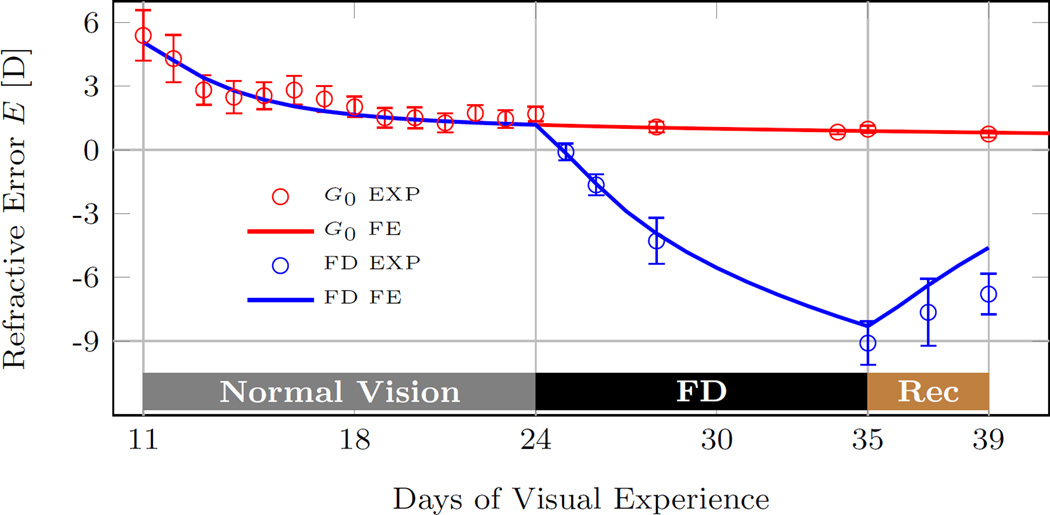
As discussed in the previous subsection, form deprivation provides a constant visual stimulus that induces axial elongation and myopia. Siegwart and Norton [24] form deprived a cohort of tree shrews (n = 5) from 24 to 35 DVE followed by 4 days of recovery. We estimated the refractive development of the treated eye by assuming that form deprivation in [24] provided a constant visual stimulus that increased scleral remodeling up to its maximum rate (). Figure 15 shows a good agreement between the numerically predicted and experimentally measured refractive development during form deprivation and recovery underlining the predictive power of the G&R model.
Fig. 15.
The computationally predicted (FE) and experimentally measured visual development (EXP) of a tree shrew eye during 11 days of form deprivation (FD) followed by 4 days of recovery. The predicted model replicates well the experimental data. The experimental data of the form deprivation group (average, standard error of mean) were obtained from Siegwart and Norton [24]. The experimental data and numerical prediction of the normal group G0 are shown for comparison.
5 Discussion
We have presented a multi-scale G&R model to simulate refractive development during normal eye development and lens-induced myopia in the tree shrew. The visual stimulus (refractive error) was computed at the organ-level, the age-dependent growth occurred at the tissue-level, and vision-guided remodeling was modeled at the lamella-level. The model was fitted to a wide range of data obtained from tree shrews that experienced normal vision, lens-induced myopia, and recovery from myopia at different ages. The G&R model was able to replicate the age- and vision-dependent response of the tree shrew eye. The model results suggest that scleral growth ceases much faster with age than scleral remodeling. During normal development, scleral remodeling was predicted to occur at a high rate (close to maximum) in very young tree shrews (< 15 DVE). The remodeling rate decreased with age and as the eye emmetropized but increased at any age when a negative lens was put on. The fitted vision-guided stimulus function suggests that scleral remodeling does not stop but continues at a baseline rate once emmetropia is reached. This baseline remodeling rate seems to be important to maintain clear vision during childhood as the ocular refractive components are still developing. Recovery from myopia was predicted to occur due to slowed scleral remodeling and a partial recovery of preceding remodeling deformations. These findings support the notion that eyes can detect the sign of blur [51] and can shorten to compensate for myopic defocus [30].
The G&R model was validated against two experiments that were not used to fit the model. The model predicted that tree shrews are most susceptible to lens-induced myopia and scleral remodeling at juvenile age, which is in good agreement with experimental observations by Siegwart and Norton [33]. The model provides a mechanistic explanation for the increased susceptibility at juvenile age. As the the tree shrew eye is hyperopic at birth, the visual stimulus is high until the eye is close to emmetropia (~ 20 DVE). Consequently, the susceptibility to myopia is low in very young animals (<15 DVE) as the eye is already remodeling at almost maximum speed. Once the normal tree shrew eye is close to emmetropia (~ 20 DVE), the susceptibility to myopia increases as the vision-guided stimulus has increased potential to accelerate scleral remodeling. At older ages, the susceptibility decreases as the maximum remodeling rate decreases with age, which may be due to an age-related accumulation of collagen crosslinks. The second validation showed that the G&R model can predict the refractive development of a tree shrew eye during form deprivation [24] underlining the predictive power of the model.
It is unclear what visual cues the retina detects. Our model uses the refractive error as a visual stimulus to alter scleral remodeling. Animal experiments and prevalence studies in humans suggest that other visual cues may impact the emmetropization process such as: form deprivation [24]; darkness [52]; near work [53]; contrast sensitivity [54–57]; light intensity [58–62]; chromatic cues [63–67]. Consequently, multiple visual cues may interact and alter scleral remodeling. Additional visual cues can be incorporated into our G&R model by changing the visual stimulus function .
Multiple mechanisms have been suggested to underly collagen remodeling in soft tissues: micro-deformations between fibrils, fibers, or lamellea [10; 29; 68]; collagen turnover [69–75]; or collagen fiber reorientation [76; 77]. We hypothesized that scleral remodeling in myopia is due to micro-deformations between collagen fibers and/or fibrils. We also assumed that these micro-deformations cease with age as predicted by the decrease in maximum scleral remodeling rate with age. Scleral remodeling deformations may be inhibited with age due to age-dependent accumulation of collagen crosslinks. McBrien and Norton [78] have shown that preventing natural collagen crosslinking alone does not alter the refractive development but doubles the axial elongation rate when used together with form deprivation in juvenile tree shrews. A recent study by Wang and Corpuz [79] has shown that artificial crosslinking using genipin slows myopia development in guinea pig. These two experimental observations support the notion that collagen crosslinks modulate the maximum scleral remodeling rate. Different remodeling mechanisms may or may not cease with age as assumed here. For instance, optic nerve head remodeling in glaucoma typically occurs in elderly, where myopic scleral remodeling is ineffective. We and others have suggested that optic nerve head remodeling in glaucoma may be due to altered collagen synthesis and degradation and not due to micro-deformations as proposed for scleral remodeling in myopia [34; 80; 81].
The proposed G&R model is based on many simplifications and assumptions. While its predictive power was investigated, many experimental observation can not be explained yet. Our model makes no difference between a myopic defocus that is induced by a positive powered lens or by removing a negative powered lens after myopia was induced. The experimental data used in this study shows that the tree shrew eye can recover from negative lens-induced myopia at all investigated ages, even in young adult animals [32]. In contrast to the recovery from myopia, the tree shrew eye can only adapt to a plus lens at very young ages [82]. At older ages, at which the recovery from myopia is still working, using a plus lens leads to axial elongation and myopia [83] while our model would predict the opposite. The underlying mechanism that leads to a different response during recovery from myopia and plus lens wear is unclear as both cause a myopic defocus. Additional or alternative visual cues (e.g. contrast), that are currently not accounted for in our model, might modulate scleral remodeling during myopic defocus. Rucker and Wallman [64] suggest that the eye can differentiate between hyperopic and myopic defocus based on changes in luminance and color contrast. Contrast sensitivity was shown to change with the current refractive state of the eye [55], which may underly the different response during plus lens wear and recovery from minus lenses. Our current model did not incorporate the effect of contrast on scleral remodeling, which may be an important visual cue during myopic defocus and may explain why our model was less successful in matching the recovery data.
While the G&R response was modeled using a multi-scale approach, the signaling of the visual defocus from the retina to the sclera was not modeled. The signaling molecules have to pass through the choroid, which may alter the signal [84–87] and contribute to the vision-guided response by choroidal thickening/thinning [88–90]. Furthermore, experimental evidence supports the notion that visual stimulus detection and signaling from the retina to the sclera occur locally [35–38; 91]. In particular, peripheral defocus is thought to promote myopia in humans [92–97]. We imposed heterogeneous scleral remodeling across the scleral shell using the function δα. Further advancements of the model are required to incorporate local vision-guided effects of the choroid and sclera.
We have proposed the first multi-scale model that distinguishes scleral growth from remodeling during eye development. The good fit of our model to a wide range of age- and vision-dependent refractive data, and the good agreement of model results to experimental data that were not used to fit the model supports the notion that scleral G&R are independently controlled mechanisms. The multi-scale simulation of scleral G&R provides new insight into the emmetropization process, which cannot be achieved by experiments alone as deformations due to growth cannot be distinguished from remodeling deformations with current experimental techniques.
Acknowledgments
This work was supported by the National Institutes of Health Grants R01-EY026588 (RG) and P30-EY003039 (Bethesda, Maryland); Eye Sight Foundation of Alabama (Birmingham, Alabama); and Research to Prevent Blindness (New York, New York). The authors would like to give special thanks to Dr. Thomas T. Norton for sharing his experimental data.
Contributor Information
Rafael Grytz, Department of Ophthalmology, University of Alabama at Birmingham, Birmingham, AL 35294, USA.
Mustapha El Hamdaoui, Department of Ophthalmology, University of Alabama at Birmingham, Birmingham, AL 35294, USA.
References
- 1.Dolgin Elie. The myopia boom. Nature. 2015 Mar;519(7543):276–278. doi: 10.1038/519276a. [DOI] [PubMed] [Google Scholar]
- 2.Vitale S, Sperduto RD, Ferris FL., III Increased prevalence of myopia in the united states between 1971–1972 and 1999–2004. Archives of Ophthalmology. 2009;127(12):1632–1639. doi: 10.1001/archophthalmol.2009.303. [DOI] [PubMed] [Google Scholar]
- 3.Lin LLK, Shih YF, Hsiao CK, Chen CJ. Prevalence of myopia in taiwanese schoolchildren: 1983 to 2000. Annals-Academy of Medicine Singapore. 2004;33(1):27–33. [PubMed] [Google Scholar]
- 4.Morgan Ian, Rose Kathryn. How genetic is school myopia? Progress in Retinal and Eye Research. 2005;24(1):1–38. doi: 10.1016/j.preteyeres.2004.06.004. [DOI] [PubMed] [Google Scholar]
- 5.Heine L. Beitrage zur anatomie des myopischen auges. Archiv für Augenheilkunde. 1899;38:277–290. [Google Scholar]
- 6.Saw Seang-Mei, Gazzard Gus, Shih-Yen Edwin Chan, Chua Wei-Han. Myopia and associated pathological complications. Ophthalmic and Physiological Optics. 2005;25(5):381–391. doi: 10.1111/j.1475-1313.2005.00298.x. [DOI] [PubMed] [Google Scholar]
- 7.Mitchell Paul, Hourihan Fleur, Sandbach Jen, Wang Jie Jin. The relationship between glaucoma and myopia: The blue mountains eye study. Ophthalmology. 1999;106(10):2010–2015. doi: 10.1016/s0161-6420(99)90416-5. [DOI] [PubMed] [Google Scholar]
- 8.Xu Liang, Wang Yaxing, Wang Shuang, Wang Yun, Jonas Jost B. High myopia and glaucoma susceptibility: The beijing eye study. Ophthalmology. 2007;114(2):216–220. doi: 10.1016/j.ophtha.2006.06.050. [DOI] [PubMed] [Google Scholar]
- 9.Qiu Mary, Wang Sophia Y, Singh Kuldev, Lin Shan C. Association between myopia and glaucoma in the united states populationmyopia and glaucoma in the us population. Investigative Ophthalmology & Visual Science. 2013;54(1):830. doi: 10.1167/iovs.12-11158. [DOI] [PMC free article] [PubMed] [Google Scholar]
- 10.Summers Rada Jody A, Shelton Setareh, Norton Thomas T. The sclera and myopia. Experimental Eye Research. 2006;82(2):185–200. doi: 10.1016/j.exer.2005.08.009. [DOI] [PubMed] [Google Scholar]
- 11.McBrien Neville A, Gentle Alex. Role of the sclera in the development and pathological complications of myopia. Progress in Retinal and Eye Research. 2003;22(3):307–338. doi: 10.1016/s1350-9462(02)00063-0. [DOI] [PubMed] [Google Scholar]
- 12.Norton TT, Siegwart JT. Animal models of emmetropization: matching axial length to the focal plane. Journal of the American Optometric Association. 1995;66(7):405–414. [PubMed] [Google Scholar]
- 13.Wallman Josh, Winawer Jonathan. Homeostasis of eye growth and the question of myopia. Neuron. 2004;43(4):447–468. doi: 10.1016/j.neuron.2004.08.008. [DOI] [PubMed] [Google Scholar]
- 14.Walls Gordon Lynn. The vertebrate eye and its adaptive radiation. New York: Cranbrook Institute of Science; 1942. [Google Scholar]
- 15.Torczynski E. Normal and abnormal ocular development in man. Prog Clin Biol Res. 1982;82:35–51. [PubMed] [Google Scholar]
- 16.Norton TT, Rada JA. Reduced extracellular matrix in mammalian sclera with induced myopia. Vision Res. 1995 May;35(9):1271–1281. doi: 10.1016/0042-6989(94)00243-f. [DOI] [PubMed] [Google Scholar]
- 17.Rada JA, Achen VR, Perry CA, Fox PW. Proteoglycans in the human sclera. evidence for the presence of aggrecan. Invest Ophthalmol Vis Sci. 1997 Aug;38(9):1740–1751. [PubMed] [Google Scholar]
- 18.Norton TT. Experimental myopia in tree shrews. Ciba Found Symp. 1990;155:178–94. discussion 194–9. [PubMed] [Google Scholar]
- 19.McBrien Neville A, Lawlor Patrick, Gentle Alex. Scleral remodeling during the development of and recovery from axial myopia in the tree shrew. Investigative Ophthalmology & Visual Science. 2000;41(12):3713. [PubMed] [Google Scholar]
- 20.Moring Anisha G, Baker John R, Norton Thomas T. Modulation of glycosaminoglycan levels in tree shrew sclera during lens-induced myopia development and recovery. Investigative Ophthalmology & Visual Science. 2007;48(7):2947. doi: 10.1167/iovs.06-0906. [DOI] [PMC free article] [PubMed] [Google Scholar]
- 21.Guo Lin, Frost Michael R, He Li, Siegwart John T, Jr, Norton Thomas T. Gene expression signatures in tree shrew sclera in response to three myopiagenic conditionsgene expression signatures in myopic sclera. Investigative Ophthalmology & Visual Science. 2013;54(10):6806. doi: 10.1167/iovs.13-12551. [DOI] [PMC free article] [PubMed] [Google Scholar]
- 22.Gao Hong, Frost Michael R, Siegwart John T, Norton Thomas T. Patterns of mRNA and protein expression during minus-lens compensation and recovery in tree shrew sclera. Mol Vis. 2011;17:903–919. [PMC free article] [PubMed] [Google Scholar]
- 23.Siegwart John T, Norton Thomas T. Selective regulation of MMP and timp mRNA levels in tree shrew sclera during minus lens compensation and recovery. Invest Ophthalmol Vis Sci. 2005 Oct;46(10):3484–3492. doi: 10.1167/iovs.05-0194. [DOI] [PMC free article] [PubMed] [Google Scholar]
- 24.Siegwart John T, Jr, Norton Thomas T. The time course of changes in mRNA levels in tree shrew sclera during induced myopia and recovery. Investigative Ophthalmology & Visual Science. 2002;43(7):2067. [PMC free article] [PubMed] [Google Scholar]
- 25.Gentle Alex, Liu Yanyan, Martin Jennifer E, Conti Giada L, McBrien Neville A. Collagen gene expression and the altered accumulation of scleral collagen during the development of high myopia. J Biol Chem. 2003 May;278(19):16587–16594. doi: 10.1074/jbc.M300970200. [DOI] [PubMed] [Google Scholar]
- 26.Siegwart JT, Norton TT. Regulation of the mechanical properties of tree shrew sclera by the visual environment. Vision Res. 1999 Jan;39(2):387–407. doi: 10.1016/s0042-6989(98)00150-3. [DOI] [PubMed] [Google Scholar]
- 27.Phillips JR, Khalaj M, McBrien NA. Induced myopia associated with increased scleral creep in chick and tree shrew eyes. Invest. Ophthalmol. Vis. Sci. 2000 Jul;41(8):2028–2034. [PubMed] [Google Scholar]
- 28.McBrien Neville A, Jobling Andrew I, Gentle Alex. Biomechanics of the sclera in myopia: extracellular and cellular factors. Optom Vis Sci. 2009 Jan;86(1):E23–E30. doi: 10.1097/OPX.0b013e3181940669. [DOI] [PubMed] [Google Scholar]
- 29.Grytz Rafael, Siegwart John T., Jr Changing material properties of the tree shrew sclera during minus lens compensation and recoveryscleral material properties in myopia. Investigative Ophthalmology & Visual Science. 2015;56(3):2065. doi: 10.1167/iovs.14-15352. [DOI] [PMC free article] [PubMed] [Google Scholar]
- 30.Zhu Xiaoying, McBrien Neville A, Smith Earl L, III, Troilo David, Wallman Josh. Eyes in various species can shorten to compensate for myopic defocus. Investigative Ophthalmology & Visual Science. 2013;54(4):2634. doi: 10.1167/iovs.12-10514. [DOI] [PMC free article] [PubMed] [Google Scholar]
- 31.Bryant Michael R, McDonnell Peter J. Optical feedback-controlled scleral remodeling as a mechanism for myopic eye growth. Journal of Theoretical Biology. 1998;193(4):613–622. doi: 10.1006/jtbi.1998.0727. [DOI] [PubMed] [Google Scholar]
- 32.Norton Thomas T, Amedo Angela O, Siegwart John T., Jr The effect of age on compensation for a negative lens and recovery from lens-induced myopia in tree shrews (Tupaia glis belangeri) Vision Research. 2010;50(6):564–576. doi: 10.1016/j.visres.2009.12.014. [DOI] [PMC free article] [PubMed] [Google Scholar]
- 33.Siegwart John T, Jr, Norton Thomas T. The susceptible period for deprivation-induced myopia in tree shrew. Vision Research. 1998;38(22):3505–3515. doi: 10.1016/s0042-6989(98)00053-4. [DOI] [PubMed] [Google Scholar]
- 34.Grytz Rafael, Sigal Ian A, Ruberti Jeffrey W, Meschke Günther, Downs J Crawford. Lamina cribrosa thickening in early glaucoma predicted by a microstructure motivated growth and remodeling approach. Mech. Mat. 2011;44:99–109. doi: 10.1016/j.mechmat.2011.07.004. [DOI] [PMC free article] [PubMed] [Google Scholar]
- 35.Guggenheim JA, McBrien NA. Form-deprivation myopia induces activation of scleral matrix metalloproteinase-2 in tree shrew. Invest Ophthalmol Vis Sci. 1996 Jun;37(7):1380–1395. [PubMed] [Google Scholar]
- 36.Diether S, Schaeffel F. Local changes in eye growth induced by imposed local refractive error despite active accommodation. Vision Res. 1997 Mar;37(6):659–668. doi: 10.1016/s0042-6989(96)00224-6. [DOI] [PubMed] [Google Scholar]
- 37.Hodos W, Kuenzel WJ. Retinal-image degradation produces ocular enlargement in chicks. Invest Ophthalmol Vis Sci. 1984 Jun;25(6):652–659. [PubMed] [Google Scholar]
- 38.Kang RN, Norton TT. Alteration of scleral morphology in tree shrews with induced myopia. Invest Ophthalmol Vis Sci. 1993;34 ARVO Abstract 1209. [Google Scholar]
- 39.Rodriguez Edward K, Hoger Anne, McCulloch Andrew D. Stress-dependent finite growth in soft elastic tissues. Journal of Biomechanics. 1994;27(4):455–467. doi: 10.1016/0021-9290(94)90021-3. [DOI] [PubMed] [Google Scholar]
- 40.Grytz Rafael, Meschke Günther. Constitutive modeling of crimped collagen fibrils in soft tissues. Journal of the Mechanical Behavior of Biomedical Materials. 2009;2(5):522–533. doi: 10.1016/j.jmbbm.2008.12.009. [DOI] [PubMed] [Google Scholar]
- 41.Grytz Rafael, Meschke Günther. A computational remodeling approach to predict the physiological architecture of the collagen fibril network in corneo-scleral shells. Biomechanics and Modeling in Mechanobiology. 2009;9(2):225–235. doi: 10.1007/s10237-009-0173-2. [DOI] [PubMed] [Google Scholar]
- 42.Grytz Rafael, Fazio Massimo A, Girard Michaël JA, Libertiaux Vincent, Bruno Luigi, Gardiner Stuart, Girkin Christopher A, Downs J Crawford. Material properties of the posterior human sclera. Journal of the Mechanical Behavior of Biomedical Materials. 2014;29:602–617. doi: 10.1016/j.jmbbm.2013.03.027. [DOI] [PMC free article] [PubMed] [Google Scholar]
- 43.Girard Michaël JA, Downs J Crawford, Burgoyne Claude F, Suh J-K Francis. Peripapillary and posterior scleral mechanics–part I: development of an anisotropic hyperelastic constitutive model. Journal of biomechanical engineering. 2009;131(5):051011. doi: 10.1115/1.3113682. [DOI] [PMC free article] [PubMed] [Google Scholar]
- 44.Suheimat Marwan, Verkicharla Pavan K, Mallen Edward A H, Rozema Jos J, Atchison David A. Refractive indices used by the Haag-Streit Lenstar to calculate axial biometric dimensions. Ophthalmic Physiol Opt. 2015 Jan;35(1):90–96. doi: 10.1111/opo.12182. [DOI] [PubMed] [Google Scholar]
- 45.Gann Drew. Master’s thesis. University of Alabama at Birmingham; 2013. Comparison of the Lenstar biometer and A-scan ultrasonography to measure ocular components. [Google Scholar]
- 46.Norton Thomas T, McBrien Neville A. Normal development of refractive state and ocular component dimensions in the tree shrew (tupaia belangeri) Vision Research. 1992;32(5):833–842. doi: 10.1016/0042-6989(92)90026-f. [DOI] [PubMed] [Google Scholar]
- 47.Marsh-Tootle WL, Norton TT. Refractive and structural measures of lid-suture myopia in tree shrew. Invest Ophthalmol Vis Sci. 1989 Oct;30(10):2245–2257. [PubMed] [Google Scholar]
- 48.Kang RN. PhD thesis. University of Alabama at Birmingham; 1994. A light and electronmicroscopic study of tree shrew sclera during normal development, induced myopia, and recovery. [Google Scholar]
- 49.Dhondt Guido. The Finite Element Method for Three-dimensional Thermomechanical Applications. Wiley Online Library; 2004. [Google Scholar]
- 50.Grytz Rafael, Downs J Crawford. A forward incremental prestressing method with application to inverse parameter estimations and eye-specific simulations of posterior scleral shells. Computer Methods in Biomechanics and Biomedical Engineering. 2013;16(7):768–780. doi: 10.1080/10255842.2011.641119. [DOI] [PMC free article] [PubMed] [Google Scholar]
- 51.Park Tae Woo, Winawer Jonathan, Wallman Josh. Further evidence that chick eyes use the sign of blur in spectacle lens compensation. Vision Res. 2003 Jun;43(14):1519–1531. doi: 10.1016/s0042-6989(03)00180-9. [DOI] [PubMed] [Google Scholar]
- 52.Norton Thomas T, Amedo Angela O, Siegwart John T., Jr Darkness causes myopia in visually experienced tree shrews. Invest Ophthalmol Vis Sci. 2006 Nov;47(11):4700–4707. doi: 10.1167/iovs.05-1641. [DOI] [PMC free article] [PubMed] [Google Scholar]
- 53.Loman Jane, Quinn Graham E, Kamoun Layla, Ying Gui-Shuang, Maguire Maureen G, Hudesman David, Stone Richard A. Darkness and near work: myopia and its progression in third-year law students. Ophthalmology. 2002 May;109(5):1032–1038. doi: 10.1016/s0161-6420(02)01012-6. [DOI] [PubMed] [Google Scholar]
- 54.Schmid Katrina L, Brinkworth Darren R, Wallace Kate M, Hess Robert. The effect of manipulations to target contrast on emmetropization in chick. Vision Res. 2006 Mar;46(6–7):1099–1107. doi: 10.1016/j.visres.2005.08.017. [DOI] [PubMed] [Google Scholar]
- 55.Diether S, Gekeler F, Schaeffel F. Changes in contrast sensitivity induced by defocus and their possible relations to emmetropization in the chicken. Invest Ophthalmol Vis Sci. 2001 Nov;42(12):3072–3079. [PubMed] [Google Scholar]
- 56.Ohlendorf Arne, Schaeffel Frank. Contrast adaptation induced by defocus – A possible error signal for emmetropization? Vision Res. 2009 Jan;49(2):249–256. doi: 10.1016/j.visres.2008.10.016. [DOI] [PubMed] [Google Scholar]
- 57.Rajeev Narayanan, Metha Andrew. Enhanced contrast sensitivity confirms active compensation in blur adaptation. Invest Ophthalmol Vis Sci. 2010 Feb;51(2):1242–1246. doi: 10.1167/iovs.09-3965. [DOI] [PubMed] [Google Scholar]
- 58.Ashby Regan, Ohlendorf Arne, Schaeffel Frank. The effect of ambient illuminance on the development of deprivation myopia in chicks. Investigative ophthalmology & visual science. 2009;50(11):5348–5354. doi: 10.1167/iovs.09-3419. [DOI] [PubMed] [Google Scholar]
- 59.Ashby Regan S, Schaeffel Frank. The effect of bright light on lens compensation in chicks. Investigative ophthalmology & visual science. 2010;51(10):5247–5253. doi: 10.1167/iovs.09-4689. [DOI] [PubMed] [Google Scholar]
- 60.Siegwart John T, Ward Alexander H, Norton Thomas T. Moderately elevated fluorescent light levels slow form deprivation and minus lens-induced myopia development in tree shrews. Invest Ophthalmol Vis Sci. 2012;53 ARVO E-Abstract 3457. [Google Scholar]
- 61.Smith Earl L, Hung Li-Fang, Huang Juan. Protective effects of high ambient lighting on the development of form-deprivation myopia in rhesus monkeys. Investigative ophthalmology & visual science. 2012;53(1):421–428. doi: 10.1167/iovs.11-8652. [DOI] [PMC free article] [PubMed] [Google Scholar]
- 62.Karouta Cindy, Ashby Regan Scott. Correlation between light levels and the development of deprivation myopia. Invest Ophthalmol Vis Sci. 2015;56(1):299–309. doi: 10.1167/iovs.14-15499. [DOI] [PubMed] [Google Scholar]
- 63.Long Qin, Chen Donghong, Chu Renyuan. Illumination with monochromatic long-wavelength light promotes myopic shift and ocular elongation in newborn pigmented guinea pigs. Cutaneous and ocular toxicology. 2009;28(4):176–180. doi: 10.3109/15569520903178364. [DOI] [PubMed] [Google Scholar]
- 64.Rucker FJ, Wallman J. Chicks use changes in luminance and chromatic contrast as indicators of the sign of defocus. J Vis. 2012;12(6):23. doi: 10.1167/12.6.23. [DOI] [PMC free article] [PubMed] [Google Scholar]
- 65.Rucker Frances J. The role of luminance and chromatic cues in emmetropisation. Ophthalmic Physiol Opt. 2013 May;33(3):196–214. doi: 10.1111/opo.12050. [DOI] [PubMed] [Google Scholar]
- 66.Smith Earl L, Hung Li-Fang, Arumugam Baskar, Holden Brien A, Neitz Maureen, Neitz Jay. Effects of long-wavelength lighting on refractive development in infant rhesus monkeys. Investigative ophthalmology & visual science. 2015;56(11):6490–6500. doi: 10.1167/iovs.15-17025. [DOI] [PMC free article] [PubMed] [Google Scholar]
- 67.Rucker Frances, Britton Stephanie, Spatcher Molly, Hanowsky Stephan. Blue light protects against temporal frequency sensitive refractive changes the role of blue light in the development of myopia. Investigative ophthalmology & visual science. 2015;56(10):6121–6131. doi: 10.1167/iovs.15-17238. [DOI] [PMC free article] [PubMed] [Google Scholar]
- 68.Meek Keith M, Tuft Stephen J, Huang Yifei, Gill Paulvinder S, Hayes Sally, Newton Richard H, Bron Anthony J. Changes in collagen orientation and distribution in keratoconus corneas. Invest Ophthalmol Vis Sci. 2005;46(6):1948–1956. doi: 10.1167/iovs.04-1253. [DOI] [PubMed] [Google Scholar]
- 69.Humphrey JD, Rajagopal KR. A constrained mixture model for growth and remodeling of soft tissues. Mathematical Models and Methods in Applied Sciences. 2002;12(3):407–430. [Google Scholar]
- 70.Gleason RL, Humphrey JD. A mixture model of arterial growth and remodeling in hypertension: altered muscle tone and tissue turnover. J Vasc Res. 2004;41(4):352–363. doi: 10.1159/000080699. [DOI] [PubMed] [Google Scholar]
- 71.Machyshyn IM, Bovendeerd PHM, Ven AAF, Rongen PMJ, Vosse FN. A model for arterial adaptation combining microstructural collagen remodeling and 3D tissue growth. Biomechanics and Modeling in Mechanobiology. 2010;9(6):671–687. doi: 10.1007/s10237-010-0204-z. [DOI] [PubMed] [Google Scholar]
- 72.Ambrosi D, Ateshian GA, Arruda EM, Cowin SC, Dumais J, Goriely A, Holzapfel GA, Humphrey JD, Kemkemer R, Kuhl E, Olberding JE, Taber LA, Garikipati K. Perspectives on biological growth and remodeling. J Mech. Phys. Solids. 2011 Apr;59(4):863–883. doi: 10.1016/j.jmps.2010.12.011. [DOI] [PMC free article] [PubMed] [Google Scholar]
- 73.Kuhl Ellen. Growing matter: A review of growth in living systems. J Mech Behav Biomed Mater. 2014 Jan;29:529–543. doi: 10.1016/j.jmbbm.2013.10.009. [DOI] [PubMed] [Google Scholar]
- 74.Cyron CJ, Humphrey JD. Growth and remodeling of load-bearing biological soft tissues. Meccanica. 2016 doi: 10.1007/s11012-016-0472-5. [DOI] [PMC free article] [PubMed] [Google Scholar]
- 75.Cyron CJ, Humphrey JD. Vascular homeostasis and the concept of mechanobiological stability. Int J Eng Sci. 2014 Dec;85:203–223. doi: 10.1016/j.ijengsci.2014.08.003. [DOI] [PMC free article] [PubMed] [Google Scholar]
- 76.Pluijmert M, Kroon W, Delhaas T, Bovendeerd PHM. Adaptive reorientation of cardiac myofibers: The long-term effect of initial and boundary conditions. Mech. Res. Comm. 2012;42:60–67. [Google Scholar]
- 77.Kroon Martin. Modeling of fibroblast-controlled strengthening and remodeling of uniaxially constrained collagen gels. J Biomech. Eng. 2010;132(11):111008. doi: 10.1115/1.4002666. [DOI] [PubMed] [Google Scholar]
- 78.McBrien Neville A, Norton Thomas T. Prevention of collagen crosslinking increases form-deprivation myopia in tree shrew. Experimental Eye Research. 1994;59(4):475–486. doi: 10.1006/exer.1994.1133. [DOI] [PubMed] [Google Scholar]
- 79.Wang Mengmeng, Corpuz Christine Carole C. Effects of scleral crosslinking using genipin on the process of form-deprivation myopia in the guinea pig: a randomized controlled experimental study. BMC Ophthalmology. 2015;15(1):1–7. doi: 10.1186/s12886-015-0086-z. [DOI] [PMC free article] [PubMed] [Google Scholar]
- 80.Grytz R, Girkin CA, Libertiaux V, Downs JC. Perspectives on biomechanical growth and remodeling mechanisms in glaucoma. Mechanics Research Communications. 2012;42:92–106. doi: 10.1016/j.mechrescom.2012.01.007. [DOI] [PMC free article] [PubMed] [Google Scholar]
- 81.Roberts Michael D, Grau Vicente, Grimm Jonathan, Reynaud Juan, Bellezza Anthony J, Burgoyne Claude F, Downs J Crawford. Remodeling of the connective tissue microarchitecture of the lamina cribrosa in early experimental glaucoma. Invest. Ophthalmol. Vis. Sci. 2009;50(2):681–690. doi: 10.1167/iovs.08-1792. [DOI] [PMC free article] [PubMed] [Google Scholar]
- 82.Siegwart John T, Norton Thomas T. Binocular lens treatment in tree shrews: Effect of age and comparison of plus lens wear with recovery from minus lens-induced myopia. Exp Eye Res. 2010 Nov;91(5):660–669. doi: 10.1016/j.exer.2010.08.010. [DOI] [PMC free article] [PubMed] [Google Scholar]
- 83.Metlapally Sangeetha, McBrien Neville A. The effect of positive lens defocus on ocular growth and emmetropization in the tree shrew. J Vis. 2008;8(3):1.1–112. doi: 10.1167/8.3.1. [DOI] [PubMed] [Google Scholar]
- 84.He Li, Frost Michael R, Siegwart John T, Jr, Norton Thomas T. Gene expression signatures in tree shrew choroid in response to three myopiagenic conditions. Vision Res. 2014 Sep;102:52–63. doi: 10.1016/j.visres.2014.07.005. [DOI] [PMC free article] [PubMed] [Google Scholar]
- 85.Summers Rada Jody A, Palmer Lisa. Choroidal regulation of scleral glycosaminoglycan synthesis during recovery from induced myopia. Invest Ophthalmol Vis Sci. 2007 Jul;48(7):2957–2966. doi: 10.1167/iovs.06-1051. [DOI] [PubMed] [Google Scholar]
- 86.Li H, Wu J, Cui D, Zeng J. Retinal and choroidal expression of BMP-2 in lens-induced myopia and recovery from myopia in guinea pigs. Mol. Med. Rep. 2016;13(3):2671–2676. doi: 10.3892/mmr.2016.4843. [DOI] [PubMed] [Google Scholar]
- 87.Summers Jody A. The choroid as a sclera growth regulator. Exp Eye Res. 2013 Sep;114:120–127. doi: 10.1016/j.exer.2013.03.008. [DOI] [PMC free article] [PubMed] [Google Scholar]
- 88.Howlett Marcus H C, McFadden Sally A. Emmetropization and schematic eye models in developing pigmented guinea pigs. Vision Res. 2007 Apr;47(9):1178–1190. doi: 10.1016/j.visres.2006.12.019. [DOI] [PubMed] [Google Scholar]
- 89.Summers Rada Jody A, Wiechmann Allan F, Hollaway Lindsey R, Baggenstoss Bruce A, Weigel Paul H. Increased hyaluronan synthase-2 mRNA expression and hyaluronan accumulation with choroidal thickening: response during recovery from induced myopia. Invest Ophthalmol Vis Sci. 2010 Dec;51(12):6172–6179. doi: 10.1167/iovs.10-5522. [DOI] [PMC free article] [PubMed] [Google Scholar]
- 90.Troilo D, Nickla DL, Wildsoet CF. Choroidal thickness changes during altered eye growth and refractive state in a primate. Invest. Ophthalmol. Vis. Sci. 2000 May;41(6):1249–1258. [PubMed] [Google Scholar]
- 91.Smith Earl L, 3rd, Hung Li-Fang, Huang Juan, Blasdel Terry L, Humbird Tammy L, Bockhorst Kurt H. Effects of optical defocus on refractive development in monkeys: evidence for local, regionally selective mechanisms. Invest Ophthalmol Vis Sci. 2010 Aug;51(8):3864–3873. doi: 10.1167/iovs.09-4969. [DOI] [PMC free article] [PubMed] [Google Scholar]
- 92.Backhouse Simon, Fox Stephanie, Ibrahim Basma, Phillips John R. Peripheral refraction in myopia corrected with spectacles versus contact lenses. Ophthalmic Physiol Opt. 2012 Jul;32(4):294–303. doi: 10.1111/j.1475-1313.2012.00912.x. [DOI] [PubMed] [Google Scholar]
- 93.Fedtke Cathleen, Ehrmann Klaus, Holden Brien A. A review of peripheral refraction techniques. Optom Vis Sci. 2009 May;86(5):429–446. doi: 10.1097/OPX.0b013e31819fa727. [DOI] [PubMed] [Google Scholar]
- 94.Benavente-Pérez Alexandra, Nour Ann, Troilo David. Axial eye growth and refractive error development can be modified by exposing the peripheral retina to relative myopic or hyperopic defocus. Invest Ophthalmol Vis Sci. 2014;55(10):6765–6773. doi: 10.1167/iovs.14-14524. [DOI] [PMC free article] [PubMed] [Google Scholar]
- 95.Faria-Ribeiro Miguel, Queirós António, Lopes-Ferreira Daniela, Jorge Jorge, González-Méijome José Manuel. Peripheral refraction and retinal contour in stable and progressive myopia. Optom Vis Sci. 2013 Jan;90(1):9–15. doi: 10.1097/OPX.0b013e318278153c. [DOI] [PubMed] [Google Scholar]
- 96.Mutti DO, Sholtz RI, Friedman NE, Zadnik K. Peripheral refraction and ocular shape in children. Invest Ophthalmol Vis Sci. 2000 Apr;41(5):1022–1030. [PubMed] [Google Scholar]
- 97.Radhakrishnan Hema, Allen Peter M, Calver Richard I, Theagarayan Baskar, Price Holly, Rae Sheila, Sailoganathan Ananth, O’Leary Daniel J. Peripheral refractive changes associated with myopia progression. Invest Ophthalmol Vis Sci. 2013;54(2):1573–1581. doi: 10.1167/iovs.12-10278. [DOI] [PubMed] [Google Scholar]


