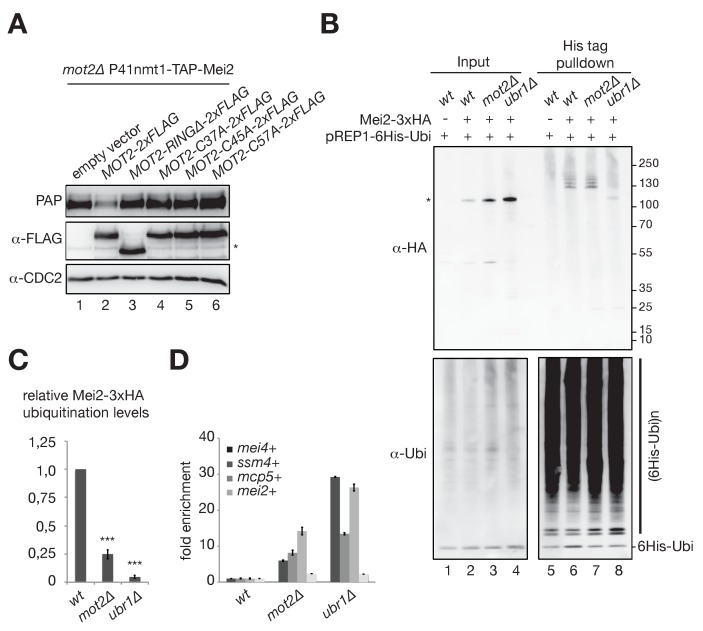
Figure 6. The E3 ubiquitin ligase activity of Mot2 is required for repressing Mei2 during vegetative growth.
(A) Western blot showing total TAP-Mei2 levels expressed from the P41nmt1 promoter in cells of the indicated genetic backgrounds and grown in minimal medium lacking leucine (EMM-LEU0.5X). An anti-FLAG antibody was used to detect Mot2 variants expressed from the pREP41 vector. An anti-CDC2 antibody was used as loading control. The star denotes a non-specific band. (B) In vivo ubiquitination of Mei2-3xHA in wt, mot2∆ and ubr1∆ cells expressing 6His tagged-ubiquitin in minimal medium (EMM-LEU0.5X). Total and ubiquitinated Mei2 as well as ubiquitin conjugates were analyzed by immunoblotting using anti-HA and anti-ubiquitin antibodies respectively. An untagged wild type strain was used as negative control. The star denotes unmodified Mei2 molecules. (C) Quantification of Mei2 ubiquitinated species relative to total protein levels and expressed relative to Mei2-3xHA wild type cells. Error bars represent the standard deviation from five independent experiments. Stars denote statistical significance relative to Mei2-3xHA wild type cells (t-test p-values=2.29E-6 for mot2∆, and 5.64E-9 for ubr1∆). (D) RT-qPCR analysis of meiotic transcripts in wt, mot2∆ and ubr1∆ cells. Shown is the fold enrichment of RNAs levels normalized to act1+ transcripts and expressed relative to the wild type strain. Error bars represent the deviation from the mean of biological duplicates.


