

Abstract
Purpose
To develop and test the feasibility of a spectrally resolved fully phase-encoded (SR-FPE) three-dimensional fast spin-echo technique and to demonstrate its application for distortion-free imaging near metal and chemical species separation.
Methods
In separate scans at 1.5 T, a hip prosthesis phantom and a sphere filled with gadolinium solution were imaged with SR-FPE and compared to conventional three-dimensional-fast spin-echo. Spectral modeling was performed on the SR-FPE data to generate the following parametric maps: species-specific signal (ρspecies), B0 field inhomogeneity, and . The prosthesis phantom was also scanned using a 16-channel coil at 1.5 T. The fully sampled k-space data were retrospectively undersampled to demonstrate the feasibility of parallel imaging acceleration in all three phase-encoding directions, in combination with corner-cutting and half-Fourier sampling. Finally, SR-FPE was performed with an acetone/water/oil phantom to test chemical species separation.
Results
High quality distortion-free images and parametric maps were generated from SR-FPE. A 4 h SR-FPE scan was retrospectively accelerated to 12 min while preserving spectral information and 7.5 min without preserving spectral data. Chemical species separation was demonstrated in the acetone/water/oil phantom.
Conclusion
This work demonstrates the feasibility of SR-FPE to perform chemical species separation and spectrally resolved imaging near metal without distortion, in scan times appropriate for the clinical setting.
Keywords: fully phase-encoded, metal artifact reduction, imaging near metal, spectroscopic imaging, chemical species separation, 3D parallel imaging
Over the past several decades, the aging population has led to an increased incidence of osteoarthritis resulting in more joint replacements and implantation of mechanical prostheses. Between 1991 and 2010, both primary knee replacements and revision knee replacements have more than doubled (1). Hip replacements and revisions have also increased in recent years (2) and these trends are expected to continue (3). Accurate evaluation of complications associated with metallic implants has become a significant clinical need. Compounding this need, a worldwide recall of two common hip prostheses is estimated to affect over 93,000 patients. The Australian Orthopaedic Association National Joint Replacement Registry estimate that 11–13.6% of these patients will require revision arthroplasty within 6 years (4). Surgical revision is more complicated than primary replacements and can only be offered a limited number of times, if ever, for a given patient. For this reason, as well as the cost and morbidity associated with surgical revision, maximizing the life of each prosthetic implant is critical.
Ideally, imaging would enable early detection of complications such as infection, synovitis, osteolysis, and implant loosening (5). Unfortunately, traditional prosthetic imaging using nuclear scintigraphy and X-ray radiography has poor soft tissue contrast and poor specificity (6). Conventional MRI is widely used and is highly accurate for evaluation of many musculoskeletal disorders, but its use has been severely limited in the presence of metal. One major challenge is that the metal-induced susceptibility changes in the B0 field create a wide distribution of proton resonant frequencies in adjacent tissue. This causes in-plane distortion when frequency-encoding, slice distortion when using slice-selective techniques, or signal loss in the case of three-dimensional (3D) methods due to limitations in radio-frequency (RF) excitation bandwidth. Severe off-resonance also poses challenges for robust fat-supression methods that require a homogeneous magnetic field.
Fortunately, tremendous improvements in MR imaging near metal have been achieved in recent years (6,7). Multiacquisition variable-resonance image combination (MAVRIC) is an approach that utilizes 3D imaging acquired at multiple RF offsets to cover the wide spectrum of off-resonance (8). Slice encoding for metal artifact correction (SEMAC) is another method used for imaging near metal that addresses extreme off-resonance by employing phase-encoding along the slice dimension for each slice-selective excitation, resolving distorted slice profiles (9). Recently, the two techniques were combined into a hybrid method (10). These MAVRIC/SEMAC methods have demonstrated promising diagnostic capabilities, detecting periprosthetic osteolysis and synovitis near metallic implants (11,12).
Although MAVRIC and SEMAC are important advancements for imaging near metallic implants, they both suffer from in-plane spatial distortion in the frequency-encoding direction. View angle tilting (13) and Jacobian methods (14) can help to reduce in-plane distortion, but these errors are unavoidable when the local susceptibility-induced gradient inside a voxel exceeds the readout gradient (15). Ultimately, any MR acquisition that uses frequency-encoding is fundamentally limited in its ability to eliminate distortion artifacts related to metal.
Phase-encoding is an alternative to frequency-encoding that completely avoids distortion. Phase-encoding all three dimensions, previously known as single point imaging, has been shown to produce distortion-free images near metal using a variety of gradient echo approaches (16–18). The main limitation to 3D phase-encoded methods is long scan time. This has delayed research and development for these methods and precluded clinical use.
In recent years, considerable effort has been devoted to accelerating MRI scans by tailoring and optimizing both image acquisition and reconstruction. Many of these acceleration techniques, such as parallel imaging, have been so successful that they are now routinely used in clinical protocols (19). Further, 3D fast spin-echo (FSE) methods are also in mainstream clinical use, thanks to the additional effective acceleration achieved using extended echo train acquisitions (20,21).
3D phase-encoding also allows the collection of spectral data, by replacing frequency-encoding with temporal sampling, although this has not previously been demonstrated near metal. Acquiring multiple samples can increase the signal-to-noise ratio (SNR) significantly and may prove critical for accelerating 3D phase-encoded acquisitions to clinical scan times. Spectral data also permits estimation of B0 field inhomogeneity and , even in regions near metal with extreme frequency offsets and very rapid signal decay. The clinical utility of spectral data near metal has yet to be explored, but it may be beneficial in detecting wear-induced metallic debris in tissue adjacent to prostheses (22). In another application, it may aid in imaging super paramagnetic iron oxide particles by serving as a positive contrast mechanism. Finally, spectral data aquired with 3D phase-encoding offers the possibility for chemical species separation in regions with off-resonance that would be challenging for traditional fat-saturation methods.
The purpose of this work was to develop and test a spectrally resolved fully phase-encoded (SR-FPE) 3D FSE technique for distortion-free imaging near metal. Acceleration methods are demonstrated, including parallel imaging acceleration in three directions, to achieve the scan time reductions necessary for clinical implementation. This technique allowed for spectral sampling across each echo which was used to produce B0 inhomogeneity maps and maps. Finally, the feasibility of chemical species separation is also demonstrated.
THEORY
Pulse Sequence
To avoid frequency-encoding errors in areas of extreme B0 inhomogeneity while preserving spectral information, a new pulse sequence was developed. SR-FPE, as shown in Figure 1, eliminates readout gradients by phase-encoding in all three dimensions. Further, it uses a 3D-FSE excitation scheme and extended refocusing trains via modulated flip angles (20). Each echo is symmetrically sampled through time to enable spectral decomposition and high SNR performance.
FIG. 1.
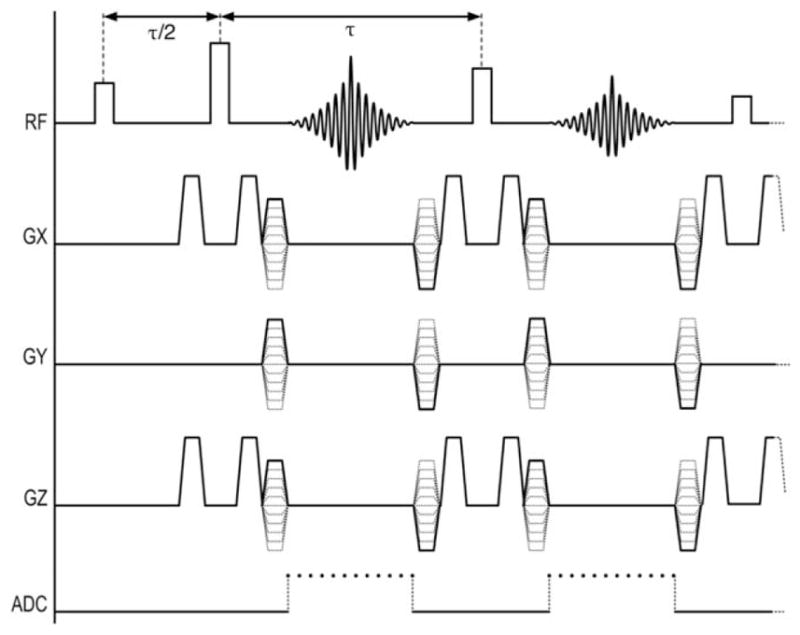
Proposed pulse sequence with phase-encoding in all three dimensions, temporal sampling of each echo, and no frequency-encoding gradient, entirely avoiding distortion from off-resonance effects. A variable flip angle schedule for the refocusing pulses (20) permits an extended echo train for the 3D-FSE acquisition.
This technique is unique with respect to existing single point imaging-related methods, such as SPRITE (16) or PETRA (17). Such methods do not allow the collection of spectral data and use gradient echo approaches that inherently suffer from signal loss in voxels with large local gradients due to T2* dephasing. The SR-FPE technique presented here more closely resembles 3D chemical shift imaging, but instead of standard spin-echo [SE, 1 phase-encode/pulse repetition time (TR)], it employs an FSE excitation scheme with extended refocusing trains (e.g., 64 phase-encodes/TR) using modulated flip angles to preserve signal. This FSE approach significantly accelerates spatial encoding compared to conventional chemical shift imaging. However, it results in lower spectral resolution because the sampling time is shorter. For example, multiple analog-to-digital converter (ADC) samples collected over 8 ms yield a spectral resolution of 1/8 ms = 125 Hz. This trade-off seems acceptable near metal because 125 Hz is capable of characterizing the extreme off-resonance as well as the rapid signal decay.
Spectral Analysis
A standard Fourier transform (FT) can be applied in the time dimension on a voxel-by-voxel basis to produce spectroscopic images. Alternatively, the temporal signal can be modeled for M chemical species (m = 1, …, M)
| [1] |
where Sn(r) = measured signal for voxel at location r, tn = time at sample n relative to the echo, ρm = signal for species m, Δfm = frequency offset of species m relative to water, and . Please note that when spectral modeling is used to decompose the various species, complex spectral models for species such as fat, which have multiple spectral peaks, can be incorporated into Eq. [1] for more accurate decomposition of these species (23,24). Also note that chemical shift artifacts caused by frequency-encoding are inherently avoided with this fully phase-encoded technique. When only one chemical species is present, Eq. [1] can be simplified as:
| [2] |
Estimation of the species signal, and the B0 field map can be performed using established complex fitting methods (25,26). It should be noted that the SNR performance of the separated species images will be very high due to the effective averaging that occurs when using the FT or signal modeling. This occurs because each data point is acquired independently, with independent complex Gaussian noise. Moreover, spectral sampling can be performed with much lower receiver bandwidths (e.g., ±7.8 kHz) compared to conventional imaging near metal (e.g., ±125 kHz). Thus, the SNR performance of SR-FPE is far higher than conventional acquisitions.
Opportunities for Acceleration
As previously discussed, phase-encoding in three dimensions requires prohibitively long scan times. For example, acquisition of a 128 × 128 × 128 image volume using a 3D-FSE scheme with an echo train length (ETL) of 128 and TR = 2 s would require 9 h, 6 min to complete. However, if we take advantage of well-established acceleration methods, it is possible to reduce this to clinically acceptable scan times. For instance, a 3D fully phase-encoded acquisition benefits significantly from 3D corner-cutting. The volume of a sphere divided by that of a cube (4/3 πr3/(2r)3 = 0.52, yielding a factor of nearly two in scan time reduction, compared to just 22% using corner cutting in a 2D plane (27).
In addition, the acquisition can be accelerated in all three phase-encoding dimensions, offering undersampling factors ranging from approximately 8–27 (e.g., R = 2 × 2 × 2 = 8 or R = 3 × 3 × 3 = 27), depending on the coil geometry and the number of independent channels. Implementing a partial-Fourier acquisition in one dimension to exploit conjugate symmetry provides an additional R ≈ 2, bringing us to a combined undersampling factor of 8 × 2 × 2 = 32. These acceleration methods alone would reduce scan time to 17 min. Incorporating other acceleration mechanisms such as tailoring the imaging field-of-view (FOV), variable density sampling (28), and/or compressed sensing (29) could further improve acceleration.
Finally, SR-FPE has two important advantages for achieving high acceleration factors. First, it can acquire a large number of independent ADC samples at each k-space point to significantly increase the SNR. This is necessary to compensate for the SNR penalty from aggressive scan time acceleration factors. Second, each k-space point can be sampled independently. This provides a great deal of flexibility to acquire data with an optimal sampling strategy, so long as the relaxation that occurs during the extended echo train is managed appropriately to avoid unfavorable signal intensity modulation in k-space.
METHODS
Gadolinium Dipole Phantom
A table tennis ball filled with a 65 mM solution of gadobenate dimeglumine was suspended by sewing thread in a bath of undoped water. This phantom was scanned at 1.5 T (Signa HDxt, GE Healthcare, Waukesha, WI) using a single channel transmit/receive (T/R) head coil. MR acquisition parameters included: FOV = 17.4 × 17.4 × 17.4 cm3, matrix = 124 × 124 × 124, ADC samples = 128, receiver BW = ±7.81 kHz (for spectral resolution of 122 Hz), TR = 2.2 s, ETL = 124, echo spacing = 10 ms, TEeff = 620 ms, linear k-space encoding, 156 μs RF pulses, with scan time of 9 h, 24 min. For comparison, a conventional 3D-FSE (with readout gradients) was performed with matrix = 128 × 128 × 128, 248 μs RF pulses, and all other imaging parameters the same with a scan time of 4.5 min. Note that rectangular RF pulses were used for all experiments.
Using SR-FPE data, signal from the 128 temporal ADC samples was modeled using Eq. [2] to estimate ρ(r), Ψ(r), and on a voxel-by-voxel basis for a single species (water). Parameter estimation was accomplished using a nonlinear least squares curve-fitting algorithm (lsqnonlin, Matlab, Mathworks Inc, Natick, MA). A Fourier transformation was also applied to the ADC samples, yielding 3D data at 128 frequency bins. Selected spectral bins were color-coded in three dimensions and combined using Mimics (Materialise, Leuven, Belgium) to provide a volume-rendered surface-shaded view of the dipole, including cut planes to show the various layers of the separated frequency bins.
Hip Prosthesis Phantom
A phantom that contained the femoral component of a titanium hip prosthesis (Alliance X-Series, Integral Porous Primary Hip System, Biomet Orthopedics, Inc., Warsaw, IN) was constructed by suspending the prosthesis in a water bath using sewing thread. This phantom was scanned using the proposed SR-FPE sequence on a clinical 1.5 T scanner (Signa HDxt v16.0 GE Healthcare, Waukesha, WI) using a single channel T/R quadrature head coil. The longest dimension of the phantom was placed parallel to the B0 field to simulate its typical orientation when implanted in a patient.
For one scan, a plastic grid was placed around the implant for purposes of examining distortion. Acquisition parameters for this first scan included: FOV = 23 × 11.5 × 4.8 cm3, matrix = 240 × 120 × 24, ADC samples = 48, receiver BW = ±7.81 kHz (for spectral resolution of 325 Hz), TR = 1.0 s, ETL = 24, echo spacing = 5.9 ms, TEeff = 71 ms, linear k-space encoding, 80 μs RF pulses, and total scan time of 8 h. For comparison, a conventional 3D-FSE was also acquired with a matrix = 256 × 128 × 24, 248 μs RF pulses, receiver BW = ±31.25 kHz, TEeff = 34ms, and scan time = 1:41 min. To examine the ability of SR-FPE to avoid distortion, a single ADC sample from the center of the echo (which will be referred to as the DC image) was reconstructed and compared to the 3D-FSE image.
For improved visualization of spectral decomposition, the grid was removed and a second SR-FPE scan was performed with adjustments to only the following scan parameters: FOV = 24 × 12 × 4.8 cm3, matrix = 120 × 60 × 24, echo spacing = 4.8 ms, TEeff = 58 ms, scan time = 2 h. For comparison, a conventional 3D-FSE was also acquired with imaging parameters similar to SR-FPE except for the following: matrix = 128 × 64 × 24, 248 μs RF pulses, receiver BW = ±31.25 kHz, TEeff = 21 ms and scan time = 51 s. Spectral decomposition of the SR-FPE data was performed using spectral modeling to generate a water signal image (ρw), the B0 field map (Ψ), and the maps around the hip prosthesis. A FT was also performed on the temporal data to display signal resonating at select frequency bins.
Feasibility for Acceleration using a 16-Channel Coil
The feasibility of scan time reduction through Cartesian parallel imaging in all three spatial dimensions, corner-cutting and half-Fourier acquisition was investigated by acquiring fully sampled data in the hip prosthesis phantom. Scanning was performed using a 16-channel wrap array coil (NeoCoil, Pewaukee, WI) on a clinical 1.5 T scanner (Optima MR450w, GE Healthcare, Waukesha, WI). The coil elements in the array were arranged in three rows of 5, 6, and 5 coil elements, respectively. The 16-channel coil is a receive-only coil. For this reason, it was necessary to use the body coil for RF transmission, unlike the previous scans that used the head coil to transmit short RF pulses. The use of the body coil for RF transmission required an increase in the RF pulse width to 248 μs, to maintain the flip angles needed to perform extended echo train FSE imaging. This reduced the excitation bandwidth and limited our ability to excite all off-resonance spins. However, it did not affect the primary purpose of the scan—acquisition of a fully sampled, multichannel data set to serve as the ground truth while examining potential for scan time reduction.
The prosthesis with the plastic grid was used for this experiment. MR scan parameters included: FOV=24 × 12 × 10 cm3, matrix = 240 × 120 × 50, ADC samples = 16, receiver BW = ±2.5 kHz (spectral resolution of 313 Hz), TR = 1.2 s, ETL = 120, echo spacing = 6.5 ms, TEeff = 390 ms, linear k-space encoding, 248 μs RF pulses, with scan time of 4 h.
Fully sampled kx/ky/kz data were retrospectively undersampled using 3D ellipsoid corner cutting (x2/120 + y2/60 + z2/25 > 1) and parallel imaging in all three phase-encoding directions (Rx × Ry × Rz = 3 × 2 × 2). Prospectively undersampling in this manner would lead to an effective scan time (scaneff) of 12 min. A 3D-GRAPPA (30) reconstruction was performed for each ADC sample using a cubic auto-calibration region of 25 × 25 × 25 and a kernel size of 7 × 5 × 5. For both the fully sampled and undersampled data, spectral modeling was performed to estimate the water signal, B0 field inhomogeneity, and for each voxel. Error images, calculated by subtracting the fully sampled and under-sampled images, were multiplied by 5 to enhance differences.
In a separate test, 52% half-Fourier was applied in the longest dimension in addition to the corner-cutting and parallel imaging described above. Half-Fourier reconstruction assumes smoothly varying phase across the object. When imaging near metal, that assumption is only true near the center of the spin echo so this test was performed for the central ADC sample (DC image) alone. This approach, which would reduce the scaneff to 7.5 min, did not use the spectral data. POCS (31) was performed following GRAPPA to reconstruct full-resolution images. The constrained reconstruction for this DC image was then compared to the fully sampled DC image for a central coronal slice. An error image was also generated and multiplied by 5 to evaluate for errors introduced by undersampling.
Water/Acetone/Oil Phantom
To test the ability of SR-FPE to perform spectral decomposition of multiple chemical species, a phantom comprised of water, acetone and peanut oil was constructed. Acetone has a chemical shift of −166 Hz relative to water at 1.5 T (32), whereas the triglycerides have multiple spectral peaks with the main methylene peak centered at −217 Hz at 1.5 T (33). Water, acetone and peanut oil were poured into separate 20 mL glass cylindrical vials and scanned side-by-side with the same 1.5 T scanner, using a transmit/receive quadrature head coil. The vials were oriented parallel to the B0 field. Scanning parameters were the following: FOV = 12 × 12 × 5.4 cm3, matrix = 64 × 64 × 18, ADC samples = 128, receiver BW = ±7.81 kHz (for spectral resolution of 122 Hz), TR = 1.0 s, ETL = 64, echo spacing = 10 ms, TEeff = 320 ms, linear k-space encoding, 248 μs RF pulses, with scan time 19 min, 12 s.
Reconstruction of the separated species images was performed using spectral modeling according to Reeder et al (34). A precalibrated spectral model of fat was used to include the multipeak effects of the complex fat spectrum (24). A DC image reconstructed from the central ADC sample displays the water, acetone, and oil together. After spectral separation using Eq. [1], separated water signal (ρw), acetone signal (ρa), and oil signal (ρo) images were generated.
Signal to Noise Analysis
The spectral data acquired with SR-FPE enables a significant increase in the SNR when generating signal intensity images through signal modeling. To measure the SNR increase experimentally, two sequential SR-FPE scans were performed using a gel phantom made out of water, agar, sodium chloride, sodium benzoate, and copper sulfate. Scan parameters were as follows: FOV = 6 × 3.6 × 3 cm3, matrix = 32 × 18 × 16, ADC samples = 48, receiver BW = ±7.81 kHz (for spectral resolution of 313 Hz), TR = 1.0 s, ETL = 18, echo spacing = 5 ms, TEeff = 45 ms, linear k-space encoding, 248 μs RF pulses, with scan time 8 min, 32 s.
Using the same slice from sequential scans, SNR was calculated and compared for 1) the DC image and 2) the water signal image (ρw). The water signal map was determined both with and without included in the signal model. An ROI of 291 pixels was placed within the gel phantom and SNR was calculated using a difference method (35):
| [3] |
where S1 and S2 represent all the pixel values within the ROI for scan 1 and scan 2, respectively. The increase in SNR is reported (SNRgain = SNRρ/SNRDC) [4]. The effective number of signal averages (NSA) was also measured by comparing the variance in ρw to the variance in the DC image (NSA = σ2DC/σ2ρ) [5]. With N = number of ADC samples, the theoretical without estimation and with estimation (24,25,36).
RESULTS
Figure 2 compares conventional 3D-FSE with SR-FPE for a central coronal slice of the gadolinium dipole phantom. Note the lack of distortion using SR-FPE in comparison to the conventional 3D-FSE acquisition that demonstrated the typical “acorn” distortion pattern in the frequency-encoding direction. A distortion-free DC image is displayed as well as the estimated water signal image (ρw) and field inhomogeneity (Ψ) map. The field inhomogeneity map clearly shows the expected dipole behavior of a sphere (Fig. 2d) as do selected spectral bins (244, 122, 244, 488, and 732 Hz) obtained via FT (Fig. 3). Because this was a 3D spectral acquisition, the 3D dipole spectrum of the sphere is best depicted in three dimensions as shown in Figure 3b. As the values were very low, maps were not displayed for this case. Postprocessing of this particular raw data, the largest in this study, took a total of 3 min in Matlab to read and reconstruct image volumes for all temporal ADC samples. As for the spectral analysis, the time to generate spectral images via the FT through the temporal dimension was negligable. Signal modeling took the most time. Voxel-by-voxel parameter estimation for the entire image volume completed in 108 min using Matlab’s parallel computing toolbox and eight processors (2.3 GHz AMD Opteron Processor 8356, 33 GB of shared RAM).
FIG. 2.

Imaging the gadolinium dipole phantom with SR-FPE avoids distortion artifacts and permits spectral data collection. A conventional 3D-FSE image demonstrated distortion along the frequency-encoding direction (up/down) (a) as shown for a central coronal slice. SR-FPE was distortion-free as demonstrated by the DC image (b), and also allowed estimation of the water signal (ρw), the B0 field map (Ψ), and on a voxel-by-voxel basis (c and d). Because the values were very low, maps were not displayed for this case. Although the DC and water signal images appear to be the same, the water signal image has much higher SNR due to effective averaging of all the ADC samples.
FIG. 3.

SR-FPE is capable of excellent spectral separation as demonstrated in the gadolinium dipole phantom. In this figure, the FT was used to decompose the temporal ADC data into unique frequency bins. Five frequency bins (−244, −122, +244, +488, and +732 Hz) are displayed for a central slice (a). For better 3D visualization of the dipole, these same frequency bins were color coded using a 3D volume-rendered surface shading after combination (b). Cut planes are used to show the inner structure of the dipole and the separation of different frequency bins. White = −244 Hz, green = −122 Hz, red = +244 Hz, blue = +488 Hz, and yellow = +732 Hz.
Figure 4 demonstrates spatial distortion of the grid lines near the hip prosthesis in the 3D-FSE scan. In contrast, SR-FPE showed no distortion of the grid near the metal. The greater degree of signal dropout in the 3D-FSE image was largely a result of the lower RF excitation bandwidth.
FIG. 4.
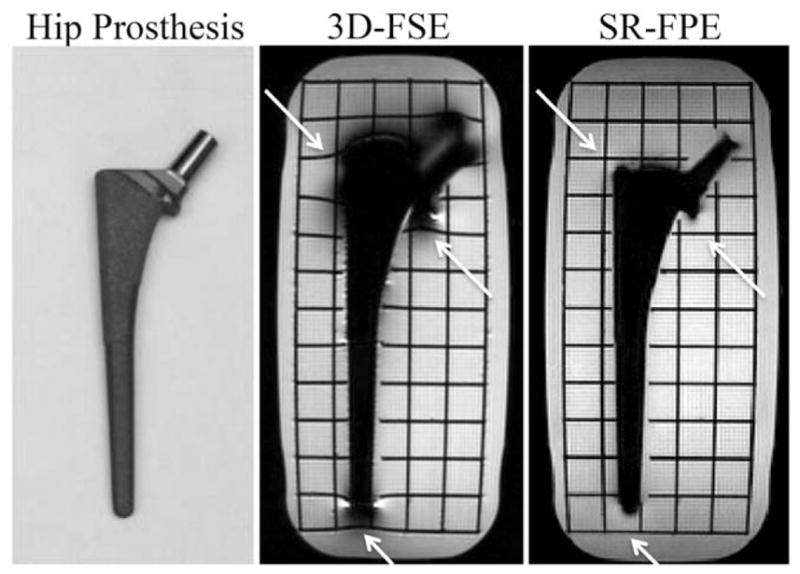
A titanium hip prosthesis and the surrounding grid were well-depicted with SR-FPE, while 3D-FSE images demonstrated susceptibility-related spatial distortion artifacts (white arrows). Minimal warping is noticeable because manufacturer gradient nonlinearity corrections were not applied. The 3D-FSE image also demonstrated signal loss due to a narrower RF excitation bandwidth.
Images depicting the hip prosthesis without the grid are displayed in Figure 5 for both 3D-FSE and SR-FPE (5a). Using the SR-FPE DC image alone provided distortion-free images of the prosthesis silhouette, but incorporating all the spectral samples into the signal model yielded excellent, distortion-free water images (ρw), B0 field maps (Ψ), and maps. B0 field inhomogeneities ranged from −2000 to +2000 Hz and the apparent values measured in areas of extreme off-resonance were around 1000 s−1. Note that the water signal image demonstrated a mild enhancement artifact near the superior and inferior segments of the prosthesis, which was not observed in the DC image. The spectral model (Eq. [2]) did not fully capture the signal dynamics for these pixels. Spectral images were also produced by a simple FT in the temporal sampling dimension and are shown for selected frequency bins (−1300, −650, −325, 0, +325, +975, +1950 Hz) to demonstrate the ability of SR-FPE to perform spectral decomposition of off-resonance signals (Fig. 5b).
FIG. 5.

Modeling the spectral data using Eq. [2] produced excellent water signal (ρw), B0 field (Ψ), and maps of the hip prosthesis phantom which are displayed next to the DC and 3D-FSE images (a). Spectral images, produced by a simple FT through the time dimension, are also shown for seven selected frequency bins (−1300, −650, −325, 0, +325, +975, +1950 Hz) (b).
Acceleration results using retrospective corner cutting and parallel imaging were very comparable to the fully sampled images (Fig. 6). Minimal artifacts were observed in the Error × 5 images for the water signal and B0 field maps. Increased error is noticeable for the accelerated map, although both the fully sampled and under-sampled maps demonstrated markedly higher values in areas of extreme off-resonance. This indicates that a 4 h scan could effectively be reduced to 12 min while preserving spectral information, and maintaining excellent qualitative SNR performance.
FIG. 6.

Retrospectively undersampling all ADC samples using ellipsoid corner-cutting and GRAPPA (Rx × Ry × Rz = 3 × 2 × 2) produced spectral modeling results comparable to the fully sampled data with an effective scan time of 12 min. The error images have been multiplied by 5 to accentuate differences. The map shows the greatest error from undersampling in regions with rapid changing of B0. Because the body coil (instead of the single channel T/R head coil) was used for RF transmission, longer RF pulses (and hence lower bandwidth) were used to achieve flip angles of 120−. Although this prevented the ability to excite all off-resonance spins, it did not affect the primary purpose of the scan—acquiring a fully sampled, 16-channel data set to serve as the ground truth while examining potential for scan time reduction.
Retrospective acceleration results for the DC image alone with corner-cutting, parallel imaging, and 52% partial-Fourier (Fig. 7a) accurately depicted structures in the phantom (Fig. 7b). This provides an effective acceleration that would reduce the 4 h acquisition to a 7:30 min scan, providing a distortion-free DC image. However, minor acceleration artifacts are noticeable 1) near the head of the prosthesis due to off-resonance and 2) at the very top and bottom of the phantom that had lower SNR. Lower signal at the top and bottom is likely due to the sensitivity region of this particular 16-channel coil and/or the limited RF excitation by the body coil.
FIG. 7.

Retrospective acceleration results for the central ADC sample alone using ellipsoid corner-cutting, GRAPPA (Rx × Ry × Rz = 3 × 2 × 2), and 52% partial-Fourier with POCS successfully depicted the structures throughout the image, which would reduce the effective scan time from 4 h to 7.5 min. Minor acceleration artifacts are noticeable 1) near the head of the prosthesis due to off-resonance and 2) the very top and bottom of the phantom with markedly lower SNR. The latter is due to the sensitivity region of this particular 16-channel coil and/or the limited RF excitation from the body coil. The minimal warping evident on the right side of the image occurred because the manufacturer gradient nonlinearity corrections were not applied.
Figure 8 demonstrates the ability of SR-FPE to perform spectral decomposition of multiple species. The DC image displays the water, acetone, and oil, which were simultaneously in phase at the echo (Fig. 8a). Spectral modeling (34) successfully generated separate species images for water, fat and acetone, which are displayed in Figure 8b–d.
FIG. 8.

Liquid acetone, water, and peanut oil were scanned to demonstrate chemical species separation using SR-FPE. All species were visible after reconstructing the DC image from the central ADC sample (a). The signal model described in Eq. [1] was used to separate the chemical species, producing ρwater, ρacetone, and ρoil images displayed in (b), (c), and (d) respectively.
The SNR analysis that compared performance of a single ADC sample versus all 48 samples yielded an SNR gain of 5.8× (theoretical = 6.9×) and NSA was 34.6 (theoretical = 48) when was excluded from the signal model. When was included, the SNR gain was 3.3× (theoretical = 3.5×) and NSA was 11.1 (theoretical = 12).
DISCUSSION
This work demonstrates the feasibility of a SR-FPE 3D-FSE method for simultaneous spectral decomposition and distortion-free imaging in areas of severe off-resonance. Although it has long been known that phase-encoding all dimensions allows distortion-free imaging and/or spectral decomposition (37), to our knowledge, SR-FPE is the first to utilize a 3D FSE acquisition with simultaneous spectral encoding. Modeling the spectral data can produce distortion-free images depicting the water signal (ρw), B0 field inhomogeneity (Ψ), and . The method can also be used to separate chemical species, either through use of the FT or through spectral modeling decomposition methods as demonstrated in the water/acetone/oil phantom. Finally, we have also demonstrated the feasibility of combined acceleration methods that can reduce the overall scan time to within clinically feasible scan times. To the best of our knowledge, this is the first implementation of parallel imaging acceleration in three dimensions using a Cartesian data set.
SR-FPE may prove useful in a number of applications. The ability to acquire spectral data and quantify very high values with this technique could potentially be used for tracking super paramagnetic iron oxide labeled cells or antibodies. The spectral information provides a positive contrast mechanism directly related to concentration, and the simultaneous estimation of could help determine whether the super paramagnetic iron oxides are intracellular or extracellular (38). Perfect alignment exists between the species signal image, B0 field map, and maps because each parameter is estimated from the same acquisition. This technique may also be useful for 3D spectroscopic imaging of a limited number of species within a sparse spectrum with much higher spatial resolution than current methods. Because frequency-encoding is not used, chemical shift artifacts are prevented.
The most obvious application of SR-FPE is imaging near metallic implants. Distortion artifacts associated with frequency-encoded methods, such as MAVRIC and SEMAC, can be completely avoided. Spectral data available with SR-FPE may also prove useful for diagnosing pathology associated with metallic prostheses. For example, by distinguishing phase changes of nearby spins, spectroscopic imaging may help detect particulate matter generated through microabrasion and microadhesion processes (22). Early diagnosis of this common problem could aid in preventing substantial resorption of peri-prosthetic bone. Another current limitation of MAVRIC/SEMAC related methods is their inability to separate fat and water. SR-FPE has sufficient spectral resolution for fat/water separation, and the rapid ADC sampling rate could help to correctly estimate the B0 field map near metal, which is critical for fat/water separation. Future work will explore the potential of fat/water imaging near metal using chemical species separation with SR-FPE.
One challenge of all MR methods attempting to image near metal, including SR-FPE, MAVRIC, and SEMAC is the need to excite spins over a wide range of frequencies. MAVRIC addressed this challenge by performing multiple 3D acquisitions at different RF offsets and summing the resulting images across acquisitions. This increases scan time, although simply interleaving multiple RF offsets within the same TR allows acquisition of some RF bins without any scan time penalty. SR-FPE will likely require acquisitions at multiple RF offsets as well to image most metallic implants in vivo. Cobalt-chromium and stainless steel are commonly used in implants and induce more severe B0 field inhomogeneities than titanium. One advantage of SR-FPE, which may reduce the number of required RF bins, is the ability to better match the RF and receiver bandwidths. MAVRIC pairs a large receiver bandwidth (e.g., ±125 kHz) with a relatively narrow (e.g., ±2.25 kHz) RF excitation pulse to reduce distortion artifacts in the readout direction. SR-FPE, however, could pair an RF pulse much broader than ±2 kHz with a receiver bandwidth much smaller than ±125 kHz, reducing the number of RF bins needed for imaging near a metal implant, and also increasing the SNR performance of the acquisition
MAVRIC/SEMAC methods, including the recent hybrid method (10), remain fundamentally limited in areas directly adjacent to metal, where the local B0 gradient frequently exceeds the readout gradient. When frequency-encoding, signal loss and signal pile-up artifacts are unavoidable in these regions (15). Our proposed technique could potentially be used in combination with MAVRIC/SEMAC methods. By interleaving RF offsets within the same acquisition, SR-FPE could be utilized for a few of the RF bins at extreme off-resonance, where the spatial extent of the signal is limited to a small FOV. This hybrid approach may be sufficient to overcome the frequency-encoding related artifacts observed with MAV-RIC/SEMAC near metal.
In certain areas near the hip prosthesis, the signal dynamics for some voxels were not fully represented by Eq. [2] which led to a mild enhancement artifact in the water signal image. These particular voxels yielded their highest signal intensity at the beginning and end of sampling, instead of at the center of the echo. The cause of this phenomenon is not yet understood. It may be caused by nonlinear B0 gradients through the voxel, or RF induced eddy-currents compromising the Carr, Purcell, Meiboom, Gill conditions (39,40). Further investigation will be necessary to identify the root cause, but improved parameter estimation may be possible by accounting for macroscopic B0 gradients within these voxels (41).
There are several limitations to this study including the lack of comparison with MAVRIC/SEMAC methods, which are not commercially available at this time. This study required long scan times for fully sampled data that could only be performed in phantoms. This approach was necessary to demonstrate both feasibility and to ensure availability of the ground truth to assess scan time reduction methods. Translation to in vivo imaging will require methods that mitigate phase aliasing when imaging FOVs that do not encompass all excited signal. Slab selection could be incorporated in one dimension, and for certain body parts, such as the knee, aliasing would be naturally limited by coil sensitivity. Phase-encoded dimensions can also suffer from artifacts due to incoherent motion and blood flow when scanning in vivo. These artifacts, which vary depending on anatomy, will manifest in all three dimensions for SR-FPE, although this might simply disperse the artifacts more sparsely. First moment artifacts caused by moving spins should be significantly reduced because this technique does not use readout gradients. The largest remaining challenge is the scan time, but preliminary acceleration results using retrospective undersampling are very encouraging. Utilizing parallel imaging in three dimensions facilitated effective scan times between 7.5 and 12 min, comparable to current clinical acquisitions using the MAVRIC/SEMAC hybrid method (10).
Future work will focus on prospective acquisition of accelerated data in vivo and reducing scan time further while preserving the rapidly changing signal dynamics across the echo. Other complementary acceleration methods, such as variable density sampling (28), compressed sensing (29), and increasing the number of receiver channels will be explored. An important advantage of the SR-FPE method is that all k-space points can be sampled independently. This confers a great deal of flexibility in the 3D k-space sampling pattern. This may facilitate optimal sampling schemes and constrained reconstruction methods that maximize the performance of acceleration strategies.
In summary, this work demonstrates the feasibility of a SR-FPE 3D-FSE technique. The method eliminates frequency-encoding and utilizes spectral data to produce distortion-free images, including B0 field maps and maps in areas with extreme off-resonance, such as near metal. It can also be used for chemical species separation, which may allow for high spatial resolution spectroscopic imaging and potentially fat–water separation near metal.
Acknowledgments
Grant sponsor: NIH; Grant number: R01 DK083380, R01 DK088925, R01 DK096169, RC1 EB010384, T32 CA009206, and R01NS065034; Grant sponsor: WARF Accelerator Program; Research support: GE Healthcare.
The authors gratefully acknowledge Drs. Kevin Johnson and Matthew Smith for helpful discussions, and Dr. Michael Lamson who provided the hip prosthesis.
References
- 1.Cram P, Lu X, Kates SL, et al. Total knee arthroplasty volume, utilization, and outcomes among Medicare beneficiaries, 1991–2010. JAMA. 2012;308:1227–1236. doi: 10.1001/2012.jama.11153. [DOI] [PMC free article] [PubMed] [Google Scholar]
- 2.Kurtz S, Mowat F, Ong K, et al. Prevalence of primary and revision total hip and knee arthroplasty in the United States from 1990 through 2002. J Bone Joint Surg Am. 2005;87:1487–1497. doi: 10.2106/JBJS.D.02441. [DOI] [PubMed] [Google Scholar]
- 3.Kurtz S, Ong K, Lau E, et al. Projections of primary and revision hip and knee arthroplasty in the United States from 2005 to 2030. J Bone Joint Surg Am. 2007;89:780–705. doi: 10.2106/JBJS.F.00222. [DOI] [PubMed] [Google Scholar]
- 4.Graves SE. What is happening with hip replacement? Med J Aust. 2011;194:620–621. doi: 10.5694/j.1326-5377.2011.tb03141.x. [DOI] [PubMed] [Google Scholar]
- 5.Harris WH. The problem is osteolysis. Clin Orthop Relat Res. 1995;311:46–53. [PubMed] [Google Scholar]
- 6.Hayter CL, Koff MF, Potter HG. Magnetic resonance imaging of the postoperative hip. J Magn Reson Imaging. 2012;35:1013–1025. doi: 10.1002/jmri.23523. [DOI] [PubMed] [Google Scholar]
- 7.Koch KM, Hargreaves BA, Pauly KB, et al. Magnetic resonance imaging near metal implants. J Magn Reson Imaging. 2010;32:773–787. doi: 10.1002/jmri.22313. [DOI] [PubMed] [Google Scholar]
- 8.Koch KM, Lorbiecki JE, Hinks RS, et al. A multispectral three-dimensional acquisition technique for imaging near metal implants. Magn Reson Med. 2009;61:381–390. doi: 10.1002/mrm.21856. [DOI] [PubMed] [Google Scholar]
- 9.Lu W, Pauly KB, Gold GE, et al. SEMAC: slice encoding for metal artifact correction in MRI. Magn Reson Med. 2009;62:66–76. doi: 10.1002/mrm.21967. [DOI] [PMC free article] [PubMed] [Google Scholar]
- 10.Koch KM, Brau AC, Chen W, et al. Imaging near metal with a MAV-RIC-SEMAC hybrid. Magn Reson Med. 2011;65:71–82. doi: 10.1002/mrm.22523. [DOI] [PubMed] [Google Scholar]
- 11.Hayter CL, Koff MF, Shah P, et al. MRI after arthroplasty: comparison of MAVRIC and conventional fast spin-echo techniques. AJR Am J Roentgenol. 2011;197:W405–W411. doi: 10.2214/AJR.11.6659. [DOI] [PubMed] [Google Scholar]
- 12.Koff MF, Koch KM, Potter HG. Magnetic resonance imaging of peri-prosthetic tissues in the presence of joint arthroplasty. Proceedings of the 18th Annual Meeting of the ISMRM; Stockholm, Sweden. 2010; p. 131. [Google Scholar]
- 13.Butts K, Pauly JM, Daniel BL, et al. Management of biopsy needle artifacts: techniques for RF-refocused MRI. J Magn Reson Imaging. 1999;9:586–595. doi: 10.1002/(sici)1522-2586(199904)9:4<586::aid-jmri13>3.0.co;2-x. [DOI] [PubMed] [Google Scholar]
- 14.Chang H, Fitzpatrick JM. A technique for accurate magnetic resonance imaging in the presence of field inhomogeneities. IEEE Trans Med Imaging. 1992;11:319–329. doi: 10.1109/42.158935. [DOI] [PubMed] [Google Scholar]
- 15.Koch KM, King KF, Chen W, et al. Frequency encoding in the presence of extreme static field gradients. Proceedings of the 19th Annual Meeting of the ISMRM; Montreal, Canada. 2011; p. 293. [Google Scholar]
- 16.Balcom BJ, Macgregor RP, Beyea SD, et al. Single-point ramped imaging with T1 enhancement (SPRITE) J Magn Reson A. 1996;123:131–134. doi: 10.1006/jmra.1996.0225. [DOI] [PubMed] [Google Scholar]
- 17.Grodzki DM, Jakob PM, Heismann B. Ultrashort echo time imaging using pointwise encoding time reduction with radial acquisition (PETRA) Magn Reson Med. 2012;67:510–518. doi: 10.1002/mrm.23017. [DOI] [PubMed] [Google Scholar]
- 18.Han H, Green D, Ouellette M, et al. Non-Cartesian sampled centric scan SPRITE imaging with magnetic field gradient and B0(t) field measurements for MRI in the vicinity of metal structures. J Magn Reson. 2010;206:97–104. doi: 10.1016/j.jmr.2010.06.012. [DOI] [PubMed] [Google Scholar]
- 19.Schoenberg SO, Dietrich O, Reiser MF. Parallel imaging in clinical MR applications. Germany: Springer; 2007. pp. 181–441. [Google Scholar]
- 20.Busse RF, Hariharan H, Vu A, et al. Fast spin echo sequences with very long echo trains: design of variable refocusing flip angle schedules and generation of clinical T2 contrast. Magn Reson Med. 2006;55:1030–1037. doi: 10.1002/mrm.20863. [DOI] [PubMed] [Google Scholar]
- 21.Mugler JP, Kiefer B, Brookeman JR. Three-dimensional T2-weighted imaging of the brain using very long spin-echo trains. Proceedings of the 8th Annual Meeting of the ISMRM; Denver, CO, USA. 2000; p. 687. [Google Scholar]
- 22.Koch KM, Koff MF, Chen W, et al. Extracting Phase Contrast from MAVRIC Images Near Metal Implants. Proceedings of the 20th Annual Meeting of the ISMRM; Melbourne, Australia. 2012; p. 222. [Google Scholar]
- 23.Bydder M, Yokoo T, Hamilton G, et al. Relaxation effects in the quantification of fat using gradient echo imaging. Magn Reson Imaging. 2008;26:347–359. doi: 10.1016/j.mri.2007.08.012. [DOI] [PMC free article] [PubMed] [Google Scholar]
- 24.Yu H, Shimakawa A, McKenzie CA, et al. Multiecho water-fat separation and simultaneous estimation with multifrequency fat spectrum modeling. Magn Reson Med. 2008;60:1122–1134. doi: 10.1002/mrm.21737. [DOI] [PMC free article] [PubMed] [Google Scholar]
- 25.Hernando D, Liang ZP, Kellman P. Chemical shift-based water/fat separation: a comparison of signal models. Magn Reson Med. 2010;64:811–822. doi: 10.1002/mrm.22455. [DOI] [PMC free article] [PubMed] [Google Scholar]
- 26.Vanhamme L, Sundin T, Hecke PV, et al. MR spectroscopy quantitation: a review of time-domain methods. NMR Biomed. 2001;14:233–246. doi: 10.1002/nbm.695. [DOI] [PubMed] [Google Scholar]
- 27.Bernstein MA, Fain SB, Riederer SJ. Effect of windowing and zero-filled reconstruction of MRI data on spatial resolution and acquisition strategy. J Magn Reson Imaging. 2001;14:270–280. doi: 10.1002/jmri.1183. [DOI] [PubMed] [Google Scholar]
- 28.Tsai CM, Nishimura DG. Reduced aliasing artifacts using variable-density k-space sampling trajectories. Magn Reson Med. 2000;43:452–458. doi: 10.1002/(sici)1522-2594(200003)43:3<452::aid-mrm18>3.0.co;2-b. [DOI] [PubMed] [Google Scholar]
- 29.Lustig M, Donoho D, Pauly JM. Sparse MRI: the application of compressed sensing for rapid MR imaging. Magn Reson Med. 2007;58:1182–1195. doi: 10.1002/mrm.21391. [DOI] [PubMed] [Google Scholar]
- 30.Griswold MA, Jakob PM, Heidemann RM, et al. Generalized autocalibrating partially parallel acquisitions (GRAPPA) Magn Reson Med. 2002;47:1202–1210. doi: 10.1002/mrm.10171. [DOI] [PubMed] [Google Scholar]
- 31.Samsonov AA, Kholmovski EG, Parker DL, et al. POCSENSE: POCS-based reconstruction for sensitivity encoded magnetic resonance imaging. Magn Reson Med. 2004;52:1397–1406. doi: 10.1002/mrm.20285. [DOI] [PubMed] [Google Scholar]
- 32.Haynes WM, Bruno TJ, Lide DR, editors. CRC handbook of chemistry and physics. Cleveland, OH: CRC Press; 2012. p. 49. Section 8. [Google Scholar]
- 33.Hamilton G, Yokoo T, Bydder M, et al. In vivo characterization of the liver fat (1)H MR spectrum. NMR Biomed. 2011;24:784–790. doi: 10.1002/nbm.1622. [DOI] [PMC free article] [PubMed] [Google Scholar]
- 34.Reeder SB, Pineda AR, Wen Z, et al. Iterative decomposition of water and fat with echo asymmetry and least-squares estimation (IDEAL): application with fast spin-echo imaging. Magn Reson Med. 2005;54:636–644. doi: 10.1002/mrm.20624. [DOI] [PubMed] [Google Scholar]
- 35.Reeder SB, Wintersperger BJ, Dietrich O, et al. Practical approaches to the evaluation of signal-to-noise ratio performance with parallel imaging: application with cardiac imaging and a 32-channel cardiac coil. Magn Reson Med. 2005;54:748–754. doi: 10.1002/mrm.20636. [DOI] [PubMed] [Google Scholar]
- 36.Pineda AR, Reeder SB, Wen Z, et al. Cramer-Rao bounds for three-point decomposition of water and fat. Magn Reson Med. 2005;54:625–635. doi: 10.1002/mrm.20623. [DOI] [PubMed] [Google Scholar]
- 37.Brown TR, Kincaid BM, Ugurbil K. NMR chemical shift imaging in three dimensions. Proc Natl Acad Sci USA. 1982;79:3523–3526. doi: 10.1073/pnas.79.11.3523. [DOI] [PMC free article] [PubMed] [Google Scholar]
- 38.Kuhlpeter R, Dahnke H, Matuszewski L, et al. R2 and mapping for sensing cell-bound superparamagnetic nanoparticles: in vitro and murine in vivo testing. Radiology. 2007;245:449–457. doi: 10.1148/radiol.2451061345. [DOI] [PubMed] [Google Scholar]
- 39.Carr HY, Purcell EM. Effects of diffusion on free precession in nuclear magnetic resonance experiments. Phys Rev Lett. 1954;94:630–638. [Google Scholar]
- 40.Meiboom S, Gill D. Modified spin-echo method for measuring nuclear relaxation times. Rev Sci Instrum. 1958;29:688–691. [Google Scholar]
- 41.Hernando D, Vigen KK, Shimakawa A, et al. R 2* mapping in the presence of macroscopic B(0) field variations. Magn Reson Med. 2012;68:830–840. doi: 10.1002/mrm.23306. [DOI] [PMC free article] [PubMed] [Google Scholar]