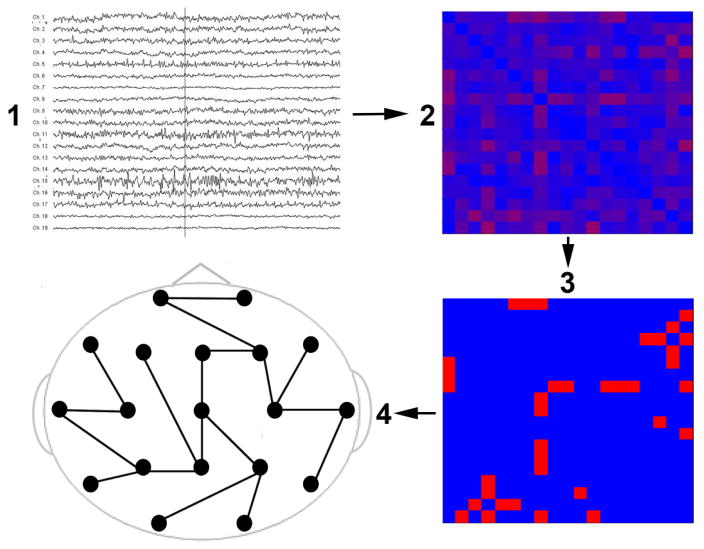
Figure 1.
MST calculation pipeline. Step 1 shows the preprocessed EEG. In step 2, a functional connectivity matrix was calculated using the phase-lag index (PLI) for each pair of electrodes. In step 3, the minimum spanning tree (MST) was constructed from the functional connectivity matrix by including the strongest connections while avoiding loops. All the connections in the MST are set to 1 while all other connections are set to 0. As such, the MST is a structure that is considered to reflect the backbone of the functional connectivity network. Step 4 shows an example of a MST.

