

Abstract
Objectives
To describe caregiver-reported QOL in youth with DS and to examine the role of obesity on QOL.
Study design
Caregivers of youth with and without DS aged 10 through 20 years completed questionnaires examining QOL (PedsQL) and weight-related QOL (Impact of Weight on Quality of Life-Kids: IWQOL-Kids). Age- and sex-specific Z-scores were generated for body mass index (BMI). Obesity was defined as a BMI≥95th percentile for age and sex.
Results
Caregiver-reported Total QOL, Physical Health, and Psychosocial Health summary scores were all lower in the DS group compared with the non-DS controls (p<0.001). Social and School Functioning were also lower (p<0.001), but Emotional Functioning did not differ between DS and non-DS groups (p=0.31). Physical Functioning (p=0.003) and Total scores (p=0.03) differed between obese and non-obese non-DS youth, but no differences were reported between obese and non-obese youth with DS. On the IWQOL-Kids, caregivers of youth with DS reported higher Body Esteem (p=0.020) and Social Life scores (p=0.03) than caregivers of non-DS youth. Caregivers of youth with obesity, regardless of DS status, reported significantly lower weight-specific QOL scores than caregivers for non-obese youth.
Conclusion
Caregivers reported lower QOL in youth with DS compared with youth without DS with the exception of emotional functioning. Obesity influences most domains of weight-related QOL in youth with and without DS; therefore, providers should address weight concerns in youth with obesity even in the presence of DS.
Keywords: quality of life, youth, Down syndrome, obesity
The World Health Organization (WHO) defines quality of life (QOL) as “individuals’ perceptions of their position in life in the context of the culture and value systems in which they live in relation to goals, expectations, standards, and concerns (1).” Measurements of QOL attempt to quantify a person’s or caregiver’s subjective evaluation of well-being across a variety of domains, each of which comprises the interaction of personal and environmental factors. These domains include physical (eg, health, functional ability to work and/or attend school, and participation in leisure activities), emotional, and social well-being. This conceptual model is applicable to all persons, of all ages, with and without developmental disabilities.
Affecting one in approximately 700 live births (2, 3), Down Syndrome (DS) is 1 of the most common causes of developmental disability in the US. Moreover, with advances in medical management and care, 20-year survival probability of individuals born with DS is 88% (4). Life expectancy for DS has increased significantly from an average age of nine years in 1900 to an estimated median survival of 58 years, with 25% of individuals with DS living to 62 years of age (5, 6). QOL in individuals with DS, however, has received limited attention. Individuals with DS are at higher risk for various medical conditions, including congenital cardiac defects, leukemia, thyroid dysfunction, hearing loss, visual disturbances, and obstructive sleep apnea, all of which if left untreated can adversely affect QOL (7–9). Individuals with DS are also at high risk for neurodevelopmental and behavioral disorders, such as intellectual disability, speech and language disorders, autism spectrum disorder (ASD), and mood and anxiety disorders, which also can affect QOL (10, 11).
Additionally, DS is associated with an increased risk for obesity (7, 12), with an estimated prevalence of 47–48% in adults (13) and 30–50% in children (14–16). Highlighting the potential implications for youth with DS, research in typically developing youth has found QOL among obese children to be lower than non-obese peers (17, 18). The extent to which obesity influences QOL in youth with DS has yet to be established.
The investigation of QOL in youth with DS is essential to support the well-being of the individual throughout their lifespan. The purpose of this study was to examine and describe caregiver-reported QOL in children and adolescents 10–20 years old with DS. Additionally, we examined the role of obesity on QOL in this cohort.
Methods
The data for this secondary analysis of caregiver-reported QOL were derived from a cross-sectional study aimed at examining body composition and cardiometabolic risk (CMR) in youth with DS versus typically-developing youth of comparable age, sex, race, ethnicity, and BMI-Z score. The institutional review boards of both research sites approved all procedures. Parental consent and participant consent or assent, when appropriate, were obtained.
Participants were males and females aged 10–20 years and at least one caregiver. Exclusion criteria included major organ system illness not related to DS (except diabetes mellitus), current or previous oncologic process, cyanotic or unstable congenital heart disease, current pulmonary hypertension, pregnancy, genetic syndrome known to affect glucose tolerance, familial hypercholesterolemia, or current treatment with medications known to affect insulin sensitivity or lipids (other than diabetes agents in known diabetes mellitus). Given the primary aim of the larger study was examining CMR factors in DS, and ASD is more common in DS, children and adolescents with autism spectrum disorder (ASD) were not excluded from the parent study. For this substudy, youth with DS and ASD (N=16) were included, but non-DS participants whose caregiver reported a diagnosis of ASD were excluded (N=2) in order to capture a typically-developing cohort.
Questionnaires and Measures
Caregiver-perception of his/her child’s health-related quality of life (QOL) was assessed utilizing the parent-proxy report of the Pediatric Quality of Life Inventory Version 4.0 (PedsQL™ 4.0). Versions of the PedsQL™ for 8–12 years old (child), 13–18 years old (adolescent), and 18–25 years old (young adult) were used. Caregivers completed the version that corresponded to the chronological age of their child. The instructions ask how much of a problem each item has been during the past one month. A 5-point response scale is used (0 = never a problem; 1 = almost never a problem; 2 = sometimes a problem; 3 = often a problem; 4 = almost always a problem). Items are reverse-scored and linearly transformed to a 0–100 scale (0 = 100, 1 = 75, 2 = 50, 3 = 25, 4 = 0), so that higher scores indicate better QOL. Scale scores are computed as the sum of the items divided by the number of items answered (this accounts for missing data). If more than 50% of the items in the scale are missing, the Scale score is not computed. The Physical Health Summary Score (8 items) is the same as the Physical Functioning Scale. To create the Psychosocial Health Summary Score (15 items), the mean is computed as the sum of the items divided by the number of items answered in the Emotional, Social, and School Functioning Scales(19). The parent-proxy of the PedsQL™ has been used previously with caregivers of children, adolescents, and young adults with intellectual and developmental disabilities and has shown sound psychometric properties (20).
Parent-perception of the effects of weight on his/her child’s quality of life was assessed using a caregiver-proxy version of the Impact of Weight on Quality of Life Kids (IWQOL-Kids) questionnaire. The IWQOL-Kids is a validated 27-item self-report measure of weight-related quality of life for youth ages 11–19. It yields four subscales (Physical Comfort, Body Esteem, Social Life, and Family Relations) and a Total score, which have strong psychometric properties, discriminate among weight status groups, and are responsive to weight change (21, 22). Scaled scores are standardized and range from 0 to 100, with higher scores representing better weight-related QOL.
The Adaptive Behavior Assessment System-Second Edition (ABAS-II) Parent Form (23) is a widely-used caregiver-completed questionnaire to assesses adaptive behavior in individuals aged 5–21 years. Caregivers rate their child’s ability to perform daily tasks correctly when needed. It consists of nine subscales that form a Conceptual composite, a Social composite, and a Practical composite. The Conceptual composite comprises Communication, Self-direction, and Functional Academics subscales--assessing skills such as conversational turns, the ability to work independently, and keeping lists or reminders. The Social composite comprises the Leisure and Social subscales--assessing skills such as waiting turns and listening to others. The Practical composite comprises the Self-Care, Home Living, Health/Safety, and Community Use subscales- -assessing skills such as rules for community safety, maintaining household duties, and finding public restrooms. The ABAS-II also yields a Global composite of overall adaptive functioning, the Global Adaptive Composite (GAC). The ABAS-II has demonstrated high internal consistency (r’s range from 0.85–0.99) and high test–retest reliability (r’s range from 0.80–0.90) (23).
Weight (kilograms) was measured by digital electronic scale (Scaletronix), calibrated daily, and stature (centimeters) was measured on a wall-mounted stadiometer (Holtain) with the participant in light clothing without shoes by trained research anthropometrists using standard techniques. Age- and sex-specific Z-scores were generated based on CDC 2000 growth charts (24) for body mass index (BMI) so that DS and non-DS groups were compared by the same reference. Obesity was defined as a BMI≥95th percentile for age and sex.
Statistical Analyses
Continuous variables were summarized as mean and standard deviation (SD) or as median and interquartile range (IQR) depending on the distribution, and were compared between groups using the 2-sample t test or Wilcoxon rank sum test, as appropriate. Categorical variables were summarized as count and percentage and compared using the chi-squared test or Fisher exact test, as appropriate. Linear regression was used to assess the effect of obesity on the QOL scores, with the interaction between obesity and DS status included in the model to assess whether obesity affects the scores differently between participants with DS and non-DS. Logarithmic transformation on the outcome variables was performed to meet the normality assumption of linear regression when necessary. Cronbach’s alpha was calculated to estimate the internal consistency of the items in the PedsQL and adapted caregiver-reported IWQOL-Kids. P value <0.05 was considered statistically significant. Statistical analysis was performed with SAS 9.4.
Results
Caregiver-reported QOL was collected from 150 caregivers of youth with DS aged 14.6±3.3 years and 59 caregivers of youth without DS aged 14.4±2.7 years. Demographic characteristics and adaptive functioning for children and adolescents with and without DS are presented in Table 1. As expected, weight, weight z-score, height, and height z-score were significantly lower in youth with DS compared with those without DS. As designed a priori for the larger cross-sectional study examining cardiometabolic risk in youth with DS, no significant difference in BMI was found between groups. Further, all measures of adaptive functioning were significantly lower in youth with DS compared with youth without DS. No differences between groups in parent-reported behavioral health concerns were identified. Because of insufficient time during the visit in which the caregiver could focus on completing the questionnaires, four caregivers of youth with DS and two caregivers of children without DS completed the questionnaires at home and later returned them to the research team. The youth of this subset of caregivers did not differ in age or race/ethnicity distribution from the youth whose caregiver completed the questionnaires at the visit. Lastly, we performed a sensitivity analysis of the primary outcomes, including youth diagnosed with ASD in both the DS and non-DS group, as well as without ASD in the non-DS group, which yielded similar results across analyses. Therefore, we excluded non-DS participants whose caregiver reported a diagnosis of ASD in analyses to capture better a typically-developing cohort for this study.
Table 1.
Child Baseline characteristics
| Characteristics, Mean (SD) | Down Syndrome (N=150) | Control (N=59) | p-value |
|---|---|---|---|
| Age, yr | 14.6 (3.3) | 14.4 (2.7) | 0.59 |
| Sex, female, N (%) | 84 (56) | 36 (59) | 0.78 |
| Race, N (%) | 0.07 | ||
| White | 114 (76) | 41 (69) | |
| African American | 29 (19) | 18 (31) | |
| Other | 7 (5) | 0 (0) | |
| Ethnicity, N (%) | 0.12 | ||
| Non-Hispanic | 138 (92) | 58 (98) | |
| Weight, kg | 55.9 (19.6) | 69.8 (23.9) | < 0.0001 |
| Weight z-score | 0.24 (1.3) | 1.2 (1.1) | < 0.0001 |
| Height, cm | 143.1 (11.2) | 160.0 (12.5) | < 0.0001 |
| Height z-score | −2.2 (1.1) | 0.21 (0.95) | < 0.0001 |
| BMI kg/m2 | 26.9 (7.8) | 26.8 (7.6) | 0.96 |
| BMI z-score | 1.3 (1.0) | 1.3 (1.0) | 0.89 |
| BMI Percentile Category, N (%) | 0.85 | ||
| Obese | 63 (42) | 25 (42) | |
| Overweight | 31 (21) | 14 (24) | |
| Healthy Weight | 56 (37) | 20 (34) | |
| Pubertal Status, N (%) | 0.20 | ||
| Tanner Stage 1 | 22 (15) | 6 (10) | |
| Tanner Stage 2 | 11 (7) | 6 (10) | |
| Tanner Stage 3 | 16 (11) | 8 (14) | |
| Tanner Stage 4 | 40 (27) | 8 (14) | |
| Tanner Stage 5 | 60 (40) | 31 (53) | |
| Caregiver Reporter, N (%) | 0.19 | ||
| Mother | 126 (84) | 52 (88) | |
| Father | 21 (14) | 4 (7) | |
| Other | 3 (2) | 3 (5) | |
| Type of Primary Insurance, N (%) | 0.16 | ||
| Private | 109 (73) | 36 (61) | |
| Public | 40 (27) | 22 (36) | |
| Caregiver-Reported | |||
| Behavioral Health Concerns, N (%) | |||
| ADHD | 21 (14) | 9 (15) | 1.0 |
| Autism Spectrum Disorder | 16 (11) | ||
| Depression/Bipolar | 2 (1) | 2 (3) | 1.0 |
| Anxiety | 18 (12) | 7 (12) | 1.0 |
| Other | 10 (7) | 2 (3) | .52 |
| Adaptive Functioning | N=146 | N=59 | |
| General Adaptive Composite | 60.1 (14.8) | 104.4 (12.5) | < 0.0001 |
| Conceptual Classification | 1.4 (0.8) | 4.4 (1.1) | < 0.0001 |
| Communication | 4.4 (3.1) | 11.5 (1.9) | < 0.0001 |
| Functional Academics | 2.6 (1.8) | 10.5 (2.8) | < 0.0001 |
| Self-Direction | 2.8 (2.7) | 10.4 (3.3) | < 0.0001 |
| Social Classification | 2.3 (1.3) | 4.5 (1.1) | < 0.0001 |
| Social | 5.4 (3.7) | 10.2 (2.9) | < 0.0001 |
| Leisure | 5.5 (3.1) | 11.6 (2.4) | < 0.0001 |
| Practical Classification | 1.4 (0.8) | 4.2 (1.0) | < 0.0001 |
| Community Use | 2.9 (2.5) | 10.9 (2.9) | < 0.0001 |
| Home/School Living | 3.3 (3.3) | 8.8 (3.9) | < 0.0001 |
| Self-Care | 2.8 (2.7) | 10.1 (2.4) | < 0.0001 |
| Health and Safety | 3.5 (2.7) | 11.0 (1.9) | < 0.0001 |
Cronbach’s alpha for caregiver-reported Total PedsQL scores was 0.88 in DS and 0.94 in the non-DS group, which are similar to published findings (19, 20). Caregiver-reported Total QOL, Physical Health, and Psychosocial Health summary scores were all significantly lower in the DS group vs the non-DS group (p<0.001) (Figure). Social and School Functioning (p<0.001) were also lower, but Emotional Functioning did not differ between DS and non-DS groups (p=0.31). Although Physical Functioning (p=0.003) and Total scores (p=0.03) differed between obese and non-obese typically-developing youth, no differences were reported between obese and non-obese youth with DS, and no group by obesity interaction effect was observed for the PedsQL (Table 2).
Figure.
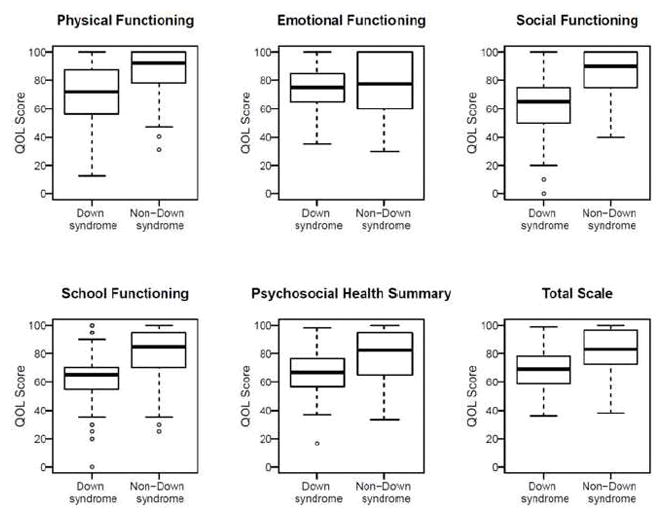
Boxplots of caregiver-reported quality of life scores derived from the PedsQL. Caregiver-reported Physical Health, Social and School Functioning, Psychosocial Health summary, and Total QOL scores were all lower in the DS group vs the non-DS group *(P < .001). Emotional Functioning did not differ between DS and non-DS groups.
Table 2.
Caregiver-reported PedsQL scores stratified by obesity
| PedsQL Scores | DS | Non-DS | p-value of group-obese interaction * | ||||
|---|---|---|---|---|---|---|---|
| Obese N=63 |
Not Obese N=87 |
p-value | Obese N=24 |
Not Obese N=34 |
p-value | ||
| Mean (SD) | Mean (SD) | Mean (SD) | Mean (SD) | ||||
| Physical Functioning | 68.3 (18.5) | 73.2 (21.4) | 0.14 | 78.9 (18.8) | 89.7 (19.7) | 0.003 | 0.09 |
| Emotional | 73.3 (16.0) | 76.0 (14.9) | 0.29 | 75.6 (19.5) | 77.2 (25.1) | 0.47 | 0.96 |
| Social | 60.7 (20.9) | 63.3 (19.2) | 0.43 | 80.4 (16.4) | 85.0 (22.3) | 0.11 | 0.49 |
| School | 61.5 (18.2) | 64.0 (17.2) | 0.40 | 75.6 (18.5) | 80.0 (24.0) | 0.18 | 0.38 |
| Psychosocial | 65.1 (14.3) | 67.8 (13.8) | 0.27 | 77.2 (15.4) | 80.7 (22.4) | 0.17 | 0.51 |
| Total Score | 66.2 (13.2) | 69.6 (14.2) | 0.13 | 77.8 (14.0) | 83.9 (21.0) | 0.03 | 0.21 |
: test whether the effect of obesity on the scores is different between the DS and controls using linear regression.
The parent-proxy IWQOL-Kids measure was found to be highly reliable. Cronbach’s alpha was 0.82 and 0.88 for parents reporting on youth with DS and for parents reporting on youth without DS, respectively. With regard to weight-specific QOL (IWQOL-Kids), caregivers of youth with DS reported higher Body Esteem (p=0.02) and Social Life scores (p=0.03) than caregivers of youth without DS. No differences between caregiver-reported IWQOL-Kids of youth with or without DS were found for the Physical Comfort (p=0.18) or Family Relationships domains (p=0.77), or for Total scores (p=0.27). Caregivers of youth with obesity, regardless of DS status, reported significantly lower weight-specific QOL scores for all domains than caregivers for non-obese youth, with the exception of Family Relationships in the non-DS group (p=0.20) (Table 3). A group by obesity interaction effect was observed for Body Esteem scores. The mean difference in Body Esteem scores between obese DS and obese non-DS participants was 10.9 points higher than the mean difference between non-obese counterparts (p=0.003); among obese participants, caregivers of youth with DS reported higher Body Esteem scores for their children than caregivers of non-DS youth (Table 3).
Table 3.
Parent IWQOL-Kids scores by DS and obese status
| IWQOL-Kids Scores | Down Syndrome | Control | p-value of group-obese interaction * | ||||
|---|---|---|---|---|---|---|---|
| Obese (N=63) Mean (SD) |
Not Obese (N=87) Mean (SD) |
p-value | Obese (N=24) Mean (SD) |
Not Obese (N=34) Mean (SD) |
p-value | ||
| Physical Comfort | 83.3 (18.6) | 97.1 (7.5) | < 0.0001 | 86.0 (16.6) | 98.2 (7.9) | 0.004 | 0 .45 |
| Body Esteem | 91.4 (11.1) | 98.0 (5.4) | < 0.0001 | 73.9 (25.7) | 93.9 (12.8) | 0.002 | 0.003 |
| Social Life | 89.7 (17.6) | 98.4 (5.9) | 0.0003 | 80.7 (21.0) | 95.0 (14.0) | 0.011 | 0 .31 |
| Family Relationships | 93.8 (13.5) | 98.6 (5.3) | 0.009 | 93.2 (11.2) | 97.5 (8.9) | 0.20 | 0 .66 |
| Total | 89.8 (11.7) | 98.0 (5.1) | < 0.0001 | 82.4 (16.7) | 95.9 (10.5) | 0.002 | 0 .24 |
: test whether the effect of obesity on the scores is different between the DS and controls.
Discussion
Although several studies have examined QOL of the caregivers of children with DS (25, 26), caregiver-reported perception of QOL in children with DS has been largely ignored (27). Furthermore, no studies have examined whether obesity, a common condition in youth with DS, affects QOL to the same degree that it does in youth without DS (21, 22). In this study, caregivers of youth with DS reported their children had lower total QOL and, with the exception of the Emotional Functioning domain, lower domain-specific QOL. The extent to which a parent’s perception of the QOL of his/her child with DS reflects the child’s perception of QOL is not known, but these findings should alert healthcare providers and other stakeholders regarding the need to address social and health-related issues that threaten QOL.
These findings are consistent with the another study of caregiver-report of QOL in youth with DS; van Gameren-Oosterom and colleagues reported lower QOL in 8-year old children with DS compared with a randomly selected group of children of identical chronological age and sex from the general population (27). Further, the findings of reduced QOL compared with typically developing youth are also consistent with a study examining caregiver-reported QOL in children, adolescents, and young adults with intellectual and developmental disabilities associated with several disorders examined together, including ASD, DS, fetal alcohol syndrome, and cerebral palsy (20). However, the finding of similar caregiver-reported Emotional Functioning compared with typically-developing peers has not been reported (20, 27).
The absence of differences in Emotional Functioning between youth with and without DS reported by caregivers is noteworthy; increased incidence of depression (as high as 11%) is reported in adults with DS (28), and depressive symptoms may increase as youth with DS enter adolescence and young adulthood (29, 30). However, children with DS have been reported to be at a lower risk for psychopathology compared with other children with intellectual disabilities (ID), and families of children with DS report lower levels of stress and a more positive outlook than families of children with other IDs (30). Emotional functioning of youth with DS may be similar to peers without DS in childhood through adolescence, as found in this study. Changes in emotional and behavioral functioning in young adulthood may be more associated with life changes, such as transition to adulthood, and the transition from education to adult care systems, and changes in family and community supports. The findings of relatively similar emotional QOL reported by parents need to be validated by a measurement of self-reported QOL in youth with ID.
Differences in findings could be attributed to differences in cognition and/or adaptive functioning (27). Although our study did not collect cognitive data, scores from the ABAS-II, including the GAC, self-direction, social, community use and self-care scales, were significantly lower in youth with DS as compared with youth without DS (Table 1); these results indicate that adaptive functioning may play a role in caregiver-perceived QOL in their children. How a child perceives their QOL in these areas is also unclear. Although some published measures of self-reported and proxy-reported QOL are available for those with ID, none have demonstrated suitable reliability and validity for a broad spectrum of IDs (31, 32).
Previous studies have reported that youth with obesity have lower QOL compared with youth without obesity, and QOL among obese youth is similar to QOL of youth with cancer (17, 22). In the current study, obesity negatively influenced caregiver-reported general health-related QOL (PedsQL) for typically-developing youth in the domain of Physical Functioning and Total HRQOL scores. Obesity had no impact on general HRQOL in the DS group as reflected by the PedsQL.
Excess weight plays a role in caregiver-reported weight-related QOL in youth with and without DS. Obese youth with DS had lower total weight-related QOL and across all domains. Youth with obesity without DS also had lower total weight-related QOL and across all domains, with the exception of Family Relationships. Body Esteem was the sole domain with a significant difference in the effect of obesity between youth with DS and youth without DS. Caregivers of non-obese youth with DS reported the highest ratings of Body Esteem, whereas caregivers of obese youth without DS report the lowest Body Esteem. These between group differences may be attributable to caregiver perception of youth self-perception and self-concept awareness. Youth with DS hold very positive self-perceptions across domains (33), though mental age may affect the ability of an individual with DS’s to form a self-concept (34). Thus, providers may be more likely to persuade caregivers of children with DS about the need to lose weight based on threats to health and effects on physical and social functioning rather than on obesity’s negative effects on self-esteem.
Caregivers of youth with DS reported higher Body Esteem and Social Life weight-related QOL than caregivers of youth without DS, indicating that in these domains, weight considerations may play a smaller role in caregiver perceived QOL in youth with DS compared with youth without DS. For all other weight-related domains, caregivers reported that youth with obesity, regardless of DS diagnosis, have similarly reduced weight-related Total QOL, Physical Comfort, and Family Relationships. Caregivers of youth both with and without DS, when prompted to consider weight, perceive obesity as a negative impact on QOL. Thus, provider discussions of weight concerns and weight management strategies with caregivers of youth with DS and obesity might include focus on improving QOL as well as physical health.
This study of a diverse cohort of children and adolescents with DS of varying ages and abilities addresses the great need for increased research in reported outcomes of QOL of youth with DS. This need is punctuated by the fact that DS is the most common genetic cause of developmental disability, and that DS life-expectancy has increased so significantly. Our study also examines weight concerns and the impact of obesity upon QOL in youth with DS - an important contribution given the propensity for youth with DS to develop obesity. Limitations of the study include relying on parent report of adaptive functioning as proxy for cognitive testing. Although no differences were observed between groups in the number of youth with caregiver-reported diagnoses of common behavioral health concerns, such as attention deficit hyperactivity disorder (ADHD), depression, and anxiety, no formal measures of emotional and behavioral concerns were administered, which could also affect caregiver perception of QOL. In addition,, caregiver perception of QOL of his/her child with DS may be subject to bias given the history of experiences between the individuals, the emotional connection, and the existing relationship between a caregiver and offspring; caregiver-reported QOL may not accurately reflect the perception of QOL of the individual with DS. In this study, more youth with DS were diagnosed with ASD than in the non-DS group, which accurately represents the increased prevalence of ASD in the DS population (35, 36). This study also used QOL measures neither developed nor validated for populations with neurodevelopmental concerns. However, the PedsQL is 1 of the most widely used QOL assessments, and has been administered in many populations, including those with cerebral palsy, Duchenne muscular dystrophy, and fibromyalgia (37–39). This study provides a robust foundation for future research of the validity of using caregiver-reported generic QOL measures within a DS population. Further, although the caregiver-reported IWQOL-Kids has not been used previously in youth with DS, psychometric instrument validation is well-recognized as a multistep, continual process. Future research using the IWQOL-Kids for populations with neurodevelopmental disorders at risk for obesity such as DS is merited, as is research using self-report measures of QOL in populations with ID.
Caregivers of young children with DS reported lower QOL, with the exception of Emotional Functioning, in youth with DS compared with youth without DS. Importantly, obesity did not magnify these differences. Although body esteem was maintained despite obesity in youth with DS, most domains of QOL were compromised to the same degree among the obese youth in both groups. Providers should consider addressing weight concerns in youth with obesity even in the presence of DS, as obesity similarly affects most domains of QOL in youth with and without DS. Moreover, how healthcare and social communities can help to promote QOL for individuals with DS are important future considerations with implications for not only youth with DS but youth with other IDs.
Acknowledgments
Supported by the National Institutes of Health (NIH) (R01HD071981 [to A.K. and S.M.]) and Research Electronic Data Capture (REDCap). This project was supported by Award Number UL1TR001876 from the NIH National Center for Advancing Translational Sciences. Its contents are solely the responsibility of the authors and do not necessarily represent the official views of the National Center for Advancing Translational Sciences or the National Institutes of Health. R.B. has been a scientific consultant to Eisai Inc and through the University of Pennsylvania has received grant support from Eisai and Novo Nordisk. The other authors declare no conflicts of interest.
Many thanks to the study participants and their families, as well as research coordinators Claire Cochrane, Amber Lauff, and Priscilla Andalia, and students Sarah Appeadu, Elizabeth Stulpin, Claire Trindle, Natalie Rosetti, Jeffrey Signora, Cassandra Zhi, Cedar Slovacek, Suzanne M. Arnott, Monica N. Salama, Vanya Aggarwal, Elizabeth Greubel, and Emily Eicheldinger for their diligent efforts.
In addition, we appreciate the contributions of the CHOP Clinical and Translational Research Center, the CNHS Center for Translational Science, the CHOP Pediatric Research Consortium, the CHOP Recruitment Enhancement Core, without whom this study would not have been possible. Recruitment for the study included ResearchMatch, a national health volunteer registry that was created by several academic institutions and supported by the US. National Institutes of Health as part of the Clinical Translational Science Award (CTSA) program. ResearchMatch has a large population of volunteers who have consented to be contacted by researchers about health studies for which they may be eligible. We would also like to thank Ronette L. Kolotkin, PhD and Quality of Life Consulting, PLLC, for allowing us to adapt and use the IWQOL-Kids for our study. Ronette L. Kolotkin, PhD, doing business as Quality of Life Consulting, PLLC, receives royalties for the use of the IWQOL-Kids.
Abbreviations
- QOL
Quality of Life
- DS
Down syndrome
- BMI
Body mass index
- IWQOL
Impact of Weight on Quality of Life Questionnaire
- PedsQL
Pediatric Quality of Life Questionnaire
- ABAS-II
Adaptive Behavior Assessment System-Second Edition
- ID
Intellectual disability
Footnotes
Clinical Trial Registration: NCT01821300
Acknowledgments available at www.jpeds.com.
Publisher's Disclaimer: This is a PDF file of an unedited manuscript that has been accepted for publication. As a service to our customers we are providing this early version of the manuscript. The manuscript will undergo copyediting, typesetting, and review of the resulting proof before it is published in its final citable form. Please note that during the production process errors may be discovered which could affect the content, and all legal disclaimers that apply to the journal pertain.
References
- 1.The WHOQOL Group. The world health organization quality of life assessment (WHOQOL). Development and psychometric properties. Soc Sci Med. 1998;45:1569–85. doi: 10.1016/s0277-9536(98)00009-4. [DOI] [PubMed] [Google Scholar]
- 2.Parker SE, Mai CT, Canfield MA, Rickard R, Wang Y, Meyer RE, et al. Updated National Birth Prevalence estimates for selected birth defects in the United States, 2004–2006. Birth Defects Res A Clin Mol Teratol. 2010;88:1008–16. doi: 10.1002/bdra.20735. [DOI] [PubMed] [Google Scholar]
- 3.de Graaf G, Buckley F, Skotko BG. Estimates of the live births, natural losses, and elective terminations with Down syndrome in the United States. Am J Med Genet A. 2015;167A:756–67. doi: 10.1002/ajmg.a.37001. [DOI] [PubMed] [Google Scholar]
- 4.Kucik JE, Shin M, Siffel C, Marengo L, Correa A, et al. Congenital Anomaly Multistate P. Trends in survival among children with Down syndrome in 10 regions of the United States. Pediatrics. 2013;131:e27–36. doi: 10.1542/peds.2012-1616. [DOI] [PMC free article] [PubMed] [Google Scholar]
- 5.Glasson EJ, Jacques A, Wong K, Bourke J, Leonard H. Improved Survival in Down Syndrome over the Last 60 Years and the Impact of Perinatal Factors in Recent Decades. J Pediatr. 2016;169:214–20. e1. doi: 10.1016/j.jpeds.2015.10.083. [DOI] [PubMed] [Google Scholar]
- 6.Glasson EJ, Sullivan SG, Hussain R, Petterson BA, Montgomery PD, Bittles AH. The changing survival profile of people with Down’s syndrome: implications for genetic counselling. Clin Genet. 2002;62:390–3. doi: 10.1034/j.1399-0004.2002.620506.x. [DOI] [PubMed] [Google Scholar]
- 7.Alexander M, Petri H, Ding Y, Wandel C, Khwaja O, Foskett N. Morbidity and medication in a large population of individuals with Down syndrome compared to the general population. Dev Med Child Neurol. 2016;58:246–54. doi: 10.1111/dmcn.12868. [DOI] [PubMed] [Google Scholar]
- 8.Uppal H, Chandran S, Potluri R. Risk factors for mortality in Down syndrome. J Intellect Disabil Res. 2015;59:873–81. doi: 10.1111/jir.12196. [DOI] [PubMed] [Google Scholar]
- 9.Bull MJ. Health supervision for children with Down syndrome. Pediatrics. 2011;128:393–406. doi: 10.1542/peds.2011-1605. [DOI] [PubMed] [Google Scholar]
- 10.Jonsson U, Alaie I, Lofgren Wilteus A, Zander E, Marschik PB, Coghill D, et al. Annual Research Review: Quality of life and childhood mental and behavioural disorders - a critical review of the research. J Child Psychol Psychiatry. 2016 doi: 10.1111/jcpp.12645. [DOI] [PubMed] [Google Scholar]
- 11.Moyal WN, Lord C, Walkup JT. Quality of life in children and adolescents with autism spectrum disorders: what is known about the effects of pharmacotherapy? Paediatr Drugs. 2014;16:123–8. doi: 10.1007/s40272-013-0050-4. [DOI] [PubMed] [Google Scholar]
- 12.Roizen NJ, Patterson D. Down’s syndrome. Lancet. 2003;361:1281–9. doi: 10.1016/S0140-6736(03)12987-X. [DOI] [PubMed] [Google Scholar]
- 13.Prasher VP. Overweight and obesity amongst Down’s syndrome adults. J Intellect Disabil Res. 1995;39(Pt 5):437–41. doi: 10.1111/j.1365-2788.1995.tb00548.x. [DOI] [PubMed] [Google Scholar]
- 14.Harris N, Rosenberg A, Jangda S, O’Brien K, Gallagher ML. Prevalence of obesity in International Special Olympic athletes as determined by body mass index. J Am Diet Assoc. 2003;103:235–7. doi: 10.1053/jada.2003.50025. [DOI] [PubMed] [Google Scholar]
- 15.Basil JS, Santoro SL, Martin LJ, Healy KW, Chini BA, Saal HM. Retrospective Study of Obesity in Children with Down Syndrome. J Pediatr. 2016;173:143–8. doi: 10.1016/j.jpeds.2016.02.046. [DOI] [PubMed] [Google Scholar]
- 16.Bertapelli F, Pitetti K, Agiovlasitis S, Guerra-Junior G. Overweight and obesity in children and adolescents with Down syndrome-prevalence, determinants, consequences, and interventions: A literature review. Res Dev Disabil. 2016;57:181–92. doi: 10.1016/j.ridd.2016.06.018. [DOI] [PubMed] [Google Scholar]
- 17.Schwimmer JB, Burwinkle TM, Varni JW. Health-related quality of life of severely obese children and adolescents. JAMA. 2003;289:1813–9. doi: 10.1001/jama.289.14.1813. [DOI] [PubMed] [Google Scholar]
- 18.Williams J, Wake M, Hesketh K, Maher E, Waters E. Health-related quality of life of overweight and obese children. JAMA. 2005;293:70–6. doi: 10.1001/jama.293.1.70. [DOI] [PubMed] [Google Scholar]
- 19.Varni JW, Seid M, Kurtin PS. PedsQL 4.0: reliability and validity of the Pediatric Quality of Life Inventory version 4.0 generic core scales in healthy and patient populations. Med Care. 2001;39:800–12. doi: 10.1097/00005650-200108000-00006. [DOI] [PubMed] [Google Scholar]
- 20.Viecili MA, Weiss JA. Reliability and Validity of the Pediatric Quality of Life Inventory With Individuals With Intellectual and Developmental Disabilities. Am J Intellect Dev Disabil. 2015;120:289–301. doi: 10.1352/1944-7558-120.4.289. [DOI] [PubMed] [Google Scholar]
- 21.Kolotkin RL, Zeller M, Modi AC, Samsa GP, Quinlan NP, Yanovski JA, et al. Assessing weight-related quality of life in adolescents. Obesity. 2006;14:448–57. doi: 10.1038/oby.2006.59. [DOI] [PMC free article] [PubMed] [Google Scholar]
- 22.Modi AC, Loux TJ, Bell SK, Harmon CM, Inge TH, Zeller MH. Weight-specific health-related quality of life in adolescents with extreme obesity. Obesity (Silver Spring) 2008;16:2266–71. doi: 10.1038/oby.2008.347. [DOI] [PMC free article] [PubMed] [Google Scholar]
- 23.Harrison PL, Oakland T. Adaptive Behavior Assessment System. 2. Minneapolis, MN: Pearson Assessment; 2003. [Google Scholar]
- 24.Kuczmarski RJ, Ogden CL, Guo SS, Grummer-Strawn LM, Flegal KM, Mei Z, et al. 2000 CDC Growth Charts for the United States: methods and development. Vital Health Stat. 2002;11:1–190. [PubMed] [Google Scholar]
- 25.de Oliveira EF, Limongi SC. Quality of life of parents/caregivers of children and adolescents with Down syndrome. J Soc Bras Fonoaudiol. 2011;23:321–7. doi: 10.1590/s2179-64912011000400006. [DOI] [PubMed] [Google Scholar]
- 26.Marchal JP, Maurice-Stam H, Hatzmann J, van Trotsenburg AS, Grootenhuis MA. Health related quality of life in parents of six to eight year old children with Down syndrome. Res Dev Disabil. 2013;34:4239–47. doi: 10.1016/j.ridd.2013.09.011. [DOI] [PubMed] [Google Scholar]
- 27.van Gameren-Oosterom HB, Fekkes M, Buitendijk SE, Mohangoo AD, Bruil J, Van Wouwe JP. Development, problem behavior, and quality of life in a population based sample of eight-year-old children with Down syndrome. Plos One. 2011;6:e21879. doi: 10.1371/journal.pone.0021879. [DOI] [PMC free article] [PubMed] [Google Scholar]
- 28.Walker JC, Dosen A, Buitelaar JK, Janzing JG. Depression in Down syndrome: a review of the literature. Res Dev Disabil. 2011;32:1432–40. doi: 10.1016/j.ridd.2011.02.010. [DOI] [PubMed] [Google Scholar]
- 29.Foley KR, Bourke J, Einfeld SL, Tonge BJ, Jacoby P, Leonard H. Patterns of depressive symptoms and social relating behaviors differ over time from other behavioral domains for young people with Down syndrome. Medicine (Baltimore) 2015;94:e710. doi: 10.1097/MD.0000000000000710. [DOI] [PMC free article] [PubMed] [Google Scholar]
- 30.Grieco J, Pulsifer M, Seligsohn K, Skotko B, Schwartz A. Down syndrome: Cognitive and behavioral functioning across the lifespan. Am J Med Genet C Semin Med Genet. 2015;169:135–49. doi: 10.1002/ajmg.c.31439. [DOI] [PubMed] [Google Scholar]
- 31.Deroche CB, Holland MM, McDermott S, Royer JA, Hardin JW, Mann JR, et al. Development of a tool to describe overall health, social independence and activity limitation of adolescents and young adults with disability. Res Dev Disabil. 2015;38:288–300. doi: 10.1016/j.ridd.2014.12.009. [DOI] [PMC free article] [PubMed] [Google Scholar]
- 32.Townsend-White C, Pham AN, Vassos MV. Review: a systematic review of quality of life measures for people with intellectual disabilities and challenging behaviours. J Intellect Disabil Res. 2012;56:270–84. doi: 10.1111/j.1365-2788.2011.01427.x. [DOI] [PubMed] [Google Scholar]
- 33.Begley A. The self-perceptions of pupils with Down syndrome in relation to their academic competence, physical competence, and social acceptance. Int J Disabil Dev Edu. 1999;46:515–29. [Google Scholar]
- 34.Saha S, Doran E, Osann KE, Hom C, Movsesyan N, Rosa DD, et al. Self-concept in children with Down syndrome. Am J Med Genet A. 2014;164A:1891–8. doi: 10.1002/ajmg.a.36597. [DOI] [PMC free article] [PubMed] [Google Scholar]
- 35.Kent L, Evans J, Paul M, Sharp M. Comorbidity of autistic spectrum disorders in children with Down syndrome. Dev Med Child Neurol. 1999;41:153–8. doi: 10.1017/s001216229900033x. [DOI] [PubMed] [Google Scholar]
- 36.Lowenthal R, Paula CS, Schwartzman JS, Brunoni D, Mercadante MT. Prevalence of pervasive developmental disorder in Down’s syndrome. J Autism Dev Disord. 2007;37:1394–5. doi: 10.1007/s10803-007-0374-4. [DOI] [PubMed] [Google Scholar]
- 37.Varni JW, Limbers CA, Burwinkle TM. Impaired health-related quality of life in children and adolescents with chronic conditions: a comparative analysis of 10 disease clusters and 33 disease categories/severities utilizing the PedsQL 4.0 Generic Core Scales. Health Qual Life Outcomes. 2007;5:43. doi: 10.1186/1477-7525-5-43. [DOI] [PMC free article] [PubMed] [Google Scholar]
- 38.Varni JW, Burwinkle TM, Limbers CA, Szer IS. The PedsQL as a patient-reported outcome in children and adolescents with fibromyalgia: an analysis of OMERACT domains. Health Qual Life Outcomes. 2007;5:9. doi: 10.1186/1477-7525-5-9. [DOI] [PMC free article] [PubMed] [Google Scholar]
- 39.Uzark K, King E, Cripe L, Spicer R, Sage J, Kinnett K, et al. Health-related quality of life in children and adolescents with Duchenne muscular dystrophy. Pediatrics. 2012;130:e1559–66. doi: 10.1542/peds.2012-0858. [DOI] [PubMed] [Google Scholar]