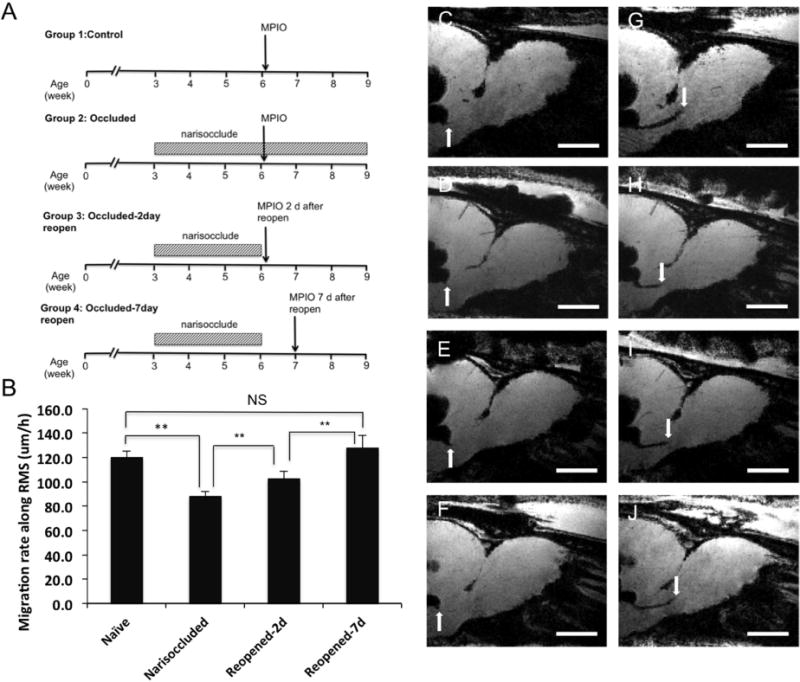
Figure 3.

Effect of olfactory activity on the speed of cell migration from the SVZ along the RMS into the OB. A) Experimental design. B) Migration rate along the RMS. C, D, E, F) MPIOs were injected into lateral ventricles near SVZ and MRI was performed after 4–6 hours after injection to mark the initial time point. Another session of MRI was performed at 22–24 hours post-injection. G, H, I, J) The distance between the first and second time points was measured and divided by the time to calculate the speed of migration graph I. ** Indicates significant difference with p value < 0.05. The numbers of animals in each group were 6 for naïve, 5 for narisoccluded, 5 for 2-day reopened, and 5 for 7-day reopened. Scale bar in images C-J = 2 mm.
