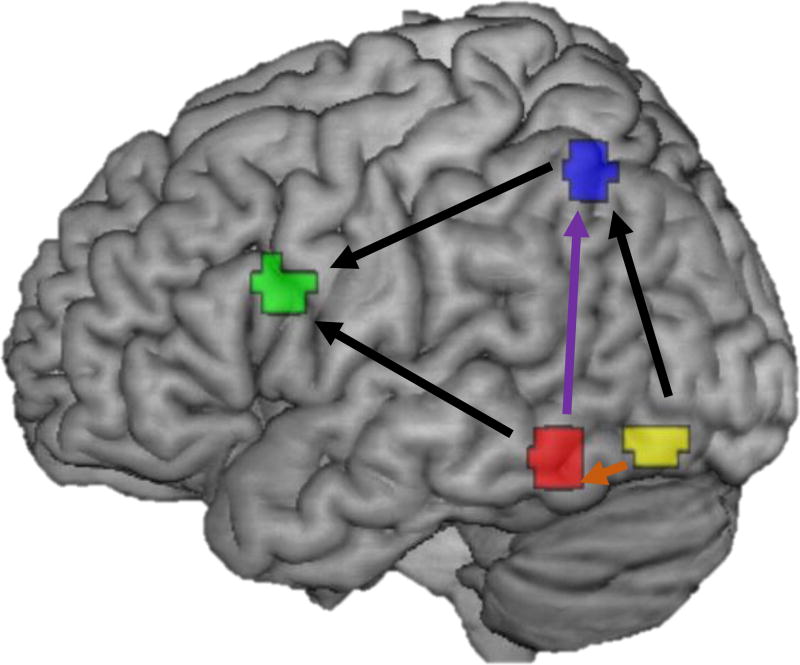
Figure 2.
Illustration of the path model for contemporary connections between regions. Five forward feeding pathways were included. IOG (yellow) to both FG (red) and IPL (blue), FG to IPL, and FG and IPL to IFG (green). The dorsal pathway is highlighted in purple, the ventral in orange. Regions for each node reflect the 6mm sphere around the group peak found within the search space for each ROI, constrained to exclude voxels outside the search space.

