Abstract
Automatic segmentation of the thalamus can be used to measure differences and track changes in thalamic volume that may occur due to disease, injury or normal aging. An automatic thalamus segmentation algorithm incorporating features from diffusion tensor imaging (DTI) and thalamus priors constructed from multiple atlases is proposed. Multiple atlases with corresponding manual thalamus segmentations are registered to the target image and averaged to generate the thalamus prior. At each voxel in a region of interest around the thalamus, a multidimensional feature vector that includes the thalamus prior as well as a set of DTI features, including fractional anisotropy, mean diffusivity, and fiber orientation is formed. A random forest is trained to classify each voxel as belonging to the thalamus or background within the region of interest. Using a leave-one-out cross-validation on nine subjects, the proposed algorithm achieves a mean Dice score of 0.878 and 0.890 for the left and right thalami, respectively, which are higher Dice scores than the three state-of-art methods we compared to. We demonstrate the utility of the method with a pilot study exploring the difference in the thalamus fraction between 21 multiple sclerosis (MS) patients and 21 age-matched healthy controls. The left and right thalamic volumes (normalized by intracranial volumes) are larger in healthy controls by 7.6% and 7.3% respectively, compared to MS patients (though neither result is statistically significant).
Keywords: Thalamus segmentation, diffusion MRI, magnetic resonance imaging
1. Introduction
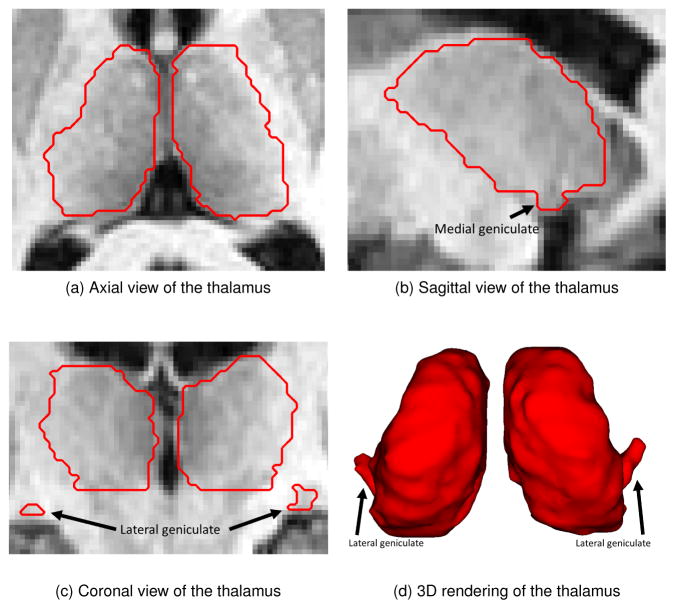
The thalamus is a key subcortical structure located between the cerebral cortex and midbrain. It relays sensory and motor signals to the cerebral cortex and regulates consciousness, sleep, and alertness (Sherman and Guillery, 2000). It is composed of gray matter and myelinated fibers and has connections to nearly every major region in the brain. Figure 1 shows an example of a manual segmentation of the thalamus overlayed on three views of the corresponding magnetic resonance image (MRI) and as a volume rendering. The thalamus can be subdivided into thalamic nuclei based on histological or functional criteria (Ziyan et al., 2006). The medial and lateral geniculates (Morel, 2007), two small thalamic nuclei located inferior to the main body of the thalamus, are identified by arrows in Fig. 1. The geniculates can be difficult for automatic algorithms to segment due to their low contrast compared to surrounding tissue in T1-w MRI, resulting in an inaccurate estimation of the thalamic volume. Changes in thalamic volume are correlated with many neurodegenerative diseases including multiple sclerosis (MS) (Cifelli et al., 2002; Houtchens et al., 2007), Alzheimer’s disease (Braak and Braak, 1991; Zarei et al., 2010), schizophrenia (Byne et al., 2002; Cullen et al., 2003; Danos et al., 2003), and Parkinson’s disease (Jellinger, 1999). Thus, accurate segmentation of the thalamus is an important part of understanding and managing neurological diseases and using an automatic segmentation method can facilitate this task.
Figure 1.
Examples of the thalamus anatomy (outlined as a red contour) overlaid on a T1-w MRI. The black arrows in the coronal and sagittal views as well as in the volumetric rendering show the locations of the medial and lateral geniculates.
Our work is motivated by prior studies on the change in volume of the thalamus in multiple sclerosis. Cifelli et al. (2002) manually outlined thalamic volumes in 14 secondary progressive MS patients and 14 healthy controls (HCs). After normalizing to the intracranial volume (ICV), the mean thalamic volume of the MS patients was 17% smaller compared to HCs. Cifelli et al. (2002) also performed a postmortem study using a set of 13 secondary progressive MS patients and 13 HCs and found a decrease in thalamic volume of 21% between MS patients and HCs. Houtchens et al. (2007) studied the change in thalamic volume in 79 MS patients (62 relapsing-remitting, 16 secondary progressive, 1 primary progressive) and 16 HCs. The thalami were segmented using an edge-finding tool followed by manual correction; a decrease of 16.8% in thalamic volume normalized to ICV was reported. Wylezinska et al. (2003) studied 14 relapsing-remitting MS patients and 14 HCs and reported a 25% decrease in normalized thalamic volume. A significant inverse correlation between normalized thalamic volumes and disease duration was also reported by Wylezinska et al. (2003). The thalamic volumes and ICV in the study by Wylezinska et al. (2003) were segmented manually by an experienced operator. Such studies could be replicated and extended more readily by using an accurate automated algorithm for thalamus segmentation.
Previous methods developed for thalamus segmentation have used T1-weighted (T1-w) MRI alone. Early work by Collins et al. (1999) proposed augmenting a probabilistic atlas with tissue labels. Bazin and Pham (2008) built upon these ideas by combining statistical and topological atlases to find subcortical structures, while observing tissue classification requirements. More sophisticated methods incorporate shape, or spatial priors, such as shape models, topological correction, or spatial information. For example, Patenaude et al. (2011) incorporated prior anatomical information using explicit shape models. Fischl et al. (2002) (in a method called FreeSurfer) proposed using spatial information of relative locations of subcortical structures as a prior. These single probabilistic atlas approaches were replaced with multi-atlas-based segmentation techniques in which multiple atlases are registered to the target image and the deformed labels are fused and transferred to the target (Aljabar et al., 2009; Asman and Landman, 2013). The benefit of multi-atlas techniques is that by fusing the results from multiple atlases, it reduces the effect of errors from any single atlas. However, none of these algorithms incorporate the diffusion properties exhibited both inside and surrounding the thalamus which can be captured from diffusion tensor imaging (DTI).
DTI is an MRI modality that measures the diffusion of water in tissues (Le Bihan and Breton, 1985; Westin et al., 2002). Diffusion occurs strongly along the direction of neural fibers that make up connections in the brain. Because the thalamus has both gray matter and white matter within its structure, additional features derived from DTI are useful to segment the thalamus. For example, Liu et al. (2016) extracted a set of features from DTI and learned a dictionary of thalamus and non-thalamus voxels to train a linear classifier. Most other existing thalamus segmentation algorithms that incorporate features derived from DTI are semi-automatic. Jonasson et al. (2007) proposed a level-set method using the similarity of tensors to define the region force, but this method requires manual initialization of a contour surrounding the thalamus. Duan et al. (2007) proposed a variation of the mean-shift algorithm that requires the user to select the clusters of interest from neighboring clusters to obtain the final thalamus segmentation. Another method that incorporates DTI in identifying the thalamus is Marrakchi-Kacem et al. (2010) which uses fractional anisotropy, as well as a probabilistic atlas to drive a deformable model towards the desired segmentation. An advantage of the proposed work over that of Marrakchi-Kacem et al. is the inclusion of the specific directional information captured by the diffusion tensor. Fan et al. (2010) proposed a set of DTI features to assist with manual segmentation of the thalamus, and we build upon this work by using a similar set of features within our framework.
In this paper, we propose an automatic thalamus segmentation algorithm that is novel in that it incorporates a set of features derived from DTI and both T1-weighted and T2-weighted MRI. In brief, our method aligns atlases and their corresponding thalami segmentations with a subject image. The deformed segmentations are used to create a region of interest (ROI) as an initial estimate of the location of the thalamus. For each voxel in the ROI, a set of features is computed and used in a random forest (RF) classifier. We refer to our proposed method henceforth as Random Forest Thalamus Segmentation (RAFTS). RAFTS expands on earlier work (Stough et al., 2013, 2014; Glaister et al., 2016) by incorporating multiple atlases, expanding our validation, and carrying out a pilot study of thalamic volume differences between healthy controls and MS subjects. In Sec. 2, we introduce our data and associated atlases and we outline the protocol used to develop the atlases. Sec, 3 has a description of our algorithm, including identification of the region of interest, feature vector computation, and random forest construction and training. Section 4 includes a validation of our delineation protocol on nine thalami (both the left and right hemispheres) by two raters, and a comparison between our automated thalamus segmentation method and three state-of-the-art methods. In Sec. 5 we present a pilot study comparing a cohort of MS patients with an age-matched cohort of HCs. In Sec. 6, we discuss the key features of this work and we present our conclusions in Sec. 7.
2. Materials
2.1. Data and Preprocessing
The data used to validate the proposed algorithm are from an ongoing multiple sclerosis (MS) study acquired on a 3T MR scanner (Intera, Philips Medical Systems, Netherlands), which included imaging of healthy controls (HC) for reference purposes. We acquire the following sequences: a T1-w magnetization prepared rapid gradient echo (MPRAGE) with TR = 10.3 ms, TE = 6 ms, and 0.82 × 0.82 × 1.17 mm3 voxel size; a double spin echo (DSE) with TR = 4177 ms, TE1 = 12.31 ms, TE2 = 80 ms, and 0.82 × 0.82 × 2.2 mm3 voxel size; and DTI data using a multi-slice, single shot EPI sequence with one b0 image, 32 gradient directions (b = 700 mm/s), minimum TR, TE = 69 ms, and an acquired resolution of 2.2 × 2.2 × 2.2 mm3 reconstructed on the scanner to 0.8 × 0.8 mm2 in plane. The data first undergoes standard neuroimage processing, including inhomogeneity correction (Sled and et al., 1998), skull stripping (Carass et al., 2011), distortion correction (Studholme et al., 2000), and co-registration of the diffusion and anatomical images (Landman et al., 2007). The diffusion tensors are estimated using a nonlinear tensor fitting method (Cook et al., 2006).
2.2. Atlases
A set of eight atlases is used to locate the thalamus and compute the thalamus prior. The first of the eight atlases is the ICBM brain template (Mazziotta et al., 1995), which was generated by averaging 27 T1-w MRI from a single subject; it contains labels for the thalamus and thalamic nuclei. The remaining seven atlases (two from MS patients and five from HCs) are produced by manually segmenting the left and right thalami on data acquired with identical scanning parameters as those described in Sec. 2.1.
Manual segmentation on the seven atlases is carried out using a protocol based on a combination of Fan et al. (2010) and Power et al. (2015). Briefly, after the initial preprocessing of the data, a manual rater uses the fractional anisotropy (FA) map from the DTI to find the boundaries of the thalamus (Fan et al., 2010). The FA map provides good contrast between the lateral thalamus boundary and the surrounding internal capsule. This initial segmentation is refined using landmarks found in the coronal view of the T1-w MRI as described in the protocol by Power et al. (2015). The lateral and medial geniculates are found using the T1-w MRI, also described by Power et al. (2015). Examples of the atlases and their corresponding manual thalamus segmentations are shown in Fig. 2. Further details about the thalamus manual delineation protocol are given in Appendix A.
Figure 2.
Examples of the atlases with the manual segmentation of the thalamus outlined in red.
3. Method
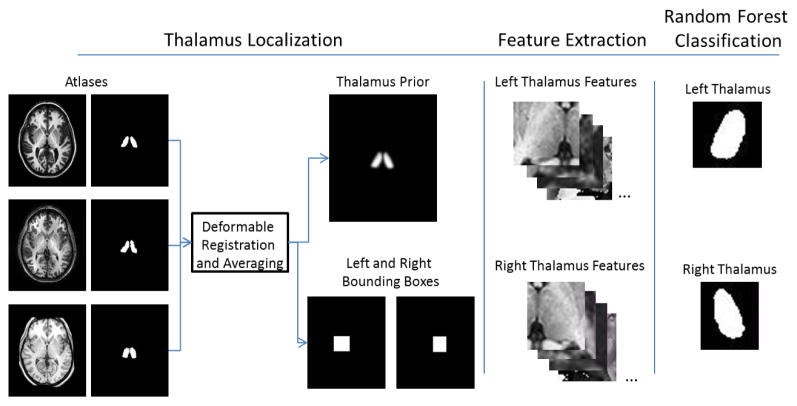
RAFTS consists of three steps: 1) localization of the thalamus and computation of the thalamus prior from a set of atlases; 2) feature extraction; and 3) random forest classification. Each step is detailed below. A graphical summary showing the major steps of RAFTS is given in Fig. 3.
Figure 3.
Graphical summary of RAFTS.
3.1. Thalamus Localization and Construction of Multi-atlas Priors
The thalamus prior is constructed from a set of brain atlases and their corresponding manually segmented thalamus segmentations. The set of brain atlases is registered to the subject’s T1-w MR image using the ELASTIX deformable registration algorithm (Klein et al., 2010). The corresponding thalamus segmentations are deformed to align with the subject’s image.
To compute the thalamus priors, the deformed binary masks are fused and then convolved with a Gaussian kernel, as described next. Let Ai denote the ith binary thalamus segmentation associated with the ith atlas and Ψi be the deformable transformation that takes the ith atlas into the subject space; then Ai ○ Ψi transforms the binary mask into the subject space. To produce continuous values, the deformed labels are averaged and then convolved with a Gaussian kernel 𝒢 with standard deviation (SD), σ. We use this result as the prior probability P(x) of a voxel in the subject image belonging to the thalamus class, where x is a voxel coordinate in the image domain Ω and N is the number of atlases. This can be written as
| (1) |
To reduce the computational burden of training, a region of interest (ROI) is constructed around the left and right thalamus using the prior probability. To compute an estimated thalamus location, the prior probability is thresholded at tP, giving a binary mask 𝒯. The midsagittal plane (Anbazhagan et al., 2006) is used to separate the binary mask into estimated locations of the left and right thalamus. For each thalamus, a padded bounding box ℬ is constructed around this mask,
| (2) |
The lower and upper extents of the estimated thalamus location are given by l = arg minx2𝒯 x and h = arg maxx2𝒯 x respectively. To ensure that the bounding box covers the entire thalamus, we choose r = 0.15 × (h – l), which pads the bounding box by 15% along each axis. We compute ℬ for the left and right thalami independently yielding ℬl and ℬr, respectively. However, to simplify notation, we will only consider one of those bounding boxes and refer to it generically as ℬ.
3.2. Feature Extraction
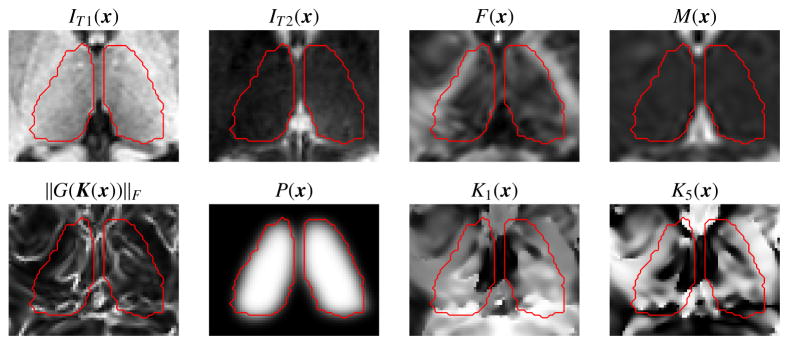
A set of 14 features are extracted at each voxel x in ℬ. The first six features are the voxel location p(x) relative to the bounding box origin and normalized within the range [0, 1] for each axis; T1-w intensity IT1(x); T2-w intensity IT2(x); and the thalamus prior probability P(x) (see Eqn. 1). The remaining features are derived from the DTI images. Using standard methods, we compute the diffusion tensors at every DTI voxel (Cook et al., 2006) and derive the principal eigenvector (PEV) u(x), fractional anisotropy (FA) F(x), and mean diffusivity (MD) M(x) (Basser and Pierpaoli, 1996). See Fig. 4 for examples of IT1(x), IT2(x), P(x), F(x), and M(x).
Figure 4.
Shown are several of the features used in our approach, including the T1-w intensity (IT1(x)), T2-w intensity (IT2(x)), fractional anisotropy (F(x)), mean diffusivity (M(x)), edge map (|G(K(x))|F), the multi-atlas prior (P(x)), and two of the Knutsson space components (K1(x) and K5(x)). The red outline indicates the manually delineated ground truth.
3.2.1. Knutsson direction and edge map
The principal eigenvector u is a useful feature to describe the diffusion at a voxel as it gives the direction of maximum diffusion. However, diffusion may occur in either the direction of u or the opposite direction −u. Given this ambiguity, instead of using u directly, we use the Knutsson mapping, which transforms 3D vectors u and −u to the same five-dimensional (5D) vector K in Knutsson space (Knutsson, 1985), as follows,
where u = (u1, u2, u3). Other properties of this mapping are that it is continuous and preserves distances. For the remainder of our description we will use the slight abuse of notation K(x) = (K1(x), K2(x), K3(x), K4(x), K5(x)) to correspond to K(u(x)), that is the Knutsson space mapping of the principal eigenvector u associated with the location x. Examples of two of the 5D Knutsson space components are shown in Fig. 4.
To find voxels along the boundary between the thalamus and its surroundings, we consider an edge map that highlights voxels where the direction of the principal eigenvector is changing rapidly (Fan et al., 2010). The gradient matrix G is computed given the principal eigenvector in the Knutsson space, as follows,
The edge map is calculated using the Frobenius norm operator || · || on G, as follows,
| (3) |
The complete feature vector f at voxel x is given by
| (4) |
Examples of the many of these features are shown in Fig. 4.
3.3. Random Forest Framework
We use a random forest (RF) (Breiman, 2001) to classify each voxel in the bounding boxes as either thalamus or non-thalamus. The RF framework is trained on a data set with manual segmentations generated by following the protocol described in Sec. 2.2 and Appendix A. We extract the feature vector described in Eqn. 4 at each voxel in the left and right bounding boxes (Eqn. 2) in each of the training data sets. In the case of the right thalamus, the features are mirrored across the y-axis before the features are extracted. This allows us to augment the number of training data sets available and the benefit of training a single RF for both thalami. To account for this mirroring across the y-axis, the x-component of the PEV must be negated, as well as the 2nd and 3rd components of the Knutsson space. The class (thalamus or non-thalamus) is extracted at each voxel in the bounding box from the corresponding binary mask generated by our manual segmentation, where thalamus voxels correspond to 1 and non-thalamus voxels are 0.
After extracting the feature vector and class at each voxel, we build and train our RF framework. Each decision tree in the RF is trained using all samples from the training data. At each decision split, four features are selected at random from the 14 features. The split at a given node is chosen such that the gain of Gini’s diversity Index is maximized (Breiman et al., 1984). The decision tree is grown until all members of a leaf node belong to either the thalamus class or non-thalamus class. The tree growing procedure is repeated until a total of 75 trees in the RF are trained. The optimal number of decision trees was determined by running a leave-one-out cross validation experiment using RFs with between 60 and 90 trees, at increments of five trees. The RF with 75 trees had the highest Dice Similarity Coefficient (see Sec. 4.1 for a definition of this metric) averaged across the left and right thalamus. This RF framework is implemented using MATLAB’s (version R2015b) TreeBagger class.
To apply the RF to a test subject, we extract the feature vector (Eqn. 4) at a given voxel in the bounding box, flipping the features if the voxel is associated with the right bounding box, as was done with the training data sets. We use the trained RF to predict the class at that voxel. To do so, each tree in the RF classifies the test voxel as thalamus or non-thalamus and final classification is decided by taking a majority vote across all trees in the RF. After repeating this procedure for each voxel in the bounding box, we produce a binary map of voxels classified as thalamus. To reduce noise and smooth the final result, the binary map is first smoothed using a morphological closing operation with a 3×3×3 structuring element and then the largest connected component is selected. If the result is for the right thalamus, the resulting segmentation is flipped back across the y-axis to restore it to the proper orientation.
4. Experiments
4.1. Overview and Metrics
In the first experiment, we measure inter-rater variability on nine subjects (five healthy controls (HCs) and four MS patients) that were delineated by two raters using the segmentation protocol outlined in Sec. 2.2 and described in detail in Appendix A. Using this data, the performance of RAFTS is compared with other state-of-the-art methods.
To quantify the performance of the algorithm, we use the Dice Similarity Coefficient (DSC) (Dice, 1945), Hausdorff distance (HD) (Huttenlocher et al., 1993), and mean surface distance (MSD). DSC captures the overlap between the algorithm segmentation and a reference segmentation, whereas HD and MSD are based on the distance between boundaries. DSC is given by
where TP are true positives, FP are false positives, and FN are false negatives. DSC is unitless and the range of DSC is [0, 1] with values closer to 1 being desired.
To compute MSD and HD, the set of boundary voxels are determined as any thalamus voxels that have at least one neighboring voxel in the 18-connected 3-D neighborhood that is classified as non-thalamus. This generates two sets of boundary voxels, BR and BA, associated with a reference segmentation and an algorithm segmentation, respectively. For a given boundary voxel x in BR, the minimum distance d to the set of algorithm boundary voxels BA is defined as
This is similarly defined for a boundary voxel in BA to the set of reference boundary voxels. MSD is the average of the minimum distances for each boundary voxel in both sets,
where |BR| and |BA| are the total number of boundary voxels in the reference and algorithm segmentations, respectively. HD is computed by taking the maximum across all minimum distances,
Both the MSD and HD are reported in units of voxels. The range of possible values for both HD and MSD is [0,1), with smaller values being preferred. Statistical significance tests were carried out using the Wilcoxon signed rank test (Gibbons and Chakraborti, 2011).
4.2. Inter-rater Variability
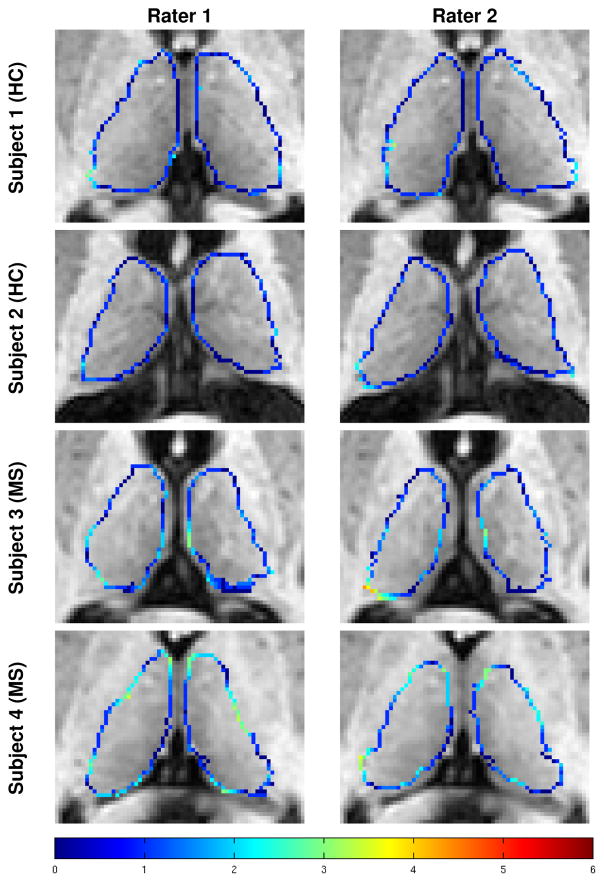
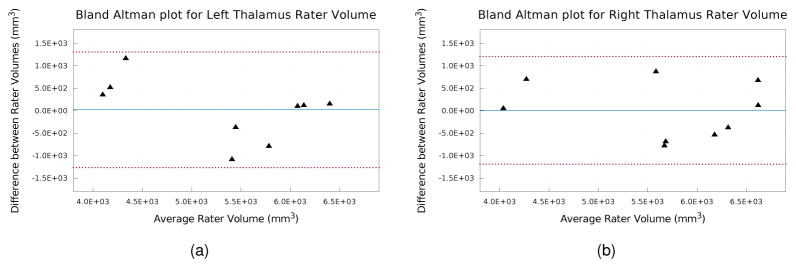
Measuring inter-rater variability in thalamus segmentation is important for two reasons. First, due to the challenges inherent in manual segmentation of the thalamus, we are interested in understanding the variability in the segmentations produced by following the same segmentation protocol. Second, because the manual segmentation by Rater #1 is used as ground truth to evaluate the automatic algorithms, it is important to understand the inter-rater variability to compare it to the performance of the automatic methods. To measure inter-rater variability, nine subjects (five HCs and four relapsing-remitting MS patients) were delineated by two raters following our segmentation protocol (see Sec. 2.2 and Appendix A). Examples of the thalamus segmentations from the two raters are shown in Fig. 5. The color of the contours represents the minimum distance from a voxel to a boundary voxel from the other rater. Table 1 provides the mean thalamus volume, DSC, HD, and the MSD on the manual delineations provided by the two raters. A Bland Altman plot comparing the volumes of the manual segmentations from the two raters is shown in Fig. 6.
Figure 5.
Examples of the manual segmentations on two HCs and two MS patients generated by the two raters following the protocol outlined in Sec. 2.2 and described in detail in Appendix A. Colored voxels are boundary voxels of the thalamus. The color of the contour indicates the absolute minimum distance from a voxel on the surface generated by one rater to the surface of the other rater, with the scale of the distance shown in the color bar in the bottom row.
Table 1. Inter-Rater Variability.
Mean Volume, Dice Similarity Coefficient (DSC), Hausdorff distance (HD), Mean Surface Distance (MSD), and the corresponding standard deviation in parenthesis for each metric, across both the left and right thalami of nine subjects (five HCs and four relapsing-remitting MS patients) delineated by two raters.
| Left Thalamus
|
Right Thalamus
|
|
|---|---|---|
| Rater 1 Volume (mm3) | 5666.65 (±882.46) | 5327.02 (±745.52) |
| Rater 2 Volume (mm3) | 5660.45 (±990.48) | 5306.20 (±1038.14) |
| DSC | 0.819 (±0.048) | 0.814 (±0.042) |
| HD (voxels) | 6.83 (±1.60) | 7.41 (±1.98) |
| MSD (voxels) | 1.220 (±0.222) | 1.224 (±0.252) |
Figure 6.
Bland Altman plots of left and right thalamus volume from manual segmentations generated by the two raters. The solid blue line indicates the mean difference and the dashed red lines indicate the 95% limits of agreement.
Overall, the thalami from the two raters were very similar. This is evident by the mean difference between the volume being almost zero (see Fig. 6), the DSC being above 0.8 with a small standard deviation, and the MSD being only 1.2. The areas with the most disagreement occurred in the inferior and superior portions of the thalami, including the geniculates and the inferior and superior boundaries of the thalamus. The Bland Altman plot (Fig. 6) shows good agreement between the volumes produced by the two raters, with no outliers outside of the 95% limits of agreement and in particular shows no systematic bias. This shows that two raters following our delineation protocol produce consistent segmentations.
4.3. Comparison to Manual Segmentation
To quantify the performance of RAFTS, we compared it with four state-of-the-art thalamus segmentation algorithms and two versions of RAFTS trained by excluding differing portions of the feature vector. From an ongoing multiple sclerosis (MS) study, nine patients were selected and manually delineated in accordance with the protocol outlined in Sec. 2.2. To validate RAFTS, we used delineations from seven of these patients produced by Rater #1; the two excluded patients have lesions around the thalamus. The seven validation data sets are used in a leave-one-out cross validation scheme, with six patients training our RF and testing been carried out on the seventh data set. The standard neurological preprocessing steps described in Sec. 2.1 take 7.25 hours to run. The steps exclusive to RAFTS, including deformable registration of the atlases and applying the RF classifier, take 2.5 hours. Training the RF classifier takes less than an hour.
First we compare the thalamus segmentations to that produced by FreeSurfer (Fischl et al., 2002), a publicly available whole brain segmentation software, and FSL FIRST, a publicly available subcortical brain structure segmentation tool (Patenaude et al., 2011). We also compare with two multi-atlas methods. The NMM-NLSS method registers 12 atlases from the Neuromorphometrics data set1 using Elastix (Klein et al., 2010) and fuses the results using Non-local Spatial Staple (NLSS) (Asman and Landman, 2013). NLSS is a statistical fusion algorithm that integrates the underlying T1-w MRI intensity into the fusion process. The MA-NLSS method registers the manual segmented atlases used to find the thalamus priors using Elastix (Klein et al., 2010) and fuses the results using NLSS (Asman and Landman, 2013). Finally, we compare with RAFTS trained without the thalamus prior feature and RAFTS trained without any features derived from the DTI.
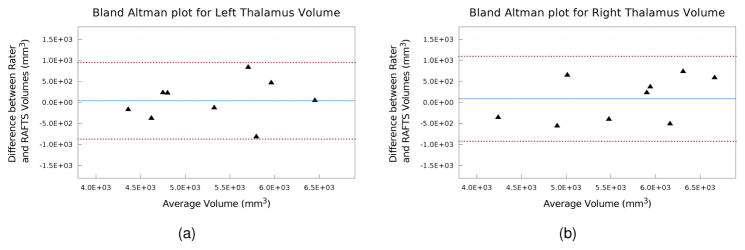
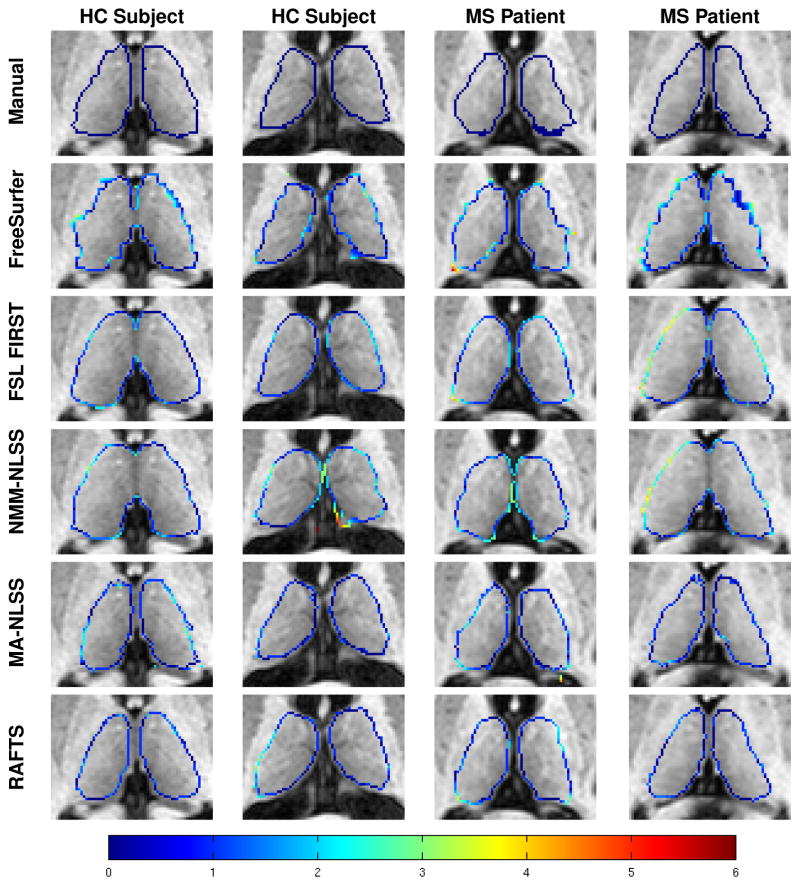
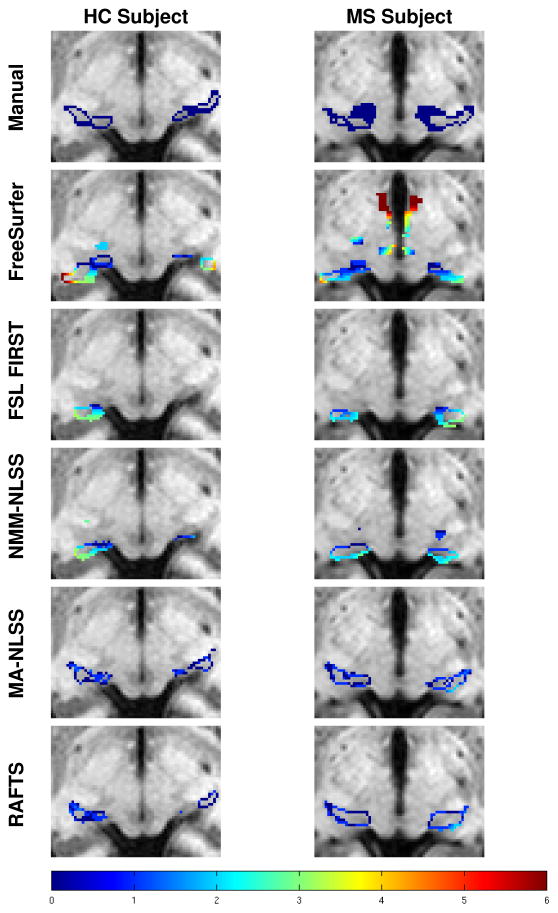
Table 2 shows the mean DSC, HD, and MSD for all the segmentation algorithms. RAFTS has the highest DSC and the lowest HD and MSD compared to the other algorithms. These differences are statistically significant (p < 0.05) in all cases except when comparing the MSD of the left thalamus obtained using MA-NLSS and RAFTS. Figure 7 shows a Bland Altman plot comparing the volumes of the Rater #1’s manual segmentations and the automatic segmentation by RAFTS. We note that the limits of agreement are tighter between the Rater #1 and RAFTS (see Fig. 7) than between Rater #1 and Rater #2 (see Fig. 6). Figure 8 shows some example segmentations of the main body of the thalamus, and Fig. 9 includes examples of segmentations of the inferior thalamus. The colored contour indicates the minimum distance to the manually delineated surface. Qualitatively, FreeSurfer has difficulty segmenting the lateral and medial geniculates and NMM-NLSS typically overestimates the lateral boundaries of the thalamus. RAFTS and MA-NLSS produce results similar to the ground truth since they both incorporate information from an atlas set with corresponding manual delineations produced by the same rater.
Table 2. Method Comparison.
Mean (standard deviation) of the Dice Similarity Coefficient (DSC), Hausdorff Distance (HD), and mean surface distance (MSD) for the left and right thalamus validated against Rater #1. Compared are FreeSurfer (Fischl et al., 2002), FSL FIRST (Patenaude et al., 2011), Non-Local Spatial STAPLE (Asman and Landman, 2013) using either the Neuromorphometrics atlas (NMM-NLSS) or our own thalamus atlas set (MA-NLSS). The * and † indicate a statistically significant difference between the algorithm and RAFTS with p < 0.05 and p < 0.01, respectively.
| Left | Right | ||
|---|---|---|---|
| DSC | FreeSurfer | 0.799 (±0.057)† | 0.823 (±0.024)† |
| FSL FIRST | 0.821 (±0.031)* | 0.843 (±0.027)† | |
| NMM-NLSS | 0.795 (±0.028)† | 0.797 (±0.035)† | |
| MA-NLSS | 0.859 (±0.057)* | 0.874 (±0.016)† | |
|
|
|
||
| RAFTS w/o Prior | 0.842 (±0.028)† | 0.816 (±0.047)† | |
| RAFTS w/o DTI | 0.841 (±0.041)* | 0.825 (±0.046)† | |
|
|
|
||
| RAFTS | 0.882 (±0.033) | 0.890 (±0.013) | |
|
|
|
||
| HD (voxels) | FreeSurfer | 10.79 (±2.63)† | 10.50 (±1.75)† |
| FSL FIRST | 10.94 (±1.22)† | 11.62 (±1.75)† | |
| NMM-NLSS | 10.75 (±3.44)† | 10.58 (±1.79)† | |
| MA-NLSS | 5.61 (±1.85)† | 6.43 (±2.58)* | |
|
|
|
||
| RAFTS w/o Prior | 5.26 (±1.46)† | 5.94 (±1.55)† | |
| RAFTS w/o DTI | 5.05 (±1.20)* | 4.93 (±0.78)* | |
|
|
|
||
| RAFTS | 4.05 (±1.07) | 4.23 (±0.79) | |
|
|
|
||
| MSD (voxels) | FreeSurfer | 1.410 (±0.300)† | 1.296 (±0.111)† |
| FSL FIRST | 1.456 (±0.201)† | 1.333 (±0.158)† | |
| NMM-NLSS | 1.578 (±0.166)† | 1.575 (±0.169)† | |
| MA-NLSS | 0.895 (±0.289) | 0.856 (±0.061)† | |
|
|
|
||
| RAFTS w/o Prior | 1.079 (±0.183)† | 1.294 (±0.328)† | |
| RAFTS w/o DTI | 1.101 (±0.294)* | 1.236 (±0.336)† | |
|
|
|
||
| RAFTS | 0.829 (±0.174) | 0.802 (±0.054) | |
Figure 7.
Bland Altman plots of left and right thalamus volume comparing the manual segmentations from Rater #1 and the automatic segmentation generated by RAFTS. The solid blue line indicates the mean difference and the dashed red lines indicate the 95% limits of agreement.
Figure 8.
Examples of thalamus segmentations shown with a colored contour overlaid on the corresponding axial T1- w MR image. The rows from top to bottom are the ground truth manual segmentation of Rater #1, and segmentations generated by FreeSurfer, FSL FIRST, NMM-NLSS, MA-NLSS, and RAFTS, respectively. The columns show two example healthy control (HC) subjects and two MS patients. The color contour indicates the absolute minimum distance from a voxel on the surface of the segmentation to the manually delineated surface of Rater #1 (top row). The color bar in the bottom row shows the scale of the distance.
Figure 9.
Examples of thalamus segmentations of the lateral and medial geniculates shown with a colored contour overlaid on an inferior axial T1-w MR slice. The rows from top to bottom are the ground truth manual segmentation of Rater #1, and segmentations generated by FreeSurfer, FSL FIRST, NMM-NLSS, MA-NLSS, and RAFTS, respectively. The columns show an example healthy control (HC) subject and MS patient. The color contour indicates the minimum distance from a voxel on the surface of a segmentation to the manually delineated surface of Rater #1.
5. Thalamus Volume Study
We carried out a pilot study examining the change in thalamic volume between age-matched HCs and MS patients. We use a set of 42 age-matched subjects from the same MS study (21 HC and 21 MS subjects) to carry out a volumetric study on thalamus atrophy in MS. The MS and HC subjects had a mean (±SD) age of 33.6 (±8.0) and 34.5 (±8.4), respectively. All MS patients had a disease sub-type of relapsing-remitting. Subject demographics are summarized in Table 3.
Table 3.
Demographic information for the age-matched cohort comparison between MS patients (all with the relapsing-remitting sub-type of MS) and HCs.
| Healthy Controls | MS Patients | |
|---|---|---|
|
|
|
|
| No. of Subjects (Male/Female) | 21 (13/8) | 21 (16/5) |
| Mean Age in years (range) | 34.5 (22–52) | 33.6 (21–52) |
| Mean Disease Duration in years (range) | 0 | 5 (0–12) |
Thalamus volumes were computed using RAFTS and then normalized by intracranial volume (ICV) to produce the thalamus fraction. ICV was computed using the brain masks produced by the skull-stripping algorithm (Carass et al., 2011). The thalamus fractions of the HC and MS cohorts are given in Table 4.
Table 4.
Mean (standard deviation) of the thalamus fraction of the intracranial volume for the left and right thalami of our two cohorts of age-matched healthy controls (HC) and MS patients.
| HC | MS | |
|---|---|---|
| Left | 3.68 × 10⁻³ (±2.66 × 10⁻⁴) | 3.50 × 10⁻³(±5.25 × 10⁻⁴) |
| Right | 3.75 × 10⁻³(±1.90 × 10⁻⁴) | 3.57 × 10⁻³(±5.07 × 10⁻⁴) |
To quantify the difference in thalamus fraction, the thalamus fraction ratio was calculated by dividing the thalamus fraction of each HC by that of its age-matched MS pair and the mean was taken across all pairs. A ratio greater than one indicates that the thalamus is larger in the HC subjects compared to their age-matched MS pair. We found that the mean left thalamus fraction ratio was 1.076 (p = 0.0630) and the mean right thalamus fraction ratio was 1.073 (p = 0.0680). This indicates that the HC thalamus is 7.6% and 7.3% larger compared to age-matched MS subjects, although both results were not statistically significant.
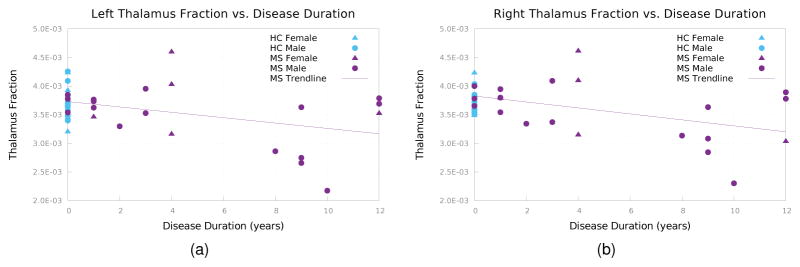
Figure 10 shows the thalamus fractions versus disease duration (DD), with the HCs plotted with DD = 0. The relationship between MS thalamus fractions and DD had a Pearson correlation coefficient of −0.3842 (p = 0.0855) for the left thalamus fraction and −0.4419 (p = 0.0449) for the right thalamus fraction.
Figure 10.
Thalamus fraction vs. disease duration for (a) the left thalamus and (b) right thalamus.
In both HC and MS subjects, the left thalamus fractions were smaller than the right thalamus fractions. In HCs, the mean ratio between left and right thalamus was 0.983 and in MS, this ratio was 0.982 (p = 0.0853 and p = 0.0735, respectively). This difference in left and right thalamus fractions has not been reported in other studies of MS patients and we find that this difference was not statistically significant. Our finding for the HCs is consistent with a previous study of thalamic volume in HCs by (Szabó et al., 2003), which found no statistically significant asymmetrical differences in the thalamus.
6. Discussion
In our experiment comparing RAFTS with other state-of-the-art algorithms and manual segmentations, RAFTS has higher Dice scores of 0.878 and 0.890 for the left and right thalamus, respectively. The NMM-NLSS method is hindered because the commonly-used Neuromorphmetric atlas set does not include the medial and lateral geniculates in their segmentations. As a result, these inferior nuclei are not properly segmented in the final NMMNLSS segmentations, as seen in Fig. 9. Furthermore, the atlases tend to overestimate the thalamus volume by positioning the lateral thalamus boundary too far laterally. FreeSurfer also has difficulty segmenting the lateral and medial geniculates. The MA-NLSS method uses our manually segmented atlases, delineated using the protocol in Sec. 2.2 (detailed in Appendix A) and these segmentations include the medial and lateral geniculates. Therefore, MA-NLSS is able to find the geniculates accurately. RAFTS also uses these atlases to find the thalamus prior and is able to segment the geniculate. In addition, RAFTS includes DTI features in our RF framework. By including these features the lateral boundaries of the thalamus, which are difficult to find using only T1-w images, can be better estimated, improving the DSC.
In the small pilot study calculating the change in the thalamus fraction of brain volume across a small set of relapsing-remitting MS and HC subjects, we find a decrease of 7.3% and 7.6% in the left and right thalamus of MS subjects, but the results are not statistically significant. Due to the reported performance shortcomings of the other methods (see Table 2), we believe that studying the volume trends of output from those methods would misrepresent the underlying cohort behavior. As such, we have chosen to not include other existing segmentation methods in our pilot study.
Other studies (Cifelli et al., 2002; Houtchens et al., 2007) of thalamic volume have found a larger difference in thalamus fraction between MS and HC, with Cifelli et al. (2002) reporting a difference of 17% and Houtchens et al. (2007) reporting a difference of 16.8%. There are differences between the study performed in this paper and the aforementioned studies. The subjects used in this study are younger, with an mean age of 33.6 years compared to 51.5 in Cifelli et al. (2002) and 42.0 in Houtchens et al. (2007). The average disease duration in this study is 5 years, compared to 18.5 years in Cifelli et al. (2002) and 9.7 years in Houtchens et al. (2007). Finally, we only used relapsing-remitting MS patients in our study, while Cifelli et al. (2002) only studied secondary progressive MS patients in their in-vivo study and Houtchens et al. (2007) primarily studied relapsing-remitting MS patients, but included some secondary and primary progressive MS patients. If we assume a linear decrease in thalamic fraction per DD years, then we can extrapolate to a representative estimate of the case of a mean DD of 9.7 years—the reported DD in Houtchens et al. (2007). In our case, this would give a difference of 14.2% and 14.7% between HC and MS patients for the left and right thalamus fractions, respectively, which is comparable to the decrease of 16.8% reported by Houtchens et al. (2007).
7. Conclusion
We have presented RAFTS, an automatic algorithm to segment the thalamus using multimodal imaging data and thalamus priors. We register a set of atlases to obtain a thalamus prior and extract a set of features derived from T1-w, T2-w, and DTI to train a random forest. In a comparison with three other state-of-the-art algorithms using nine subjects with manual delineations, RAFTS obtained higher DSC, lower HD, and lower MSD for the left and right thalamus. Averaging over the nine subjects, RAFTS produced DSC of 0.882 and 0.890, HD of 4.05 and 4.23 voxels, and MSD of 0.829 and 0.802 voxels for the left and right thalami, respectively. In all cases except for the comparison of MSD between MA-NLSS and RAFTS for the left thalamus, the difference between RAFTS and the state-of-art-algorithm was statistically significant with p < 0.05. In a small pilot study comparing thalamic fraction of 21 MS and 21 HC, we find a decrease of 7.3% (p = 0.0630) in the thalamic fraction of the left thalamus of MS subjects and a decrease of 7.6% (p = 0.0680) in the thalamic fraction of the right thalamus of MS subjects compared to HC. Future work includes segmenting the individual thalamus nuclei by using probabilistic tractography and computing thalamic nuclei priors, based on the nuclei priors from the ICBM atlas and manually delineated thalamic nuclei parcellation, and using the binary mask as an initialization for a deformable model (Ye et al., 2013) to find the surface of the thalamus with subvoxel accuracy.
Supplementary Material
Acknowledgments
This work was supported by the NIH/NINDS grants R21-NS082891 and R01-NS056307. Jeffrey Glaister is supported by the Natural Sciences and Engineering Research Council of Canada.
Appendix A. Thalamus Segmentation Protocol
In this section, the steps of the thalamus segmentation protocol are provided in detail. The protocol is a combination of the protocols by Fan et al. (2010) and Power et al. (2015).
In MIPAV (Medical Image Processing, Analysis, and Visualization, http://mipav.cit.nih.gov/), open the co-registered T1-w and FA volumes. By default, the volumes load in axial view.
In the FA volume, locate the lateral ventricle, third ventricle, internal capsule and stria medullaris. The ventricles show up as dark regions in the FA volume. The internal capsule shows up as bright regions and form the lateral boundaries of the thalamus.
The structures found in step 2 give the approximate location of the thalamus. Adjust the contrast of the FA volume to clearly see the edges of the thalamus.
Open the MIPAV powerpaint tools and select the 2times2 paintbrush.
In the axial slices, paint the thalamus in areas of the FA volume between the ventricles and internal capsule. These voxels appear as the same intensity as gray matter.
Continue painting the thalamus in axial slices until you reach the inferior and superior parts of the thalamus, where the FA volume is unreliable for segmentation.
Save the preliminary thalamus segmentation as a mask.
In the T1-w volume, locate the thalamus and nearby structures and adjust the contrast.
Open the preliminary thalamus segmentation as a mask in the powerpaint tools.
Open the T1-w volume with the thalamus mask in triplanar view to see coronal and sagittal views of the thalamus.
Scroll through the preliminary thalamus mask in coronal view and adjust the mask using the paintbrush and eraser based. Most of the adjustments are the lateral boundaries of the thalamus, which appears as gray matter intensities. Furthermore, the lateral and medial geniculates are found. For corrections, we divide the thalamus into three sections: posterior thalamus, middle thalamus, and anterior thalamus.
In the posterior thalamus, the thalamus is bordered by the lateral ventricle and superior cistern. The thalamus appears very round, which can be used to inform the general shape of the lateral boundaries.
In the anterior thalamus, the thalamus loosely appears as an upside-down rounded right angle triangle. The caudate can be used to indicate the most lateral point of the thalamus and the third ventricle indicates the medial boundaries and most inferior point of the thalamus. The lateral ventricles give the superior boundary.
The middle thalamus is where the lateral and medial geniculates occur. Starting from the posterior, scroll through the thalamus in the anterior direction in the coronal view. The boundaries of the main body of the thalamus (not including the geniculates) are similar as steps 12 and 13, so adjust the boundaries accordingly.
The lateral and medial geniculates are small gray matter structures inferior to the rest of the thalamus. As you progress through the coronal slices, the lateral geniculate moves laterally and eventually detaches from the main body of the thalamus and eventually connects to the optic tract. The medial geniculate does not detach.
Once you have adjusted the boundaries in coronal view and painted the geniculates, the thalamus segmentation must be adjusted in axial view to ensure that each slice is consistent with the previous slice. Iterate between the coronal view and axial view, adjusting the boundary in areas where the thalamus is blocky or spiky.
Once the coronal and axial views of the thalamus look consistent and realistic, scroll through the sagittal view and check that there are no blocky or spiky areas.
Save the thalamus segmentation mask.
Footnotes
The Neuromorphometrics data set is available for purchase from http://neuromorphometrics.com/.
Publisher's Disclaimer: This is a PDF file of an unedited manuscript that has been accepted for publication. As a service to our customers we are providing this early version of the manuscript. The manuscript will undergo copyediting, typesetting, and review of the resulting proof before it is published in its final citable form. Please note that during the production process errors may be discovered which could affect the content, and all legal disclaimers that apply to the journal pertain.
References
- Aljabar P, Heckemann RA, Hammers A, Hajnal JV, Rueckert D. Multi-atlas based segmentation of brain images: atlas selection and its effect on accuracy. Neuroimage. 2009;46:726–738. doi: 10.1016/j.neuroimage.2009.02.018. [DOI] [PubMed] [Google Scholar]
- Anbazhagan P, Carass A, Bazin PL, Prince JL. Automatic Estimation of Mid Sagittal Plane and AC-PC alignment based on Nonrigid Registration. 3rd International Symposium on Biomedical Imaging (ISBI 2006); 2006. pp. 828–831. [Google Scholar]
- Asman AJ, Landman BA. Non-local statistical label fusion for multi-atlas segmentation. Medical Image Analysis. 2013;17:194–208. doi: 10.1016/j.media.2012.10.002. [DOI] [PMC free article] [PubMed] [Google Scholar]
- Basser PJ, Pierpaoli C. Microstructural and physiological features of tissues elucidated by quantitativediffusion-tensor MRI. Journal of Magnetic Resonance, Series B. 1996;111:209–219. doi: 10.1006/jmrb.1996.0086. [DOI] [PubMed] [Google Scholar]
- Bazin PL, Pham DL. Homeomorphic brain image segmentation with topological and statistical atlases. Medical Image Analysis. 2008;12:616–625. doi: 10.1016/j.media.2008.06.008. [DOI] [PMC free article] [PubMed] [Google Scholar]
- Braak H, Braak E. Alzheimer’s disease affects limbic nuclei of the thalamus. Acta Neuropathologica. 1991;81:261–268. doi: 10.1007/BF00305867. [DOI] [PubMed] [Google Scholar]
- Breiman L. Random Forests. Machine Learning. 2001;45:5–32. [Google Scholar]
- Breiman L, Friedman J, Olshen R, Stone C. Classification and Regression Trees. Wadsworth; 1984. [Google Scholar]
- Byne W, Buchsbaum MS, Mattiace LA, Hazlett EA, Kemether E, Elhakem SL, Purohit DP, Haroutunian V, Jones L. Postmortem Assessment of Thalamic Nuclear Volumes in Subjects With Schizophrenia. Am J Psychiatry. 2002;159:59–65. doi: 10.1176/appi.ajp.159.1.59. [DOI] [PubMed] [Google Scholar]
- Carass A, Cuzzocreo J, Wheeler MB, Bazin PL, Resnick SM, Prince JL. Simple paradigm for extra-cerebral tissue removal: Algorithm and analysis. NeuroImage. 2011;56:1982–1992. doi: 10.1016/j.neuroimage.2011.03.045. [DOI] [PMC free article] [PubMed] [Google Scholar]
- Cifelli A, Arridge M, Jezzard P, Esiri MM, Palace J, Matthews PM. Thalamic neurodegeneration in multiple sclerosis. Annals of Neurology. 2002;52:650–653. doi: 10.1002/ana.10326. [DOI] [PubMed] [Google Scholar]
- Collins DL, Zijdenbos AP, Baare WFC, Evans AC. ANIMAL+INSECT: Improved cortical structure segmentation. In: Kuba A, Saamal M, Todd-Pokropek A, editors. 16th Inf. Proc. in Med. Imaging (IPMI 1999); Berlin Heidelberg: Springer; 1999. pp. 210–223. volume 1613 of Lecture Notes in Computer Science. [Google Scholar]
- Cook P, Bai Y, Nedjati-Gilani S, Seunarine K, Hall M, Parker G, Alexander D. Camino: open-source diffusion-MRI reconstruction and processing. 14th scientific meeting of the international society for magnetic resonance in medicine; Seattle WA, USA. 2006. [Google Scholar]
- Cullen T, Walker M, Parkinson N, Craven R, Crow T, Esiri M, Harrison P. A postmortem study of the mediodorsal nucleus of the thalamus in schizophrenia. Schizophrenia Research. 2003;60:157–166. doi: 10.1016/s0920-9964(02)00297-9. [DOI] [PubMed] [Google Scholar]
- Danos P, Baumann B, Krämer A, Bernstein HG, Staucha R, Krell D, Falkai P, Bogerts B. Volumes of association thalamic nuclei in schizophrenia: a postmortem study. Schizophrenia Research. 2003;60:141–155. doi: 10.1016/s0920-9964(02)00307-9. [DOI] [PubMed] [Google Scholar]
- Dice LR. Measures of the amount of ecologic association between species. Ecology. 1945;26:297–302. doi: 10.2307/1932409. URL: http://dx.doi.org/10.2307/1932409. [DOI] [Google Scholar]
- Duan Y, Li X, Xi Y. Thalamus Segmentation from Diffusion Tensor Magnetic Resonance Imaging. International Journal of Biomedical Imaging. 2007;5:1–5. doi: 10.1155/2007/90216. [DOI] [PMC free article] [PubMed] [Google Scholar]
- Fan X, Thompson M, Bogovic JA, Bazin PL, Prince JL. A novel contrast for DTI visualization for thalamus delineation. Proceedings of SPIE Medical Imaging (SPIE-MI 2010); San Diego, CA. February 14–17, 2010; 2010. pp. 762533–762533.–9. [DOI] [PMC free article] [PubMed] [Google Scholar]
- Fischl B, Salat DH, Busa E, Albert M, Dieterich M, Haselgrove C, van der Kouwe A, Killiany R, Kennedy D, Klaveness S, Montillo A, Makris N, Rosen B, Dale AM. Whole Brain Segmentation: Automated Labeling of Neuroanatomical Structures in the Human Brain. Neuron. 2002;33:341–355. doi: 10.1016/s0896-6273(02)00569-x. [DOI] [PubMed] [Google Scholar]
- Gibbons JD, Chakraborti S. Nonparametric statistical inference. Springer; 2011. [Google Scholar]
- Glaister J, Carass A, Stough JV, Calabresi PA, Prince JL. Thalamus parcellation using multi-modal feature classification and thalamic nuclei priors. Proceedings of SPIE Medical Imaging (SPIE-MI 2016); San Diego, CA. February 27–March 3, 2016; 2016. pp. 97843J–97843J.–6. [DOI] [PMC free article] [PubMed] [Google Scholar]
- Houtchens MK, Benedict R, Killiany R, Sharma J, Jaisani Z, Singh B, Weinstock-Guttman B, Guttmann CR, Bakshi R. Thalamic atrophy and cognition in multiple sclerosis. Neurology. 2007;69:1213–1223. doi: 10.1212/01.wnl.0000276992.17011.b5. [DOI] [PubMed] [Google Scholar]
- Huttenlocher DP, Klanderman GA, Rucklidge WJ. Comparing images using the hausdorff distance. IEEE Transactions on Pattern Analysis and Machine Intelligence. 1993;15:850–863. [Google Scholar]
- Jellinger KA. Post mortem studies in Parkinson’s disease–is it possible to detect brain areas for specific symptoms? J Neural Transm Suppl. 1999;56:1–29. doi: 10.1007/978-3-7091-6360-3_1. [DOI] [PubMed] [Google Scholar]
- Jonasson L, Hagmann P, Pollo C, Bresson X, Richero Wilson C, Meuli R, Thiran JP. A level set method for segmentation of the thalamus and its nuclei in DT-MRI. Signal Processing. 2007;87:309–321. [Google Scholar]
- Klein S, Staring M, Murphy K, Viergever MA, Pluim JPW. Elastix: A toolbox for intensity-based medical image registration. IEEE Trans Med Imag. 2010;29:196–205. doi: 10.1109/TMI.2009.2035616. [DOI] [PubMed] [Google Scholar]
- Knutsson H. Producing a Continuous and Distance Preserving 5-D Vector Representation of 3-D Orientation. IEEE Computer Society Workshop on Computer Architecture for Pattern Analysis and Image Database Management; 1985. pp. 175–182. [Google Scholar]
- Landman B, Farrell J, Patel NL, Mori S, Prince JL. DTI fiber tracking: the importance of adjusting DTI gradient tables for motion correction. CATNAP - a tool to simplify and accelerate DTI analysis. Proc. Org Human Brain Mapping 13th Annual Meeting; 2007. p. 138. [Google Scholar]
- Le Bihan D, Breton E. Imagerie de diffusion in-vivo par résonance magnétique nucléaire. C R Acad Sci (Paris) 1985;301:1109–1112. [Google Scholar]
- Liu L, Glaister J, Sun X, Carass A, Tran TD, Prince JL. Segmentation of Thalamus from MR images via Task-Driven Dictionary Learning. Proceedings of SPIE Medical Imaging (SPIE-MI 2016); San Diego, CA. February 27–March 3, 2016; 2016. pp. 97843H–97843H.–7. [DOI] [PMC free article] [PubMed] [Google Scholar]
- Marrakchi-Kacem L, Poupon C, Mangin JF, Poupon F. Multi-contrast deep nuclei segmentation using a probabilistic atlas. 7th International Symposium on Biomedical Imaging (ISBI 2010); 2010. pp. 61–64. [Google Scholar]
- Mazziotta JC, Toga AW, Evans A, Fox P, Lancaster J. A probabilistic atlas of the human brain: theory and rationale for its development the international consortium for brain mapping (ICBM) NeuroImage. 1995;2:89–101. doi: 10.1006/nimg.1995.1012. [DOI] [PubMed] [Google Scholar]
- Morel A. Stereotactic atlas of the human thalamus and basal ganglia. Informa Healthcare; USA: 2007. [Google Scholar]
- Patenaude B, Smith SM, Kennedy D, Jenkinson MA. A Bayesian Model of Shape and Appearance for Subcortical Brain Segmentation. NeuroImage. 2011;56:907–922. doi: 10.1016/j.neuroimage.2011.02.046. [DOI] [PMC free article] [PubMed] [Google Scholar]
- Power BD, Wilkes FA, Hunter-Dickson M, van Westen D, Santillo AF, Walterfang M, Nilsson C, Velakoulis D, Looi JCL. Validation of a protocol for manual segmentation of the thalamus on magnetic resonance imaging scans. Psychiatry Research: Neuroimaging. 2015;232:98–105. doi: 10.1016/j.pscychresns.2015.02.001. [DOI] [PubMed] [Google Scholar]
- Sherman SM, Guillery R. Exploring the Thalamus. Elsevier; 2000. [Google Scholar]
- Sled JG, et al. A non-parametric method for automatic correction of intensity non-uniformity in MRI data. IEEE Trans Med Imag. 1998;17:87–97. doi: 10.1109/42.668698. [DOI] [PubMed] [Google Scholar]
- Stough JV, Ye C, Ying SH, Prince JL. Thalamic Parcellation from Multi-Modal Data using Random Forest Learning. 10th International Symposium on Biomedical Imaging (ISBI 2013); 2013. pp. 852–855. [DOI] [PMC free article] [PubMed] [Google Scholar]
- Stough JV, Glaister J, Ye C, Ying SH, Prince JL, Carass A. Automatic method for thalamus parcellation using multi-modal feature classification. 17th International Conference on Medical Image Computing and Computer Assisted Intervention (MICCAI 2014); 2014. pp. 169–176. [DOI] [PMC free article] [PubMed] [Google Scholar]
- Studholme C, Constable RT, Duncan JS. Accurate alignment of functional EPI data to anatomical MRI using a physics-based distortion model. IEEE Trans Med Imag. 2000;19:1115–1127. doi: 10.1109/42.896788. [DOI] [PubMed] [Google Scholar]
- Szabó CÁ, Lancaster JL, Xiong J, Cook C, Fox P. MR imaging volumetry of subcortical structures and cerebellar hemispheres in normal persons. American Journal of Neuroradiology. 2003;24:644–647. [PMC free article] [PubMed] [Google Scholar]
- Westin CF, Maier SE, Mamata H, Nabavi A, Jolesz FA, Kikinis R. Processing and visualization for diffusion tensor MRI. Medical Image Analysis. 2002;6:93–108. doi: 10.1016/s1361-8415(02)00053-1. [DOI] [PubMed] [Google Scholar]
- Wylezinska M, Cifelli A, Jezzard P, Palace J, Alecci M, Matthews P. Thalamic neurodegeneration in relapsing-remitting multiple sclerosis. Neurology. 2003;60:1949–1954. doi: 10.1212/01.wnl.0000069464.22267.95. [DOI] [PubMed] [Google Scholar]
- Ye C, Bogovic JA, Ying SH, Prince JL. Parcellation of the Thalamus Using Diffusion Tensor Images and a Multi-object Geometric Deformable Model. Proceedings of SPIE Medical Imaging (SPIE-MI 2013); Orlando, FL. February 9–14, 2013; 2013. pp. 866909–866909.–7. [DOI] [PMC free article] [PubMed] [Google Scholar]
- Zarei M, Patenaude B, Damoiseaux J, Morgese C, Smith S, Matthews PM, Barkhof F, Rombouts S, Sanz-Arigita E, Jenkinson M. Combining shape and connectivity analysis: An MRI study of thalamic degeneration in Alzheimer’s disease. NeuroImage. 2010;49:1–8. doi: 10.1016/j.neuroimage.2009.09.001. [DOI] [PubMed] [Google Scholar]
- Ziyan U, Tuch D, Westin CF. Segmentation of Thalamic Nuclei from DTI Using Spectral Clustering. 9th International Conference on Medical Image Computing and Computer Assisted Intervention (MICCAI 2006); 2006. pp. 807–814. [DOI] [PubMed] [Google Scholar]
Associated Data
This section collects any data citations, data availability statements, or supplementary materials included in this article.


