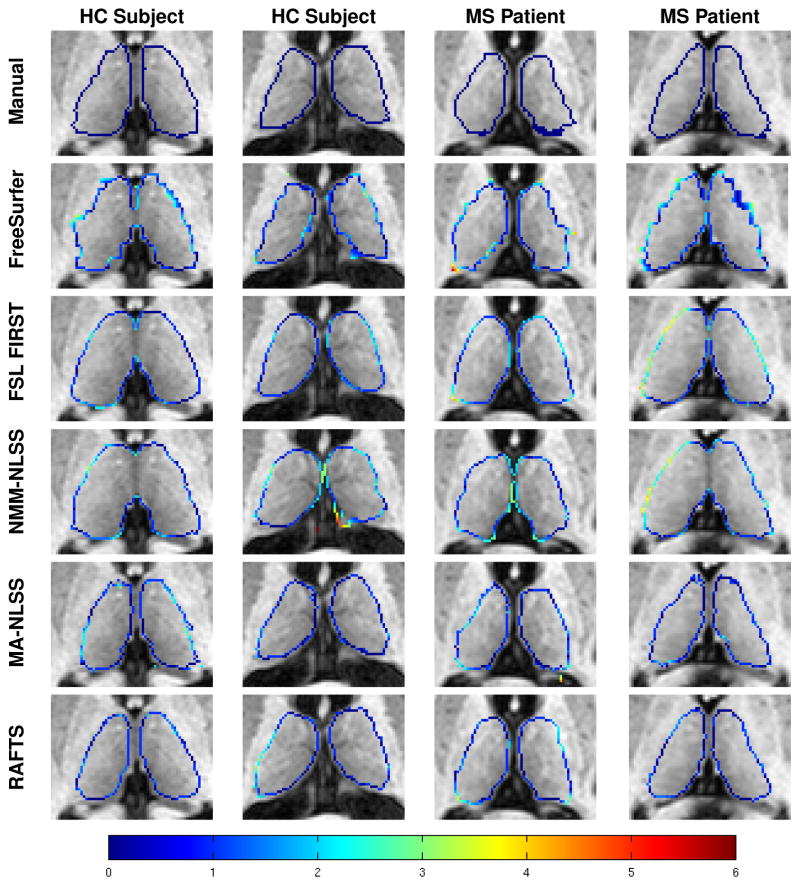
Figure 8.
Examples of thalamus segmentations shown with a colored contour overlaid on the corresponding axial T1- w MR image. The rows from top to bottom are the ground truth manual segmentation of Rater #1, and segmentations generated by FreeSurfer, FSL FIRST, NMM-NLSS, MA-NLSS, and RAFTS, respectively. The columns show two example healthy control (HC) subjects and two MS patients. The color contour indicates the absolute minimum distance from a voxel on the surface of the segmentation to the manually delineated surface of Rater #1 (top row). The color bar in the bottom row shows the scale of the distance.

