Abstract
A study was made by a combination of 3D electron tomography reconstruction methods and N2 adsorption for determining the fractal dimension for nanometric MoS2 and MoS2/Co catalyst particles. DFT methods including Neimarke-Kiselev’s method allowed to determine the particle porosity and fractal arrays at the atomic scale for the S-Mo-S(Co) 2D- layers that conform the spherically shaped catalyst particles. A structural and textural correlation was sought by further characterization performed by x-ray Rietveld refinement and Radial Distribution Function (RDF) methods, electron density maps, computational density functional theory methods and nitrogen adsorption methods altogether, for studying the structural and textural features of spherical MoS2 and MoS2/Co particles. Neimark-Kiselev’s equations afforded the evaluation of a pore volume variation from 10 to 110 cm3/g by cobalt insertion in the MoS2 crystallographic lattice, which induces the formation of cavities and throats in between of less than 29 nm, with a curvature radius r k < 14.4 nm; typical large needle-like arrays having 20 2D layers units correspond to a model consisting of smooth surfaces within these cavities. Decreasing D P, D B, D I and D M values occur when Co atoms are present in the MoS2 laminates, which promote the formation of smoother edges and denser surfaces that have an influence on the catalytic properties of the S-Mo-S(Co) system.
Introduction
Catalytic materials are the main pillars of liquid fuels production from hydrocarbons and its role is vital for supplying energy needs from petroleum natural resources. The layered transition metal sulfides (LTMS) such as molybdenum di-sulfide (MoS2) were used extensively in the petroleum refining industry for more than five decades and these catalysts are referred by the catalysis research community as the “workhorses” of refining processes1. From the industrial viewpoint cobalt and nickel are used as promoters of MoS2 catalytic materials for enhancing deep hydrodesulfurization (HDS)2–7 for clean fuels production containing ultra-low amounts of sulfur; however, from a basic viewpoint there is no a single model for explaining the promoter effects of Co and Ni. Previous research work by A.L. Farragher and P. Cossee8 proposed a model that explains the promoter effect of Co and Ni atoms in terms of a “pseudo-intercalation” effect, where Co atoms are located at octahedral sites of MoS2 layered phase edges, i.e., (1010) type planes; also, B. Delmon et al. proposed a model based on the formation of a mix phase of MoS2 and Co9S8, which could be formed by synergic interactions in the unsupported systems9; H. Topsøe et al. used Mössbauer spectroscopy for demonstrating that chemical bonding occurs at the edge planes of Cobalt-Sulfur-Molybdenum, thus coining the term “CoMoS” phase10; also, Chianelli et al. proposed a “Rim-Edge” model in an attempt for defining the seat of catalytic activity and specific sites within the MoS2 stacking structure, which correlates with the activity and selectivity of unsupported systems11. More recently, Lauritsen et al. reported a combined study using scanning tunneling microscopy (STM) and computer assisted numerical simulations involving plane wave density functional theory methods12,13, which led them to conclude that metallic states in the cobalt-sulfur bonding play a key role14. Furthermore, MoS2 layered packing structures produce diverse morphologies like nanotubes, needles, fullerenes and spheres, as described by Remškar et al.15, Camacho-Bragado et al.16, Blanco et al.17 and Ramos et al.18. The latter author used TEM and DFT simulations19 to show that electron donation of cobalt promoters occurs by synergic contact between Co9S8 and MoS2 phases. Furthermore, non-conventional TEM sample holders allowed in-situ and operando experiments with these phases, as reported by Ramos et al., Helveg et al. and Casillas et al. These authors showed carburization effects on fresh MoS2 and MoS2/Co catalysts20, crystal formation from molybdenum oxide precursors in the presence of H2S and H2 as well as variations of micromechanical properties21,22. In other works, STEM 3D tomography was used, as reported by P.A Midgley and R.E. Dunin-Borkowski, to characterize low dimensional materials, proteins and organic specimens23, while D.A. Muller resolved the atomic structure and chemical bonding of some crystallites24. Ziese et al. implemented STEM-electron tomography techniques to determine the gold nanoparticles distribution over a SBA-15 type matrix25, while Arslan et al. reported the use of this technique for locating gold particles supported over alumina oxide matrix26. The present work afforded a multi-technique analysis of MoS2 and Cobalt-promoted MoS2 catalytic particles and a calculation was made of the surface fractal dimension at the molecular level for assessing better the textural and structural features promoted by Co insertion into the MoS2 lattice. Surface fractal dimensionality is related to the roughness, steps and kinks at the molecular scale and it plays a key role for heterogeneous catalysts, as pointed out by several authors27–30. We propose this parameter as an important one for gauging catalytic behavior of Co-promoted-MoS2 catalysts and as a complement of “electronic effects” induced by insertion of the Co promoter, because it modifies both textural and structural properties of MoS2; this is the first time that fractal dimensionality is shown as a result of Co-promoter insertion in spherical particles of MoS2 and the profound effects on both texture and structure as verified in the case of MoS2/Co system.
Results and Discussion
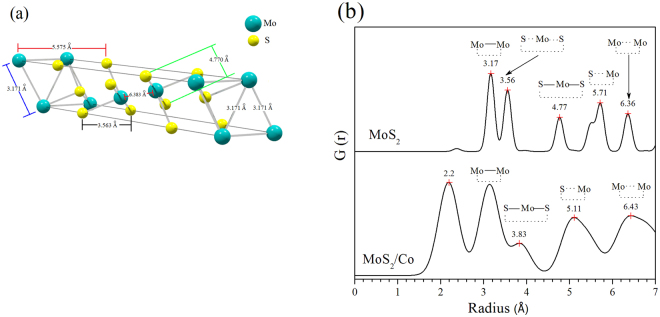
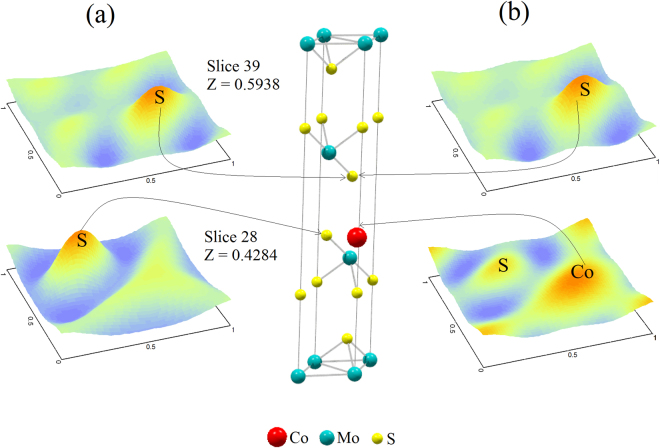
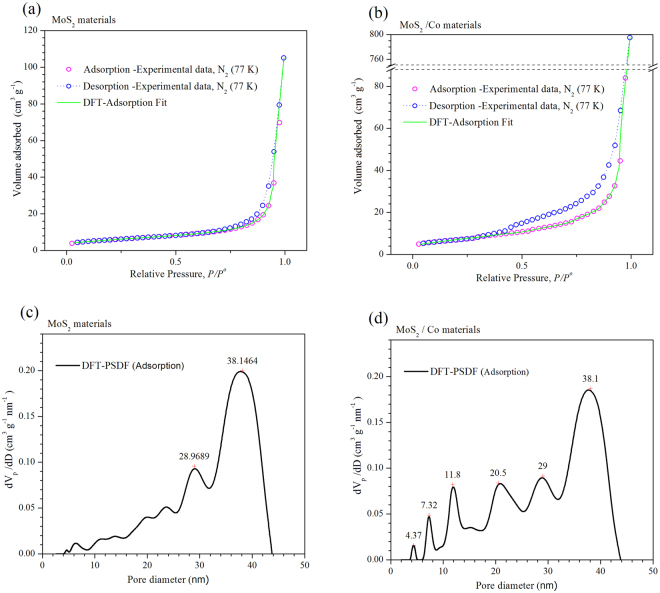
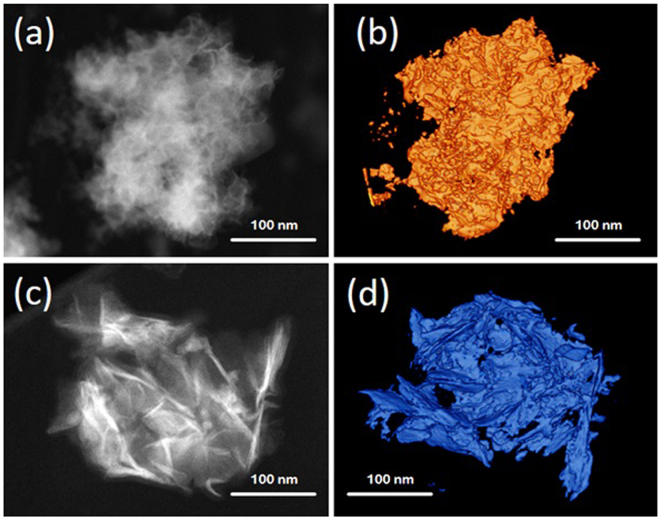
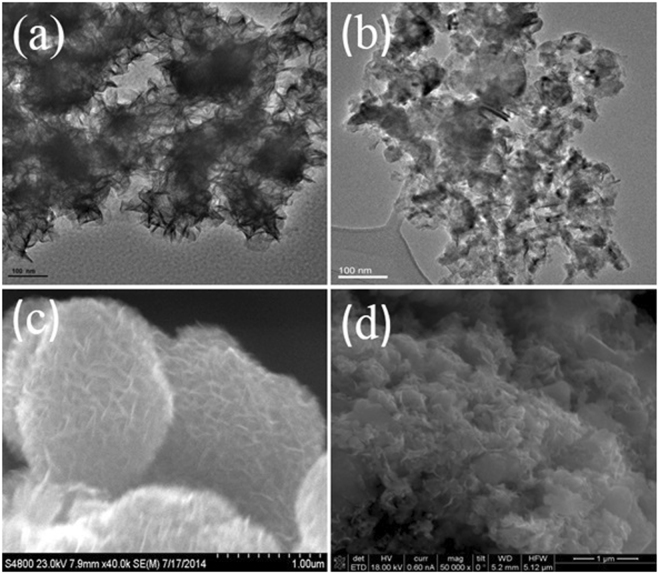
The crystallographic features of hydrothermally as-synthesized Cobalt promoted MoS2 catalysts were determined by X-ray powder diffraction (Table 1); this comprised the use of Rietveld’s refinement method to verify the MoS2 rhombohedral (R3m) symmetry, in agreement with recent work from Wang et al.31, from which a comparative analysis was performed as shown by Fig. 1, where one observes that a crystallographic variation occurs following cobalt addition during synthesis (Table 2), which can be explained in terms of Frenkel´s point defects32 (Table 3) caused by interstitial occluded cobalt atoms into the laminar MoS2 structure, as described by Lauritsen et al.14. This explains the expansion of about 12.9% (from 0.7500 to 0.8465) of c-axis in the primitive lattice, as demonstrated by Radial Distribution Function results, which indicates interatomic distance variations of 11.7% for S····Mo and 24.5% for S—Mo—S, with respect to S···Mo···S distance of 3.56 Å (Table 4); these are consistent with displacements of Mo atoms to interstitial sites as confirmed on electron density maps in Figs 2a,b and 3a,b with face ab normalized to 1 and with c = 0.42 (slice 28) and c = 0.59 (slice 39); some specific data are reported in Tables 1-3). In fact, an increase of 10.4% (from 0.16667 to 0.18400) in occupancy position of sulfur O S(2) at the MoS2/Co lattice implies a stoichiometry variation for MoS2 to MoS(2+y), thus leading to a molecular increase of crystal density of about 2.14% (from 4.989 to 5.096 g/cm3) as reported in Table 1); also, the mean crystallites size of MoS2 vary from 2 nm to 8 nm when cobalt is inserted, as discussed before18 and indicated in Table 2. The nitrogen adsorption profile of both MoS2 and MoS2/Co is consistent with type III isotherms, as shown in Fig. 4a,b with a pore size distribution with maxima at 29 and 38 nm for MoS2 while these figures vary from 4 nm to 38 nm for MoS2/Co as presented in Fig. 4c,d, thus indicating weak interactions between adsorbate and absorbent; also, a H3 type hysteresis loop (IUPAC standards) is observed in both cases, at the relative pressure (P/P°) interval between 0.4 and 0.45, thus leading to a model akin with slit-shaped pores, which was verified by electron tomography, as presented in Fig. 5a,b, thus indicating a higher N2 uptake after comparing MoS2 and MoS2/Co (i.e., a variation of more than 727%); the adsorption isotherm at P/P°∼ 0.8 suggests the formation of condensate at the pores neck for P/P° > 0.9, i.e., a liquid–vapor menisci move towards the cavity of the particles, until pores filling with condensates occurs. With the purpose of understanding better this phenomena a series of DFT numerical simulations were completed to determine relevant pore structure parameters (i.e., S BET /S DFT, V p DFT and Φ DFT)as shown in Table 5 ; We propose this parameter as an important one for gauging catalytic behavior of Co-promoted-MoS2 catalysts and as a complement of “electronic effects” induced by insertion of the Co promoter, because it modifies both textural and structural properties of MoS2; this is the first time that fractal dimensionality is shown as a result of Co-promoter insertion in spherical particles of MoS2 and the profound effects on both texture and structure as verified in the case of MoS2/Co system32. Thus, a summary of these results is presented in Table 5 where one observes an increase of 29% in S BET /S DF, with a further increase up to 110% for V p DFT as a result of the overall increase of N2 uptake upon insertion of cobalt atoms in the MoS2 lattice. The calculation of Fractal dimension from transmission electron micrographs and the use of Neimark-Kiselev equation in D s(adsorption/desorption) led to determine a decrease of 12% after insertion of cobalt (i.e., details are shown in Tables 6–7), thus implying a lower fractal dimension as exhibited in Fig. 5c,d for r k values within the interval 6.05–40.44 nm for the MoS2 spherically shaped particles while r k values fall within the interval 4.95–20.08 nm for MoS2/Co system that is spread on the surface, which is observed by STEM tomography (Table 7) as presented in Fig. 6a,b, from which the fractal dimension is obtained using D P, D B , D I and D M methods, i.e., 1.17 and 1.05 are the fractal dimensions for MoS2 and MoS2/Co, while D B decreases from 1.71 to 1.57due to the surface topology associated with cobalt addition; D I indicates dispersion of the surface due to the cobalt presence and finally D M determines a dense surface on MoS2/Co as observed by larger array of laminates revealed by high-resolution STEM (insets of Fig. 6a,b). Additionally, a second run of fractal calculations were done using TEM-2D images, from which fractal values show a decreasing trend with the cobalt presence, with values of D P (25.0%), D B (5.3%), D I (17.0%) and D M (16.0%) as well as when using scanning electron images with values of D P (34.7%), D B (28.0%), D I (23.4%) and D M (1.9%). See Tables 8–9.
Table 1.
Lattice parameters obtained by Rietveld refinement from x-ray powder diffraction for pure spherical shaped MoS2 .
| MoS2 R 3 m H (160) | Lattice: Rhombohedral | Occupancy | ||||
|---|---|---|---|---|---|---|
| Atomic fractional coordinates | ||||||
| Atom | Type | Site | x | y | z | |
| Mo (1) | Mo4+ | 3a | 0.0000 | 0.0000 | 1.0000 | 0.16667 |
| S (1) | S2− | 3a | 0.0000 | 0.0000 | 0.2500 | 0.16667 |
| S (2) | S2− | 3a | 0.0000 | 0.0000 | 0.7500 | 0.16667 |
| Lattice parameters (Å) | Angles | |||||
| a | b | c | α | β | γ | Density (g cm−3) |
| 3.1710 | 3.1710 | 18.3445 | 90° | 90° | 120° | 4.992 |
Figure 1.
Powder x-ray diffraction patterns and Rietveld refinement for (a) MoS2 and (b) Co/MoS2 samples, it is possible to observe a sharp peak at (003)-basal plane when cobalt atoms are present, compared to pure MoS2 .
Table 2.
Lattice parameters obtained by Rietveld refinement from x-ray powder diffraction for cobalt promoted MoS2 .
| Material | Molybdenite crystallite size (nm) | Density (g cm−3) | Atomic fractional coordinates of S (2) | O S (2) | ||
|---|---|---|---|---|---|---|
| x | y | z | ||||
| MoS2 | 2 (0.4) | 4.989 | 0.0000 | 0.0000 | 0.7500 | 0.16667 |
| MoS2/Co | 8 (0.8) | 5.096 | 0.0000 | 0.0000 | 0.8465 | 0.18400 |
The number in parenthesis corresponds to the standard deviation.
O S (2): S (2) occupancy (see Table 1).
Table 3.
Statistical parameters after Rietveld refinement for both cases.
| Material | R p | R wp | χ 2 | R exp |
|---|---|---|---|---|
| MoS2 | 2.95 | 4.67 | 2.52 | 2.94 |
| MoS2/Co | 1.30 | 1.74 | 2.07 | 1.21 |
Table 4.
Radial distribution function peaks values of MoS2 and Co/MoS2 samples.
| Material | Interatomic distances r (Å) | ||||
|---|---|---|---|---|---|
| Mo—Mo | S····Mo····S | S—Mo—S | S····Mo | Mo····Mo | |
| MoS2 * | 3.171 | 3.563 | 4.770 | 5.575 | 6.383 |
| MoS2 # | 3.170 | 3.560 | 4.720 | 5.710 | 6.360 |
| MoS2/Co# | 3.140 | 5.110 | 6.430 | ||
*Theoretical interatomic distances.
#Obtained by XRD.
—Bond, ----Only distance.
Figure 2.
Radial distribution plots for (a) MoS2 crystallographic lattice (a = b = 3.1710 and c = 18.3445 Å) (SG: R3mH). (b) Co/MoS2 it is possible to observe a shifting of Mo-Mo and S-Mo-S peaks, as well the appearance of a new peak at 2.2 Å when cobalt atoms are present in the MoS2 lattice.
Figure 3.
(a) Electron density maps to indicate cobalt atoms at the MoS2 crystallographic lattice and (b) for Cobalt atoms into the MoS2 lattice. (Data calculated using information from powder X-ray diffraction and DFT numerical simulations).
Figure 4.
(a and b) Nitrogen adsorption/desorption isotherms run at 77 K for both cases MoS2 and Co/MoS2. (c and d) Numerical simulation of pore diameter distribution for MoS2 samples and (d) Co/MoS2 samples.
Figure 5.
Scanning Transmission Electron Tomography for both MoS2 and Co/MoS2 samples. It is possible to determine surface dispersion and change of pore volume when cobalt atoms are present on the sample. Inset: High resolution image of specific section on both cases, one can observe large laminates growth due to addition of cobalt atoms into the MoS2 lattice.
Table 5.
Specific surface area, pore volume and mean pore size for both cases.
| Material | S BET / S DFT (m2g−1) | V P DFT (mm3 g−1) | Φ DFT (nm) |
|---|---|---|---|
| MoS2 | 20/21 | 10 | 29/38 |
| MoS2/Co | 26/27 | 110 | 4/7/12/21/29/38 |
Values were obtained from numerical DFT simulations and experimental isotherms.
Table 6.
Fractal dimension parameters as calculated by Neimark-Kiselev from isotherm curves for MoS2 and Co/MoS2 samples.
| Method of analysis | Materials | |
|---|---|---|
| MoS2 | MoS2/Co | |
| D S (Adsorption) | 2.47 (6.05–40.44)# | 2.18 (4.95–20.08)# |
| D S (Desorption) | 2.52 (6.05–49.40)# | 2.25 (6.05–16.44)# |
Ds scaling interval ∈ [2, 3]; #Radius of curvature (nm).
Table 7.
Fractal dimension parameters and porosity as calculated by different methods from STEM images.
| Material | Method of analysis | ||||
|---|---|---|---|---|---|
| D p | D B | D I | D M | STEM-porosity (%) | |
| MoS2 | 1.17 ± 0.01 | 1.71 ± 0.02 | 1.83 ± 0.01 | 1.86 ± 0.01 | 14.6 |
| MoS2/Co | 1.05 ± 0.01 | 1.57 ± 0.01 | 1.64 ± 0.01 | 2.21 ± 0.01 | 23.6 |
D P, D B, D I and D M are measured from STEM-images; D p scaling interval ∈ [1, 2]; D B scaling interval ∈ [1, 2]; D I scaling interval ∈ [1, 2]; D M ≥ 1.
Figure 6.
High resolution transmission electron microscopy images: (a and b) are TEM-images (scale bar 100 nm) corresponding to MoS2 and Co/MoS2 respectively. (c and d) are scanning electron microscopy images (scale bar 1.0 µm) of MoS2 and Co MoS2 using both techniques, to determine surface dispersion when cobalt atoms are added, as reported before18.
Table 8.
Fractal dimension parameters as calculated by different methods from high-resolution TEM images for MoS2 and Co/MoS2.
| Method of analysis | TEM images scale bar at 100 nm | |
|---|---|---|
| MoS2 | MoS2 /Co | |
| D p | 1.67 ± 0.25 | 1.25 ± 0.24 |
| D B | 1.69 ± 0.08 | 1.60 ± 0.06 |
| D I | 1.68 ± 0.37 | 1.40 ± 0.02 |
| D M | 2.00 ± 0.09 | 2.32 ± 0.17 |
D P, D B, D I and D M are measured from TEM-images; D p scaling interval ∈ [1, 2]; D B scaling interval ∈ [1, 2]; D I scaling interval ∈ [1, 2]; D M ≥ 1.
Table 9.
Fractal dimension parameters as calculated by different methods from SEM images for both MoS2 and cobalt promoted MoS2 samples.
| Method of analysis | SEM-images at 1.0 µm | |
|---|---|---|
| MoS2 | MoS2 /Co | |
| D p | 1.64 ± 0.03 | 1.07 ± 0.02 |
| D B | 1.90 ± 0.01 | 1.37 ± 0.01 |
| D I | 1.92 ± 0.01 | 1.47 ± 0.01 |
| D M | 1.98 ± 0.01 | 2.02 ± 0.02 |
D P, D B, D I and D M are measured from TEM-images; D p scaling interval ∈ [1, 2]; D B scaling interval ∈ [1, 2]; D I scaling interval ∈ [1, 2]; D M ≥ 1.
Conclusion
The abovementioned results led us to conclude that chemical state and geometric features together might play an important role, i.e., cobalt atom radius is about 20% larger than sulfur atoms while cobalt ions (Co+) are about 40% the size of sulfur ion S2−; also, the specific hydrothermal synthesis method could contribute too. It was found that Co tends to occupy MoS2 edges, as determined by Rietveld’s refinement method, thus the “CoMoS phase” should be formed. Moreover, the use of Neimark-Kiselev set of equations led us to conclude that cobalt insertion into the MoS2 crystalline arrays induce a pore volume increase from 10 to 110 cm3/g, which provokes an increase of the diameter of cavities as well as formation of throats with diameters smaller than 29 nm and r k < 14.4 nm, which explains the higher N2 consumption during the isotherm runs. Additionally, cobalt insertion promotes formation of large needle-like laminates with a stacking average of ~20 2D layers, as observed by high resolution STEM, with D s values falling in a region where radii of curvature are smaller (14.4 nm), which means that smoother surfaces are formed inside the cavities. Also, a decreasing trend of D P, D B, D I and D M was found with insertion of cobalt in the MoS2 laminates (Table 4b–d), which is interpreted as enhancing the crystallite edge smoothing and surface density. This fundamental approach allowed to understand better the behavior of “CoMoS” phase type catalysts. Further work using a similar approach for “spent” MoS2/Co and MoS2 catalytic phases is underway for studying the role of carbon in the catalytic properties of those phases.
Experimental Methods
Catalyst Preparation
A black powder precipitate was synthesized by mixing 3 mmol of sodium molybdate (Na2MoO4.2H2O) and 9 mmol of thioacetamide (CH3CSNH2) when dissolved in 30 mL of deionized water, and then 0.5 g of sodium silicate (Na2SiO3.9H2O) was added into the solution under violent stirring. The pH value of the solution was adjusted to 6.0 by dropping 12 M hydrochloric acid (HCl) solution. 0.50 g of cobalt chloride (CoCl2) was added to the solution before the hydrothermal reaction at a precise temperature, i.e., 220 °C [inside reactor chamber] for 4 h, thus allowing a natural cooldown. The catalyst was washed using a 1 M of Sodium Hydroxide (NaOH) to remove possible residues, mainly silicic acid and this was dried at 200 °C in autoclave. The synthesis follows the stoichiometry reaction: 1) 6CoCl26H2O + 12Na2MoO4 + Na2SiO3 + 26HCl → H4SiCo6Mo12O40 + 26NaCl + 47H2O + 6Cl2. 2) CH3CSNH2 + 2H2O → CH3COOH + NH3 + H2S. 3) H4SiCo6Mo12O40 + 27H2S → 12Co0:5MoS2 + H2SiO3 + 3H2SO4 + 25H2O (for more information see Ramos et al.18).
Powder XRD and Rietveld refinement
All diffraction patterns were obtained with a Bruker Advance D-8 diffractometer fitted with Bragg-Brentano geometry, using CuKα radiation and a Lynxeye type detector. The intensities were obtained in the 2-theta ranges between 10 and 100° with a step of 0.019447° and a measuring time of 10 s per point. The crystalline structures were refined by Rietveld’s method using TOPAS-Academic software33. All theoretical crystal density was calculated by the following equation: ρ crystal = (Z)(MM)(Avogadro’s number)−1/Cell volume; where Z is the number of molecules per cell and MM is the molecular weight. Radial Distribution: The distance (r) between atoms in MoS2 and MoS2(Co) crystallites was obtained by Radial Distribution Function G(r) up to 6.5 Å, in a Siemens D500 diffractometer fitted with a molybdenum anode X-ray tube. The intensities were measured in a step-by-step mode of 0.01°, from 2 to 110° (2θ), using the Radiale program34.
Adsorption/Desorption isotherms
All the measurements of N2 sorption isotherms were obtained at 76 K using a Quantachrome Autosorb 3B instrument under N2 and He gases (UHP grade) conditions. Prior to isotherms runs, all the samples were outgassed for 12 h at 473 K. The specific surface areas were calculated from desorption isotherms using BET equation, while the pore structure parameters were determined by non-local density functional theory.
Experimental HRTEM microanalysis and Electron Tomography
Imaging of ultra-high resolution TEM was performed in an FEI Tecnai F20 instrument operating at 200 kV in STEM mode. Images were acquired every 2°, from −70 to + 70, totaling 71 images for each tilt series. The HRTEM images were collected in a JEOL ARM (200 F) instrument at operational voltage of 200 kV, which was fitted with a Cs corrector (CEOS GmbH) and FEG-STEM/TEM unit; a HAADF probe size was set to 0.095 nm with a current of 23.2 pA for bright field imaging, the condenser lens aperture size was set to 40 µm. A camera length (CL) of 8 cm/6 cm and collection angle of 68–280 mrad/90–270 mrad was set for STEM images, to eliminate contributions from un-scattered beams. The specimens were prepared for electron microscopy by crushing the powder between two glass slides, and rubbing a holey carbon grid across the crushed powder to capture the material. All images were reconstructed using Gatan Digital Micrograph® computational software and these were aligned with respect to each other using the center of mass of the particle35. These were reconstructed using total variation (TV) regularization, and visualized using the tomviz software36.
Computational Software
Novawin 11.03 package was used for all the numerical simulations for porous size distribution and textural properties.
Electronic supplementary material
Acknowledgements
This project was funded by Mexican Science Council [CONACyT-México] and Energy Ministry [Sener] under solicitation grant #177077 (IMP project Y.61006). Instituto Mexicano del Petróleo for usage of laboratory equipment and facilities. I.A. was supported by the Laboratory Directed Research and Development Program at the Pacific Northwest National Laboratory. To the Universidad Autónoma de Ciudad Juárez for economical support in article processing by grant #SEP-23-007-B of Programa para el Desarrollo Profesional Docente para el tipo superior (PRODEP).
Author Contributions
M. Ramos was in charge of chemical synthesis and scanning electron imaging. F. Galindo-Hernández completed all computer assisted numerical simulations. I. Arslan and T. Sanders performed electron tomography measurements and computer assisted reconstruction. J.M. Domínguez is the principal investigator on this particular Energy project in charge of design and supervision of all experiments. This manuscript was mainly typed by M. Ramos, F. Galindo, I. Arlsan and J.M. Domínguez.
Competing Interests
The authors declare that they have no competing interests.
Footnotes
Electronic supplementary material
Supplementary information accompanies this paper at 10.1038/s41598-017-12029-8.
Publisher's note: Springer Nature remains neutral with regard to jurisdictional claims in published maps and institutional affiliations.
References
- 1.Chianelli RR, Berhault G, Torres B. Unsupported transition metal sulfide catalysts: 100 years of science and application. Catal. Today. 2009;147:275–286. doi: 10.1016/j.cattod.2008.09.041. [DOI] [Google Scholar]
- 2.Villareal A, et al. Importance of the sulfidation step in the preparation of highly active NiMo/SiO2/Al2O3 hydrodesulfurization catalysts. Catal. Today. 2015;250:60–65. doi: 10.1016/j.cattod.2014.03.035. [DOI] [Google Scholar]
- 3.Olivas A, Alonso G, Fuentes S. The catalytic activity of Ni/W bimetallic sulfide nanostructured catalysts in the hydrodesulfurization of dibenzothiophene. Top. Catal. 2006;39:175–179. doi: 10.1007/s11244-006-0054-1. [DOI] [Google Scholar]
- 4.Siadati MH, Alonso G, Torres B, Chianelli R. Open flow hot isostatic pressing assisted synthesis of unsupported MoS2 catalysts. Appl. Catal. A. 2006;305:160–168. doi: 10.1016/j.apcata.2006.02.056. [DOI] [Google Scholar]
- 5.Stanislaus A, Marafi A, Rana MS. Recent advances in the science and technology of ultra low sulfur diesel (ULSD) production. Catal. Today. 2010;153:1–68. doi: 10.1016/j.cattod.2010.05.011. [DOI] [Google Scholar]
- 6.Morales-Ortuño JC, Ortega-Domínguez RA, Hernández-Hipólito O, Bokhimi X, Klimova TE. HDS performance of NiMo catalysts supported on nanostructured materials containing titania. Catal. Today. 2016;271:127–139. doi: 10.1016/j.cattod.2015.07.028. [DOI] [Google Scholar]
- 7.Gates BC, et al. Catalysts tor emerging energy applications. MRS Bulletin. 2008;33:429–435. doi: 10.1557/mrs2008.85. [DOI] [Google Scholar]
- 8.Farragher A.L. & Cossee P. Proceedings of the 5th International Congress on Catalysis, North-Holland, Amsterdam, 1301 (1973).
- 9.Hagenbach G, Courty P, Delmon B. Physicochemical investigations and catalytic activity measurements on crystallized molydbenum sulfide-cobalt sulfide mixed catalysts. J.Catal. 1973;31:264–273. doi: 10.1016/0021-9517(73)90333-3. [DOI] [Google Scholar]
- 10.Candia R. et al. Proceedings of the 8th International Congress on Catalysis, Dechema, Frankfurt-an-Main, 2, 375 (1984).
- 11.Daage MM, Chianelli RR. Structure-Function Relations in Molybdenum Sulfide Catalysts: The “Rim-Edge” Model. J. Cat. 1994;149:414–427. doi: 10.1006/jcat.1994.1308. [DOI] [Google Scholar]
- 12.Perdew JP, Burke K, Ernzerhof M. Generalized Gradient Approximation Made Simple. Phys. Rev. Lett. 1996;77:3865. doi: 10.1103/PhysRevLett.77.3865. [DOI] [PubMed] [Google Scholar]
- 13.Hammer B, Hansen LB, Nørskov. K. Improved adsorption energetics within density-functional theory using revised Perdew-Burke-Ernzerhof functionals. Phys. Rev. B. 1999;59:7413. doi: 10.1103/PhysRevB.59.7413. [DOI] [Google Scholar]
- 14.Lauritsen JV, et al. Location and coordination of promoter atoms in Co- and Ni-promoted MoS2-based hydrotreating catalysts. J. Catal. 2007;249:220–233. doi: 10.1016/j.jcat.2007.04.013. [DOI] [Google Scholar]
- 15.Remškar M, Viršek M, Mrzel A. The MoS2 nanotube hybrids. Appl. Phys. Lett. 2009;95:133122. doi: 10.1063/1.3240892. [DOI] [Google Scholar]
- 16.Camacho-Bragado GA, Elechiguerra JL, Yacaman M. Characterization of low dimensional molybdenum sulfide nanostructures. J. Mat. Char. 2008;59:204–212. doi: 10.1016/j.matchar.2006.12.009. [DOI] [Google Scholar]
- 17.Blanco E, Afanasiev P, Berhault G, Uzio D, Loridant S. Resonance Raman spectroscopy as a probe of the crystallite size of MoS2 nanoparticles. Comp. Rendus Chimie. 2016;19:1310–1314. doi: 10.1016/j.crci.2015.08.014. [DOI] [Google Scholar]
- 18.Ramos MA, et al. Spherical MoS2 micro particles and their surface dispersion due to addition of cobalt promoters. Rev. Mex. Fís. 2011;57:220–223. [Google Scholar]
- 19.Ramos MA, Berhault G, Ferrer DA, Torres B, Chianelli RR. HRTEM and molecular modeling of the MoS2–Co9S8 interface: understanding the promotion effect in bulk HDS catalysts. Catal. Sci. Technol. 2012;2:164–178. doi: 10.1039/C1CY00126D. [DOI] [Google Scholar]
- 20.Ramos M, et al. In-situ HRTEM study of the reactive carbide phase of Co/MoS2 catalyst. Ultramicroscopy. 2013;127:64–69. doi: 10.1016/j.ultramic.2012.07.012. [DOI] [PubMed] [Google Scholar]
- 21.Casillas G, et al. Elasticity of MoS2 Sheets by Mechanical Deformation Observed by in Situ Electron Microscopy. J. Phys. Chem. C. 2015;119:710–715. doi: 10.1021/jp5093459. [DOI] [PMC free article] [PubMed] [Google Scholar]
- 22.Hansen LP, Johnson E, Brorson M, Helveg S. Growth Mechanism for Single- and Multi-Layer MoS2 Nanocrystals. J. Phys. Chem. C. 2014;118:22768–22773. doi: 10.1021/jp5069279. [DOI] [Google Scholar]
- 23.Midgley PA, Dunin-Borkowski RE. Electron tomography and holography in materials science. Nature Mater. 2009;8:271–280. doi: 10.1038/nmat2406. [DOI] [PubMed] [Google Scholar]
- 24.Muller DA. Structure and bonding at the atomic scale by scanning transmission electron microscopy. Nature Mater. 2009;8:263–270. doi: 10.1038/nmat2380. [DOI] [PubMed] [Google Scholar]
- 25.Ziese U, de Jong KP, Koster AJ. Electron tomography: a tool for 3D structural probing of heterogeneous catalysts at the nanometer scale. Applied Catalysis A: General. 2004;260:71–74. doi: 10.1016/j.apcata.2003.10.014. [DOI] [Google Scholar]
- 26.Arslan I, Marquis EA, Homer M, Hekmaty MA, Bartelt NC. Towards better 3-D reconstructions by combining electron tomography and atom-probe tomography. Ultramicroscopy. 2008;108:1579–1585. doi: 10.1016/j.ultramic.2008.05.008. [DOI] [PubMed] [Google Scholar]
- 27.Niemantsverdriet J.W. et al. in Catalysis – Biocatalytic Processes Encyclopedia of Life Support Systems (EOLSS) (2007).
- 28.Somorjai G.A. Introduction to Surface Chemistry and Catalysis (ed. Wiley) (New York, 1994).
- 29.Ertl G. Oscillatory Catalytic Reactions at Single-Crystal Surfaces. Adv. Catal. 1990;37:213–277. [Google Scholar]
- 30.Imbihl R, Ertl G. Oscillatory Kinetics in Heterogeneous Catalysis. Chem. Rev. 1995;95:697–733. doi: 10.1021/cr00035a012. [DOI] [Google Scholar]
- 31.Wang S, et al. A New Molybdenum Nitride Catalyst with Rhombohedral MoS2 Structure for Hydrogenation Applications. J. Am. Chem. Soc. 2015;137:4815–4822. doi: 10.1021/jacs.5b01446. [DOI] [PubMed] [Google Scholar]
- 32.Galindo-Hernández F, Domínguez JM, Portales B. Structural and textural properties of Fe2O3/γ-Al2O3 catalysts and their importance in the catalytic reforming of CH4 with H2S for hydrogen production. J. Power Sources. 2015;287:13–24. doi: 10.1016/j.jpowsour.2015.04.015. [DOI] [Google Scholar]
- 33.Coelho A. TOPAS-academic V4.1, Coelho Software, Brisbane, Australia (2007).
- 34.Magini M, et al. Programme en FORTRAN IV pour l’analyse des données expérimentales relatives à la diffusion des rayons X par des substances liquides, amorphes et microcristallisées. J. Appl. Cryst. 1972;5:14. doi: 10.1107/S0021889872008659. [DOI] [Google Scholar]
- 35.Sanders T, Prange M, Akatay C, Binev P. Physically motivated global alignment method for electron tomography. Adv. Struct. Chem. Imaging. 2015;1:11–11. doi: 10.1186/s40679-015-0005-7. [DOI] [Google Scholar]
- 36.Sanders T. Discrete Iterative Partial Segmentation Technique (DIPS) for Tomographic Reconstruction. IEEE Trans. Comp. Imag. 2016;2:71–82. doi: 10.1109/TCI.2016.2521340. [DOI] [Google Scholar]
Associated Data
This section collects any data citations, data availability statements, or supplementary materials included in this article.


