Abstract
T cells are defined by a heterodimeric surface receptor (the T cell receptor or TCR) that mediates recognition of pathogen-associated epitopes via interactions with peptide-major histocompatibility complexes (pMHC). TCRs are generated by genomic rearrangements of the germline TCR locus, a process termed V(D)J recombination that has the potential to generate a staggering diversity of TCRs (estimated to range from 1015 1 to as high as 1061 2 possible receptors). Despite this potential diversity, TCRs from T cells that recognize the same pMHC epitope often share conserved sequence features, suggesting that it may be possible to predictively model epitope specificity. Here we report the in-depth characterization of ten epitope-specific CD8+ TCR repertoires from mice and humans representing 4600+ in-frame, single cell-derived TCRαβ sequence pairs from 110 subjects. We developed novel analytical tools to characterize these epitope-specific repertoires: a distance measure on the space of TCRs that permits clustering and visualization (TCRdist), a robust repertoire diversity metric (TCRdiv) that accommodates the low number of paired public receptors observed when compared to single chain analyses, and a distance-based classifier capable of assigning previously unobserved TCRs to characterized repertoires with robust sensitivity and specificity. Our analysis demonstrates that each epitope-specific repertoire contains a clustered group of receptors that share core sequence similarities, together with a dispersed set of diverse “outlier” sequences. By identifying shared motifs in core sequences, we were able to highlight key conserved residues driving essential elements of TCR recognition. These analyses provide insights into the generalizable, underlying features of epitope-specific repertoires and adaptive immune recognition.
To explore the determinants of epitope-specificity, we applied pMHC tetramer selection together with single-cell paired TCRαβ amplification to first generate a dataset of 4,635 paired, in-frame TCR sequences from 10 different epitope-specific repertoires, pooled from 78 mice and 32 humans in the context of 4 different viral infections. Four of the mouse epitopes are presented during influenza virus infection of C57/BL6 (B6) mice: DbNP366 (NP), DbPA224 (PA), DbPB1-F262 (F2), and KbPB1703 (PB1), whereas the other three are generated during murine cytomegalovirus infection in B6 mice: KbM38316 (M38), Kbm139419 (m139), and DbM45985 (M45). The human epitopes are derived from influenza virus - HLA-A*0201-M158 (M1), human cytomegalovirus - HLA-A*0201–pp65495 (pp65), and Epstein-Barr virus - HLA-A*0201-BMLF1280 (BMLF). To fully explore the repertoire landscape of this extensive dataset, we developed an analytical framework that leverages αβ pairing to characterize gene segment usage and epitope selection in the broader context of TCR repertoire diversity.
We first analyzed this sequence dataset using established features of TCR repertoire analysis that include length, charge, and hydrophobicity of the CDR3 regions, clonal diversity (within individuals), and amino acid sequence sharing (across individuals) following well-established approaches to repertoire analysis3–6 (Extended Data Tables 1–2 and Extended Data Fig. 1). Mean values for CDR3 length, charge, and hydrophobicity tightly clustered for the majority of the epitopes, and all CDR3 features showed substantially overlapping ranges (Extended Data Fig. 1a). We found negative correlations between CDR3 charge and peptide charge (R=−0.86, P<0.002) and between CDR3 length and peptide length (R=−0.67, P<0.05), suggesting that charge and length complementarity may play a role in pMHC recognition for certain epitopes (Extended Data Fig. 1b). Whereas substantial levels of sharing or publicity7–9 were observed for individual chains (e.g. PB1, PA, and m139 α-chains; M38 and NP β-chains), lower levels of sharing between individuals were observed when the paired αβ receptor was considered (Extended Data Table 1), with three epitopes (F2, m139, and pp65) having no fully public receptors in our dataset.
By using paired single-cell TCRαβ sequencing, we were able to determine whether V and J segment usage was correlated both within a chain (e.g., Vα-Jα, Vβ-Jβ) and across chains (e.g., Vα-Vβ, Vα-Jβ). To quantify these gene preferences we constructed a background, non-epitope-selected repertoire by combining publicly available sequence data from high-throughput repertoire profiling experiments10–13 (see Methods) and compared the gene frequencies in our epitope-specific repertoires to those seen in this background set. We found varying degrees of dominance of single and pairwise gene associations, as depicted in the segment diagrams in Figures 1a, 2a and Extended Data Figure 2. Each epitope-specific response is characterized by an overrepresentation of individual genes as well as significant gene pairing preferences. This is perhaps best exemplified by PB1, where TRAV3-3, TRAJ26, and TRBJ2-3 are all used in the single largest block of receptors, though this triple can associate with multiple TRBV segments. The Jensen-Shannon Divergence between each epitope-specific gene frequency distribution and the background distribution was used to quantify the total magnitude of gene preference (Fig. 1b). We quantified the degree of gene usage covariation between pairs of segments using the Adjusted Mutual Information (AMI) score (Fig. 1c).
Figure 1.
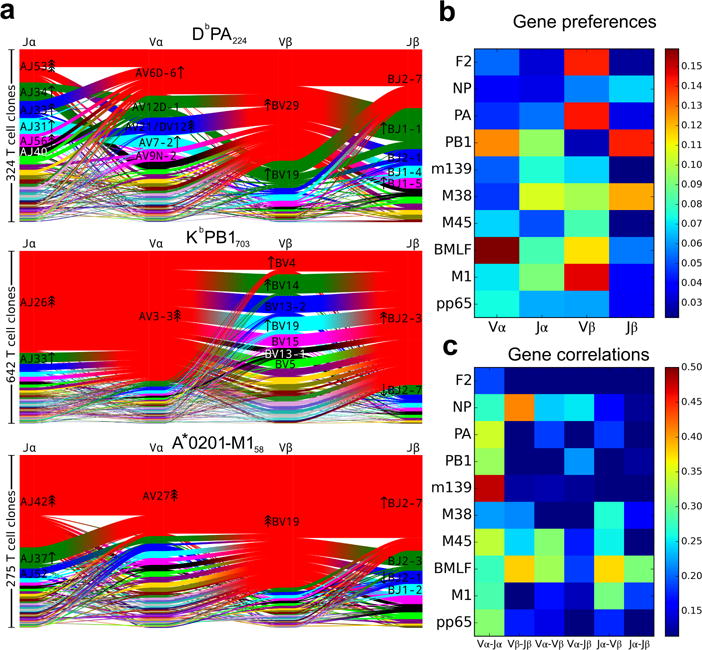
V and J gene segment usage and covariation in epitope-specific responses. a, Gene segment usage and gene-gene pairing landscapes are illustrated using four vertical stacks (one for each V and J segment) connected by curved paths whose thickness is proportional to the number of TCR clones with the respective gene pairing (each panel is labeled with the four gene segments atop their respective color stacks and the epitope identifier in the top middle). Genes are colored by frequency within the repertoire with a fixed color sequence used throughout the manuscript which begins red (most frequent), green (second most frequent), blue, cyan, magenta, and black. The enrichment of gene segments relative to background frequencies is indicated by up or down arrows with arrowhead number equal to the base 2 logarithm of the fold change. b, Jensen-Shannon divergence between the observed gene frequency distributions and background frequencies, normalized by the mean Shannon entropy of the two distributions (higher values reflect stronger gene preferences). c, Adjusted mutual information (AMI) of gene usage correlations between regions (higher values indicate more strongly covarying gene usage). The lower limits of the color ranges in b and c were chosen to highlight significant changes, as described in Methods. A summary of the number of subjects, total number of TCR sequences, and unique TCR clones for each epitope are shown in Extended Data Table 1.
Figure 2.
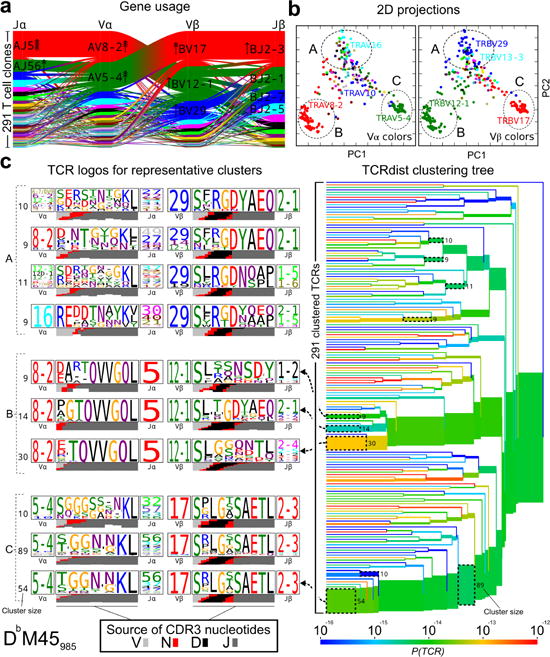
TCRdist analysis of the M45 repertoire identifies clusters of related receptors. a, Gene usage represented as in Figure 1. b, 2D kernel PCA projection of the TCRdist landscape colored by V-alpha (left panel) and V-beta (right panel) gene usage. Three groups of receptors that correspond to TCR logos and clusters depicted in (c) are indicated with dashed ellipses. c, Average-linkage dendrogram of TCRdist receptor clusters colored by generation probability, with TCR logos for selected receptor subsets (the branches enclosed in dashed boxes labeled with size of the TCR clusters). Each logo depicts the V- (left side) and J- (right side) gene frequencies, CDR3 amino acid sequences (middle), and inferred rearrangement structure (bottom bars colored by source region, light gray for the V-region, dark gray for J, black for D, and red for N-insertions) of the grouped receptors. (n=13 mice, 291 TCR clones).
To map epitope-specific TCR landscapes at high resolution and to obtain a quantitative measure of similarity between TCRs, we developed a distance measure on the space of T-cell receptors, termed TCRdist, that is guided by structural information on pMHC binding. Each TCR is mapped to the amino acid sequences of the loops within the receptor that are known to provide contacts to the pMHC (commonly referred to as CDR1, CDR2, and CDR3, as well as an additional variable loop between CDR2 and CDR3). The distance between two TCRs is computed by comparing these concatenated CDR sequences using a similarity-weighted Hamming distance, with a gap penalty introduced to capture variation in length and a higher weight given to the CDR3 sequence in recognition of its disproportionate role in epitope specificity (see Methods and Extended Data Fig. 3). We used this distance measure to obtain a coarse-grained visualization of each repertoire by mapping the high-dimensional TCR landscape into two dimensions, with each dot representing a TCR, while preserving receptor similarity as assessed by TCRdist (Fig 2b, Extended Data Figs. 4–5). Inspection of these projected landscapes allow us to identify subregions within each repertoire with tightly clustered (i.e., similar) receptors, and the panels colored by gene segment usage permit the association of these clusters with specific V/J genes.
To complement these landscape projections, we performed TCRdist-based clustering of the epitope-specific receptors and constructed hierarchical distance trees (Fig. 2c and Extended Data Figs. 5–6). (It is important to emphasize that clonal expansions are not reflected in these repertoire landscape analyses, as each unique receptor is included only once). We developed a TCR logo representation that summarizes the gene frequencies, CDR3 amino acid sequences, and inferred rearrangement structures of a set of TCRs as a tool to further annotate these clusterings (Fig. 2c, left panels). Examination of these trees showed that repertoires most often contained dominant clusters of receptors whose similarity is in part owed to common V- and J-region usage but is also driven by the similarity of CDR3 motifs. In addition to the core clusters of similar receptors, each repertoire also encompassed divergent regions of receptors that are clearly distinct from one another.
Although CDR3 sequence conservation14,15 was clearly evident in the TCRdist cluster logos, many of these shared CDR3 residues are derived directly from genomic sequence in the V and J regions and hence reflect the observed gene usage biases. We hypothesized that motifs that are not germline encoded or that are highly unlikely given naïve repertoire distributions must have been selected into the response and thus are more likely to be reliable contributors to specificity. To identify these features directly, we performed a statistical analysis of overrepresented CDR3 sequence motifs, taking into account the underlying sequence biases introduced by the rearrangement process. Using a recursive search algorithm, we identified sequence patterns that occur significantly more often in the observed receptors than in two V- and J-gene-matched background sets of receptor sequences (one drawn from high-throughput repertoire profiling experiments and one constructed by a simple random model of the rearrangement process; see Methods). In Figure 3 and Extended Data Fig. 7, we show the top-scoring motifs for both CDR3α and CDR3β of all 10 repertoires along with the residues (lower parts of each panel) that are specifically enriched in the motif relative to the background distribution. We propose that these statistically enriched, non-germline encoded motifs play a critical role in mediating TCR recognition. This view is supported by structural analysis of the motif residues in solved ternary structures for PA, BMLF, and M116–19 (Fig. 3). In each case, the enriched non-germline residues either directly contact the pMHC or contribute to the stabilization of the CDR3 loop conformation. For example, the enriched serine residue in the M1 CDR3β ‘RS’ motif contacts the peptide while the Arginine makes multiple contacts to both the MHC and CDR3β. Thus, working purely from sequence analysis, we were able to identify key conserved residues driving essential elements of TCR recognition.
Figure 3.
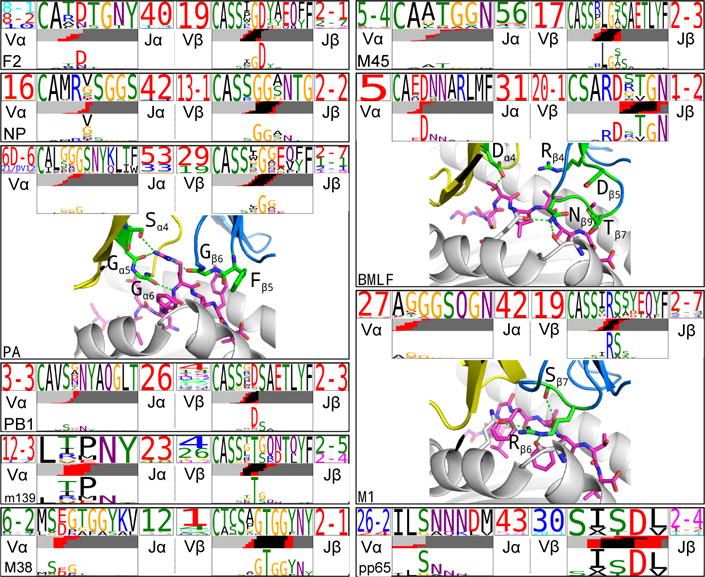
Enriched CDR3 sequence motifs define key features of epitope specificity. The top-scoring CDR3α (left TCR logo) and CDR3β (right TCR logo) sequence motifs are shown for each repertoire. The motif sequence logo is shown at full height (top) and scaled (bottom) by per-column relative entropy to background frequencies derived from TCRs with matching gene-segment composition in order to highlight motif positions under selection. For three epitopes with solved ternary TCR-peptide-MHC structures, the enriched motif positions are mapped onto the 3-D structure: motif positions shown in green sticks; peptide in magenta; alpha (beta) chain in yellow (blue) cartoons; selected hydrogen bonds shown as dotted green lines.
We next applied the TCRdist measure to quantitatively assess receptor diversity and density within epitope-specific repertoires. We developed a new diversity metric (TCRdiv) that generalizes Simpson’s Diversity Index (SDI)20–22 by capturing similarity among receptors in addition to exact identity, as SDI is highly sensitive to sampling noise because of the relative rarity of observing identical αβ pairs among individuals (see Methods). Examination of TCRdiv scores for the analyzed repertoires for single chains (Extended Data Fig. 8) as well as paired receptors (Fig. 4a) clarified trends seen in the earlier analyses; for example, the PB1 repertoire exhibited low diversity in the alpha chain and high beta-chain diversity, whereas the opposite was true of the alpha and beta chains in the M38 repertoire. As described above, our landscape analyses suggested that each repertoire is composed of one or more groups of clustered receptors sharing similar sequence features together with a more diverse, outlying population of diverged receptors. To measure receptor density within repertoires and quantify the relative contribution of clustered and diverged TCRs, we developed a repertoire-specific nearest-neighbors score (NN-distance) that captures the density of receptors surrounding each individual receptor (calculated as the average TCRdist between a receptor and its nearest-neighbor receptors within the repertoire). Although variation across repertoires was apparent in the NN-distance distributions (Fig. 4b), the majority of epitopes exhibited an approximately bimodal distribution in which one peak of receptors with low NN-distances represented the dominant and densely sampled main clusters of the receptor distribution, and a second peak of receptors with much greater NN-distances reflected the outlier receptors. To confirm the antigen specificity of these non-clustered receptors, we cloned receptors from the core and divergent groups of two repertoires, NP and PB1, into TCR-null cells and measured their ability to bind to their corresponding tetramers. In each case the reactivity of the receptor was confirmed (Extended Data Fig. 9a–d), indicating that at least some of these diverse, outlier receptors represent legitimate, if unconventional, solutions to the problem of epitope specificity. To gain insight into the features that determine representation within a given repertoire, we examined whether tetramer staining intensity correlated with NN-distance and found that dispersed outlier receptors do not appear to have a consistently lower avidity (Extended Data Fig. 9e and 9f). However, we did observe a strong correlation between receptor density and TCR generation probability (as computed by a simple model of the V(D)J recombination process, see Methods; R=−0.45, P<10−110; Extended Data Figure 8d), suggesting that ease of generation explains a portion of the variation in landscape structure.
Figure 4.
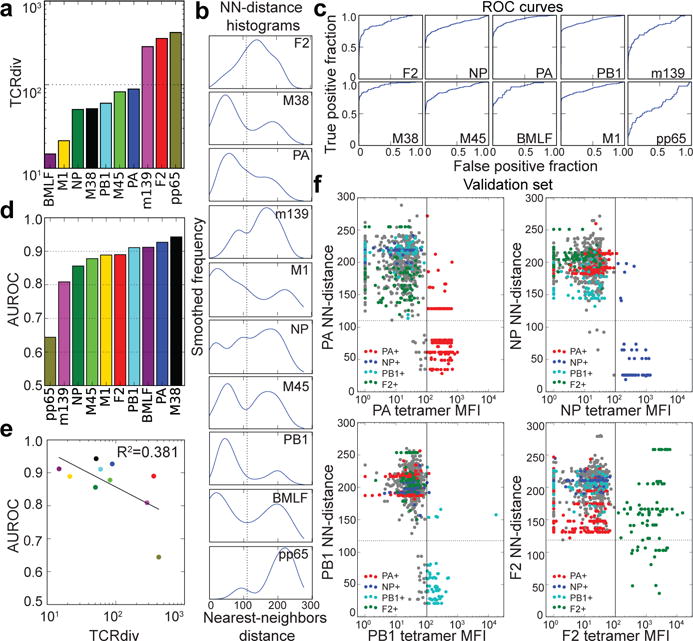
Quantifying the defining features of epitope-specific populations. a, TCRdiv diversity measures and b, smoothed density profiles of the nearest-neighbors (NN) distance are shown for each repertoire. c, Receiver operating characteristic (ROC) curves assess the performance of NN-distance as a TCR classifier, comparing sensitivity and specificity in differentiating epitope-specific receptors from background receptors. d, The area under these ROC curves (AUROC), a standard measure of classification success. e, Correlation between TCRdiv and AUROC. f, Assignment of TCR sequences from influenza infected lungs without prior knowledge of its tetramer specificity by NN-distance classifier. Tetramer binding (mean fluorescence intensity or MFI, x-axis) is plotted against NN-distance score (y-axis) for a validation set of T cell receptors (n=856 TCRs; 352 clones) collected after development of the classifier. The solid vertical lines indicate the MFI thresholds used to define epitope-positive receptors, which are plotted with the colors given in the legend (receptors negative for all four tetramers are shown in gray). Raw MFI values were scaled to align the threshold values across tetramers. Dotted horizontal lines indicating a fixed NN-distance score are provided for visual reference. A summary of the number of subjects, total number of TCR sequences, and unique TCR clones for each epitope are shown in Extended Data Table 1.
To test the predictive power of TCRdist, we defined a TCR classifier that assigns a given receptor to the repertoire with the lowest NN-distance (i.e., the greatest density of nearby receptors). We first measured the sensitivity and specificity of the classifier for identifying epitope-specific receptors among a pool of randomly generated background receptors (Fig. 4c). The area under these receiver operating characteristic curves (AUROC), a standard measure of classification success, was greater than 0.8 for all epitopes except pp65, the most diverse repertoire as measured by TCRdiv (Fig. 4d). Indeed, TCRdiv and AUROC appear related, particularly at the extremes (Fig. 4e), with the most diverse repertoires more difficult to reliably discriminate from background. We also evaluated the performance of our classifier on the more challenging multi-class discrimination problem, attempting to assign all epitope-specific receptors simultaneously to the correct repertoire. We found that 78% of mouse receptors and 81% of human receptors were correctly assigned to their source repertoire. Notably, the paired αβ sequence consistently provided better sensitivity and specificity than either chain alone, highlighting the importance of analyzing both receptor chains in tandem (Extended Data Fig. 8).
To validate our novel TCR classifier we generated an additional independent receptor dataset using index sorted cells stained with four tetramers (NP, PA, PB1, and F2) from the airways of influenza-infected mice (n=3) at the peak of primary infection. Cells were sorted without reference to the index tetramer information, sequenced, and assigned to one of the four epitopes or to the non-specific response using the NN-classifier. The predictor correctly assigned most TCR sequences to their target epitope as identified by tetramer staining, with AUROC scores greater than 0.9 for three of the epitopes (Fig. 4f). In contrast the accuracy of the TCR classifier for F2 was notably worse (0.72 for single cells; 0.85 measured for clonotypes), possibly because this epitope – the most diverse of the four – had the fewest receptor sequences available for training the classifier. Importantly, 85% of the receptors correctly classified in this validation experiment were not previously observed, demonstrating the power of this approach for classifying novel antigen-specific receptors. Furthermore, a significant population of cells fell just below the threshold for tetramer positivity yet were assigned to a specific epitope by the NN-classifier. We hypothesize that these cells are indeed specific for their predicted epitopes, but could not be identified by tetramer staining due to the poor separation of tetramer positive and negative cells typical of this approach.
One immediate application of these findings is the analysis of the abundance of mixed repertoire data being actively generated in clinical settings where the number or identity of the antigen-specific targets is unknown. Tumor-infiltrating lymphocytes can be isolated from solid tumors and sequenced, but the targets of those T cells have in the past proven difficult to identify23–26. Our analyses provide a way of grouping related receptors and selecting representative members of these clusters for further experimental interrogation of specificity. By parameterizing the elements of antigen-specific immune repertoires across a diverse set of epitopes, we propose that the development of a generalized model of TCR:pMHC recognition is possible, which would have powerful applications in a variety of research fields including cancer immunotherapy and the diagnosis and treatment of infectious diseases.
METHODS
Ethical compliance
All animal studies were carried in the Animal Resource Center at St. Jude Children’s Research Hospital and approved by the St Jude Children’s Research Hospital’s Institutional Animal Care and Use committee (IACUC). St Jude Children’s Research Hospital is fully accredited by the Association for the Assessment and Accreditation of Laboratory Animal Care International (AAALAC-I) and has an approved Animal Welfare Assurance Statement with the Office of Laboratory Animal Welfare.
The influenza studies were conducted in compliance with 45 CFR46 and the Declaration of Helsinki and approved by the Institutional Review Boards of St. Jude Children’s Research Hospital and the University of Tennessee Health Science Center/Le Bonheur Children’s Hospital. Similarly the CMV studies performed at St. Jude Children’s Research Hospital were approved by the institutional review boards of Johns Hopkins University (Baltimore, MD) and St. Jude Children’s Research Hospital. Written informed consent was obtained from all participants prior to the commencement of the study. The CMV studies performed at the University of Melbourne were conducted according to Declaration of Helsinki principles. All subjects provided written informed consent with ethics approvals granted by both The Alfred Hospital and Monash University. For the EBV studies, experiments were conducted according to the Declaration of Helsinki and conformed to the NHMRC Code of Practice. All subjects provided written informed consent and ethics approval was granted from University of Melbourne, the Alfred Hospital and Monash University Human Research Ethics Committees.
For all human studies, heparinized whole blood was obtained from immunocompetent individuals. Cells were processed by Ficoll gradient and frozen for subsequent tetramer staining and sorting.
Mice, infection and cell isolation
Six-eight week old C57BL/6 mice (both male and female) were obtained from Jackson Laboratories (Bar Harbor, ME) and rested for two weeks prior to infection. For generating a primary immune response, the mice were sedated using Avertin (2,2,2-tribromoethanol) and infected intranasally with 106 EID50 of the recombinant influenza virus strain A/Aichi/2/68 × A/Puerto Rico/8/34 (2+6, x31, H3N2) in a 30 μl volume. For secondary response analysis, the mice were primed with 108 EID50 of influenza virus strain A/Puerto Rico/8/34 (H1N1, PR8), intraperitoneally in a 500 μl volume. The primed mice were rested for 4 weeks prior to challenge with 106 EID50 of influenza virus strain (x31, H3N2) in a 30 μl volume.
For mCMV infections, 6–8 week old C57BL/6 mice were injected with 105 pfu of mCMV, Smith strain in a 500 μl volume intraperitoneally. The animals were monitored daily for their weight loss.
For analysis of the CD8+T cells from influenza virus infection, bronchoalveolar lavage (BAL) from day 10 (primary), day 31 (memory) and day 8 (secondary) post infected mice were harvested, processed into single suspensions and stained as described below. Similarly spleens from mCMV-infected mice at day 7 were harvested and processed to make single-cell suspensions. In all cases, the red blood cells were lysed and the cells were resuspened in sort buffer [PBS containing 0.1% BSA (Gibco)] at the concentration of 1 × 10⁶ /ml prior to staining.
Staining and single-cell sorting
Both mouse and human cells were stained with relevant tetramers and surface markers as described before27,28. Briefly, for mouse influenza and CMV epitope specific response, cells were stained with influenza tetramers DbNP366 (NP), DbPA244 (PA), DbPB1-F262 (F2), and KbPB1703 (PB1) or mCMV tetramers KbM38316 (M38), Kbm139419 (m139), and DbM45985 (M45) (all conjugated to PE or APC) (Trudeau Institute) in presence of Fc block (rat anti-mouse CD16/CD32, clone 2.4G2, BD Biosciences) for 1 hr at room temperature in dark. The cells were further washed in sort buffer and stained on ice with relevant surface markers [anti-mouse-CD4, (clone RM4-5), anti-mouse CD11b (clone M1/70), anti-mouse CD11c (clone N418), F4/80 (clone BM8) (all Pacific Blue conjugated for negative gating), (Biologened), and anti-mouse CD8-APC-eFluro780 (clone 53-6.7) (eBiosciences)]. For generation of the TCR validation dataset, cells from bronchoalveolar lavage of influenza infected mice (day 10) were stained with influenza tetramers DbNP366 (NP)-PE, DbPA224 (PA)-APC, DbPB1-F262 (F2)-BV421, and KbPB1703 (PB1)-Alexa-488 as described before. In addition to the negative gate staining, the cells were further incubated with anti-mouse CD8-APC-eFluro780) (clone 53-6.7) (eBiosciences) and anti-mouse CD44-PerCP-Cy5.5 (clone IM7) (Biolegend) as before.
For the human studies, PBMC from patients were obtained and stained with epitope specific tetramers and surface markers similar to the protocol used for mouse cells described above with the following modification. Prior to tetramer staining, the PBMC were stained with LIVE/DEAD Fixable Aqua Dead cell stain (Molecular Probes) for 30 min at room temperature in the dark. The cells were then stained with either influenza virus HLA-A*0201-M158 (M1), human cytomegalovirus (hCMV) HLA-A*0201–pp65495 (pp65) (Beckman Coulter), or Epstein-Barr virus (EBV) HLA-A*0201-BMLF1280 (BMLF) tetramers (all APC conjugated) (ImmunoID, University of Melbourne) for one hour, followed by FITC-conjugated anti-human CD3 (clone OKT3, Biolegend), PE-Cy7-conjugated anti-human CD8 (clone SK1, Biolegend), and PE-conjugated anti-human CD14 (clone HCD14, Biolegend) in appropriate dilutions for 30 min in the dark at room temperature.
Following staining, all cells were washed twice in sort buffer and resupended in sort buffer containing the RNAse inhibitor RNASin (Cat. No. N2111, Promega, 200 U/ml) at a concentration of 1106 cells/ ml for sorting. Single-cell sorting was carried out using a MoFlo or iCyt (Sony) with following parameters: Multi-drop sort OFF, Multi-drop exclude OFF, Division 10, Center sort%: 90. At least one column of the 96 well PCR plate was left unsorted to use as negative controls for the PCR. A representative gating strategy for the tetramer positive cells are shown in Extended data Fig. 7a. For the TCR validation experiment, cells were sorted on CD8+CD44+ staining with the index sorting option “on” for retrospective verification of our predictive call to the tetramer positivity. Following sorting, the plates were sealed immediately using Microamp optical plate sealer film (Cat No. 4311971, Applied Biosystems) and centrifuged at 500g for 3 minutes before storing at −80°C until reverse transcription and PCR29.
Paired TCR amplification and sequencing
TCR αβ mRNA from single epitope specific CD8 T cells were amplified and sequenced by methods described before27–29. A portion of the mouse influenza PA,mCMV epitope-specific and the validation test data were generated by a modified method utilizing Nextera DNA libraries on the miSeq platform (Illumina). Briefly, Illumina Nextera XT adapter sequences were incorporated to the second round nested forward and reverse primers27 that generate amplicon libraries. We added additional barcodes (specified by Illumina) to the reverse primers for multiplexing 384 well plates (six different barcoded reverse primers for six 384 well plates). The individual cell level multiplexing was achieved by Nextera XT Index Kit v2 (FC-131-2001-FC-131-2004; Illumina) and run as a single lane on a miSeq platform (detailed protocol available on request and in preparation as a methods manuscript).
Cloning and expression of TCR
Selected paired CDR3αβ chains to be tested were assembled to full length in silico, including the leader sequences, by utilizing the experimentally derived partial CDR3αβ and their corresponding variable region sequences from IMGT (L+V-J-C). The full length TCR sequences were cloned into a retroviral MSCV vector (pMICherry) (Addgene) using an established method30. The cloned TCRs were sequence verified and co-expressed with all of the murine CD3 chains (γ, δ, ε, ζ) from a retroviral vector pMIAmetrine in 293 T cells (ATCC®CRL-3216) by transfection (Mirus). The transfected cells were analyzed 36 hr later by flow cytometry and Flowjo.
Sequence analysis
DNA sequence reads were processed using an in-house software pipeline implemented in Python (see Code Availability). V and J gene assignments were made using BLAST31 against the IMGT nucleotide sequence databases32. CDR3 nucleotide and amino acid sequence assignments were defined based on the location of the conserved Cysteine in the V region (IMGT C104) and the FGXG motif in the J region as follows: ‘full CDR3’ defined as starting at C104 and ending inclusive of the F position of the FGXG motif (IMGT F118), ‘trimmed CDR3’ defined as starting with the 3rd position after the C104 and terminating with the 2nd position before F118 (5 fewer residues than the full CDR3; this corresponds to a commonly used structure-based CDR3 loop definition in which the first and last residues are in alignment in the TCR beta sheet). To handle degenerate J-gene FGXG motifs, the mouse and human J gene amino acid sequences were manually aligned to define the ‘F118’ position prior to sequence analysis. The paired TCRαβ sequence data generated have been deposited at the NCBI SRA database (accession SRP101659).
Cloning and expression of TCR
Selected paired CDR3αβ chains to be tested were assembled to full length in silico, including the leader sequences, by utilizing the experimentally derived partial CDR3αβ and their corresponding variable region sequences from IMGT (L+V-J-C). The full length TCR sequences were cloned into a retroviral MSCV vector (pMICherry) (Addgene) using an established method30. The cloned TCRs were sequence verified and co-expressed with all of the murine CD3 chains (γ, δ, ε, ζ) from a retroviral vector pMIAmetrine in 293 T cells (ATCC®CRL-3216) by transfection (Mirus). The transfected cells were analyzed 36 hr later by flow cytometry and Flowjo.
Gene enrichment and covariation analysis
Gene usage preferences were quantified by calculating a normalized Jensen-Shannon divergence (JSD)33 between the observed gene segment frequencies for each repertoire and background gene frequencies calculated from large-scale repertoire profiling studies (see section on ‘Background TCRs’ below). The JSD is a symmetrized version of the Kullback-Leibler divergence34,35; we further normalize the JSD values by dividing them by the mean Shannon entropy of the two distributions being compared, which helps to correct for variation in total gene number across segments. To set lower significance thresholds for the JSD heat maps in Figure 1b (i.e., the values below which the mapped color is a uniform dark blue), we compared the 2–4 different background repertoire datasets for each chain/organism to one another and took the largest observed JSD value across all comparisons.
Covariation between gene usage in different segments was quantified using the adjusted mutual information (AMI)36,36 a variant of the mutual information metric that corrects for the numbers and frequencies of the observed genes (mutual information between pairs of distributions tends to increase with the number of observation classes). To set lower significance thresholds for the AMI heat maps in Figure 1c we randomly shuffled the genes in each of the 60 (10 epitopes times 6 segment pairs) observed gene pairing lists 100 times and recomputed the AMI; the largest value observed in these 6000 random trials was taken as the lower significance threshold.
TCRdist distance measure
The TCRdist distance between two TCRs is defined to be the similarity-weighted mismatch distance between the potential pMHC-contacting loops of the two receptors (Extended Data Fig. 2). The loop definitions used are based on the IMGT CDR definitions (http://www.imgt.org/IMGTScientificChart/Nomenclature/IMGT-FRCDRdefinition.html) with the following modifications: (1) we include the pMHC-facing loop between CDR2 and CDR3 (IMGT alignment columns 81–86) since residues in this loop have been observed making pMHC contacts in solved structures; (2) we use the ‘trimmed CDR3’ defined above rather than the full IMGT CDR3. The mismatch distance is defined based on the BLOSUM6237 substitution matrix as follows: dist(a,a)=0; dist(a,b) = min(4, 4-BLOSUM62(a,b)), where 4 is 1 unit greater than the most favorable BLOSUM62 score for a mismatch. This has the effect of reducing the mismatch distance penalty for amino acids with positive (i.e., favorable) BLOSUM62 scores (e.g.: dist(I,V)=1; dist(D,E)=2; dist(Q,K)=3). A gap penalty of 4 (8 for the CDR3) is used as the distance between a gap position and an amino acid. To account for the greater role of the CDR3 regions in peptide recognition and offset the larger number (3) of non-CDR3 loops, a weight of 3 is applied to mismatches in the CDR3s.
For each epitope-specific repertoire we computed a TCRdist distance matrix between all receptors. This distance matrix was used for clustering and dimensionality reduction as described below as well as in the TCRdiv diversity calculation. The sampling density nearby each receptor was estimated by taking the weighted average distance to the nearest-neighbor receptors in the repertoire: a small nearest-neighbors-distance (NN-distance) indicates that there are many other nearby receptors and hence greater local sampling density. For analyses reported here we used the nearest 10 percent of the repertoire with a weight that linearly decreases from nearest to farthest neighbors. Values smaller than 10 focus on the very nearest neighbors, enhancing detection of rare clusters while increasing the sensitivity to noise or mis-assigned receptors; larger values better reflect the global repertoire consensus while potentially blurring out the signal from rare clusters. When assessing classification accuracy, NN-distance scores were calculated after removing all receptors from the same subject as the receptor being scored (effectively a leave-one-subject-out control). To compute AUC scores for the NN-distance classifier, epitope-specific TCRs (positives) and background receptors (negatives) were sorted by NN-distance for the corresponding epitope; an ROC curve was constructed by plotting sensitivity (fractional recovery of epitope-specific receptors) versus 1-specificity (fractional recovery of background receptors) as the NN-distance threshold increases; and the area under this ROC curve was measured. To assign receptors to one of several possible epitope specificities, the NN-distance score is computed with respect to each of the epitope-specific repertoires and the receptor is assigned to the repertoire with the lowest NN-distance score.
Clustering and dimensionality reduction
Each TCR repertoire was clustered using a greedy, fixed-distance-threshold clustering algorithm in which at each step the TCR with the largest number of neighbors within the distance threshold is chosen as a cluster center, it and all its neighbors are removed from the repertoire, and the process is repeated until all TCRs have been clustered. The distance threshold was chosen to yield fairly homogeneous clusters of sufficient size (the same threshold was used for all repertoires). The results of the clustering were visualized by construction of average-linkage hierarchical clustering trees38 and TCR sequence logos (see below). As an alternative landscape visualization, the TCRs in each repertoire were projected into two dimensions using kernel principle component analysis as implemented in the scikit-learn (http://scikit-learn.org/) ‘KernelPCA’ function, which attempts to preserve the similarity structure of the input data points while reducing their dimensionality.
Modeling gene rearrangement
As part of our repertoire analysis framework we implemented a simple model of the TCR rearrangement process. In annotating observed TCRs, each nucleotide of the CDR3 is assigned to a genomic source region (V, D, or J) or is classified as an N-nucleotide insertion, so as to minimize the number of N-nucleotides. By applying this annotation process to large datasets of unpaired TCR sequence data (see ‘Background TCRs’ below), we inferred probability distributions of the numbers of insertions and deletions which allowed us to assign an estimated generation probability to any TCR nucleotide or amino acid sequence (where the amino acid probability is a sum over all possible coding nucleotide sequences). We also used these probability distributions to generate the random receptors that formed one of the two control sets for our CDR3 motif discovery algorithm (see below). For this purpose we sampled the V and J gene segments from the observed receptors but generated the junctional sequences based on the inferred probability distributions for numbers of insertions and deletions (filtering at the end for in-frame receptors).
TCR sequence logos
To visualize groups of related TCRs we developed a ‘TCR logo’ representation that summarizes V and J gene usage, CDR3 amino acid sequences, and inferred rearrangement structure of the CDR3 nucleotide sequences. This TCR logo has four components (see examples in Figs. 2 and 3): (1) a V-gene logo (left) in which the IMGT V-gene names (trimmed to remove the leading ‘TR’ and the allele identifier) are scaled by frequency and stacked top to bottom from most to least common; (2) a CDR3 sequence logo (center) where the amino acids at each position are similarly scaled and ordered by frequency and colored by chemical type; (3) a J-gene logo (right) analogous to the V-gene logo; and (4) a CDR3 nucleotide-source bar (below) in which the genomic source regions for each nucleotide column are represented by frequency-scaled bars, ordered top to bottom from V to J to D, and colored light gray (V), black (D), dark gray (J), and red (N-nucleotides). The V-and J-gene identifiers are colored according to their overall frequency in the analyzed repertoire using a color scheme that begins: red, green, blue, cyan, magenta, black (this gene coloring scheme is also used in the schematics in Figs. 1a and 4c).
CDR3 motif discovery
We used a simple, depth-first search procedure to identify over-represented sequence patterns in the CDR3 amino sequences of each repertoire. Motifs were represented as fixed-length patterns consisting of fully-specified amino acid positions, wild card positions, and amino acid group positions (allowed groupings: {K,R}, {D,E}, {N,Q}, {S,T}, {FYWH}, {AGSP}, {VILM}). The score of a motif was calculated using a chi-squared formalism: motif_score=(observed-expected)2/expected, where observed represents the number of times the motif was observed in the repertoire sequences and expected represents an estimate of the expected number of observations based on a background set of TCR sequences with V and J gene compositions that match the observed repertoire (to suppress sequence patterns that come entirely or largely from genomic sequence). Two background TCR sets were used: one drawn from high-throughput profiling experiments (see ‘Background TCRs’ below) and one generated using the simple probabilistic rearrangement model introduced above; the expected term in the motif score was the larger of the two estimates derived from these two sets. Starting with two-position motifs scoring above a seed threshold, each motif was iteratively extended by adding new specified positions (i.e., replacing an internal wild card or lengthening the motif at either end) that increased the motif score. The set of identified motifs were sorted by motif score and filtered for redundancy. Finally, motifs scoring above a threshold were extended to include near-neighbor TCRs using a stringent distance threshold; this allowed us to capture additional pattern instances that were not captured by our limited set of amino acid groupings. The final set of motifs for each repertoire were visualized using the TCR logo representation.
Repertoire diversity measures (TCRdiv)
To robustly estimate the diversity of the underlying, combined, epitope-specific repertoires from which our set of observed receptors were sampled, we developed a new diversity measure that generalizes Simpson’s diversity index by accounting for TCR similarity as well as exact identity. Simpson’s diversity can be thought of as measuring the probability of drawing the same species or class of item in two independent samples from a mixed population, or in other words the expected value of a function of the two drawn samples that returns 1 if the samples are identical and 0 otherwise. We instead estimate the expected value of a Gaussian function of the inter-sample distance that returns 1 if the two samples are identical and exp(−(TCRdist(a,b)/stddev)2) otherwise, where the scale factor stddev was taken to be 18.45 for single-chain distances and twice that for paired analyses based on empirical assessments of receptor distance distributions for multiple epitopes. Taking the inverse of this estimate gives a diversity measure (TCRdiv) that can be interpreted as an effective population size for similarity-weighted sharing.
Background TCRs
To estimate background frequencies of the different V and J genes, generate background TCRs for use in assessing the significance of CDR3 motifs, and as negative samples for discrimination tests, we relied on the following high-throughput repertoire profiling experiments: for the mouse alpha chain, short read archive (SRA) projects SRP01081539 and SRP05958140; for the mouse beta chain, SRA projects SRP05958140, SRP01513141, and SRP004475; for the human alpha and beta chains, the study of Howie et al.42. For background frequency comparisons we took the minimum normalized JSD over the 2–4 experiments for the corresponding chain and organism, as a conservative estimate of gene preference. To generate background TCRs for classification tasks involving paired receptors, we randomly assorted unpaired alpha and beta chain sequences from the high-throughput repertoires for the corresponding organism.
Statistics
Statistical methods are described in the Figure legends and in the relevant methods descriptions. In all cases, we considered sample size, variance, and number of comparisons in selecting an appropriate test. No samples were excluded from analysis. Correlations between computed receptor features were assessed using Pearson’s linear correlation coefficient and associated approximate p-value as returned by the scipy.stats function <mono space>pearsonr<mono space> and by two-sided t tests as implemented in <mono space>scipy.stats.ttest_ind. <mono space>
Data Availability
The processed datasets have been deposited at the NCBI Short Read Archive database with accession code:SRP101659. The data have also been uploaded to vdjdb (https://vdjdb.cdr3.net/).
Code availability
Source code for our repertoire analysis software can be found in the public Github repository ‘tcr-dist’ at the URL https://github.com/phbradley/tcr-dist.
Extended Data
Extended Data Figure 1.
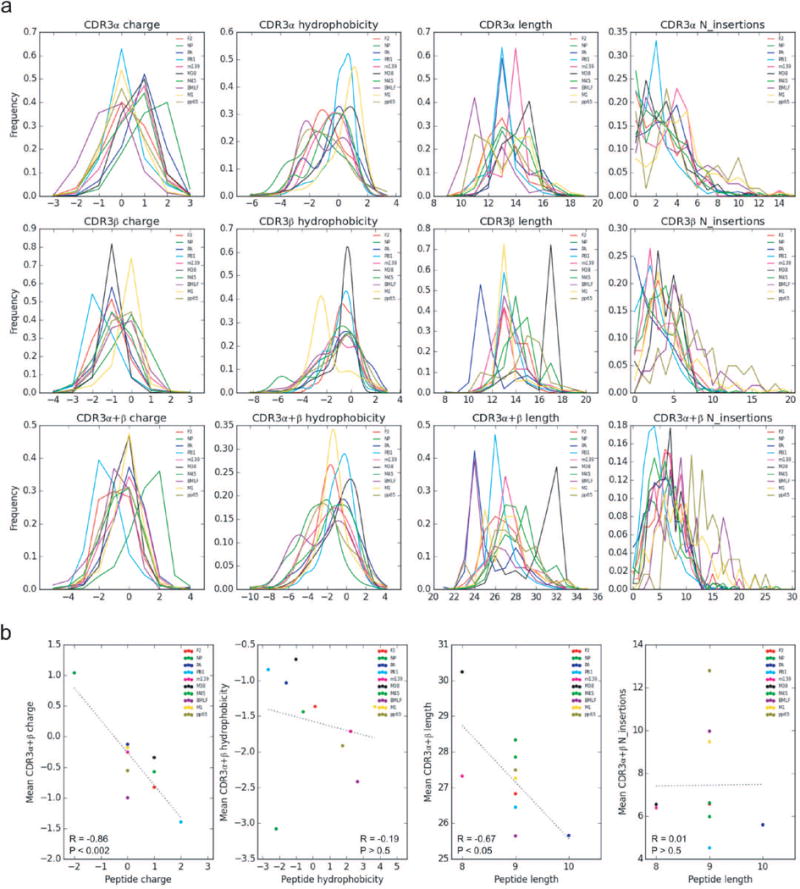
CDR3 region characteristics of 10 epitope-specific TCR repertoires. a, Paired TCR sequences derived from epitope specific CD8+ T cells were analyzed for CDR3 length, charge, hydrophobicity, and inferred number of junctional nucleotide insertions for both single and paired chains as shown in the histograms. Different epitopes are color coded (described in the legend). b, Correlation between CDR3αβ and antigenic peptides for charge, hydrophobicity, length, and N-insertions observed in all 10 epitopes. A summary of the number of subjects, total number of TCR sequences, and unique TCR clones analyzed for each epitope are shown in Extended Data Table 1.
Extended Data Figure 2.
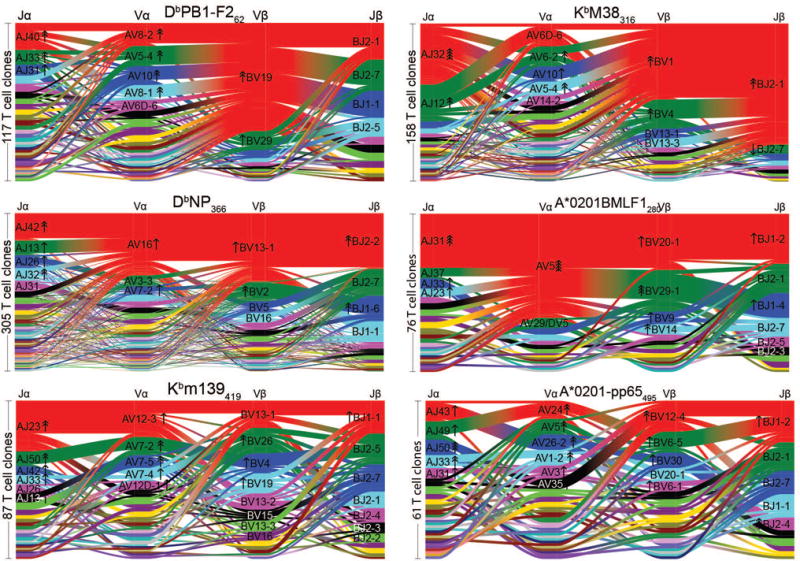
V and J gene segment usage and covariation in epitope-specific responses. Gene segment usage and gene-gene pairing landscapes are illustrated graphically using four vertical stacks (one for each V and J segment) connected by curved segments whose thickness is proportional to the number of TCRs with the respective gene pairing (each panel is labeled with the four gene segments atop their respective color stacks and the epitope identifier in the top middle). Genes are colored by frequency within the repertoire with a fixed color sequence used throughout the manuscript which begins red (most frequent), green (second most frequent), blue, cyan, magenta, and black. Clonally expanded TCRs were reduced to a single datapoint for this analysis. The number of clones is indicated to the left of each panel. The enrichment of gene segments relative to background frequencies is indicated by up or down arrows, with each successive arrowhead corresponding to an additional 2-fold deviation (e.g. one arrowhead=2-fold enrichment, two arrowheads=4-fold enrichment).
Extended Data Figure 3.
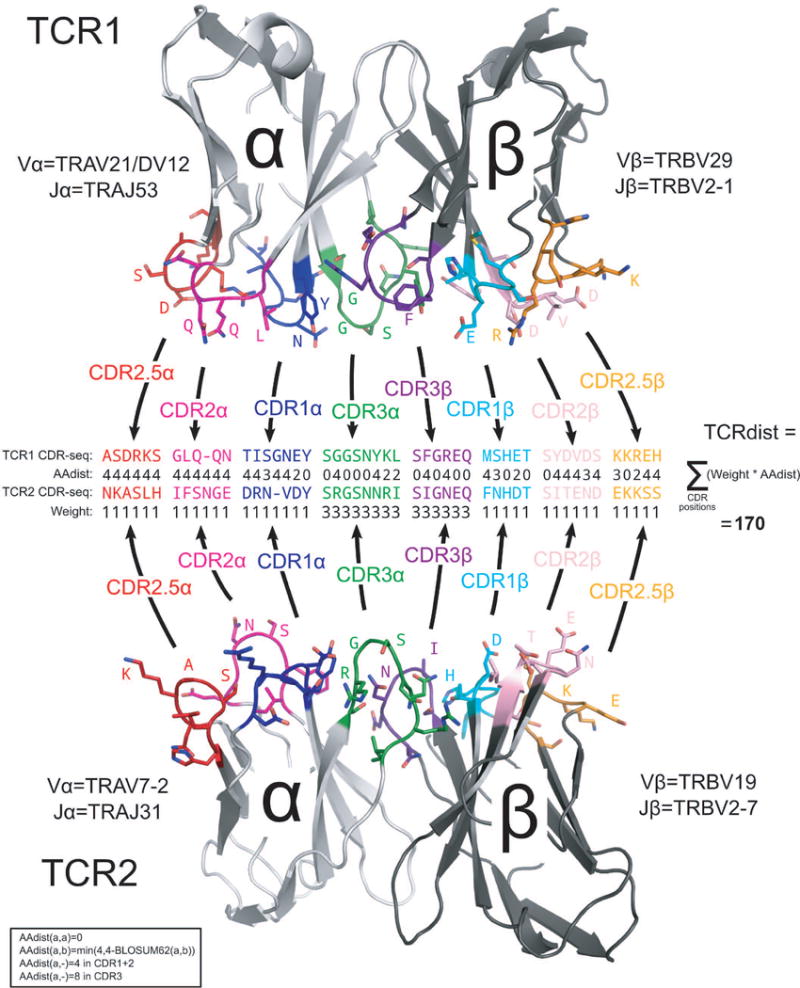
Schematic overview of the TCRdist calculation. Each of the two TCRs being compared is first mapped to the amino acid sequence of its CDR loops (CDR1, CDR2, and CDR3 as well as an additional variable loop here labeled ‘CDR2.5’), as indicated by the black arrows leading from the colored loop regions in the receptor structures to the corresponding amino acid sequences in the middle of the diagram. These CDR sequences are aligned based on the IMGT reference43 multiple sequence alignments, and a distance score (‘AAdist’) is computed for each position in the alignment using the BLOSUM62 similarity matrix according to the formula given in the box at the bottom left. The AAdist scores are weighted as shown in the ‘Weight’ row (thereby increasing the contribution of the CDR3 regions) and summed to produce the final TCRdist score (shown at the right).
Extended Data Figure 4.
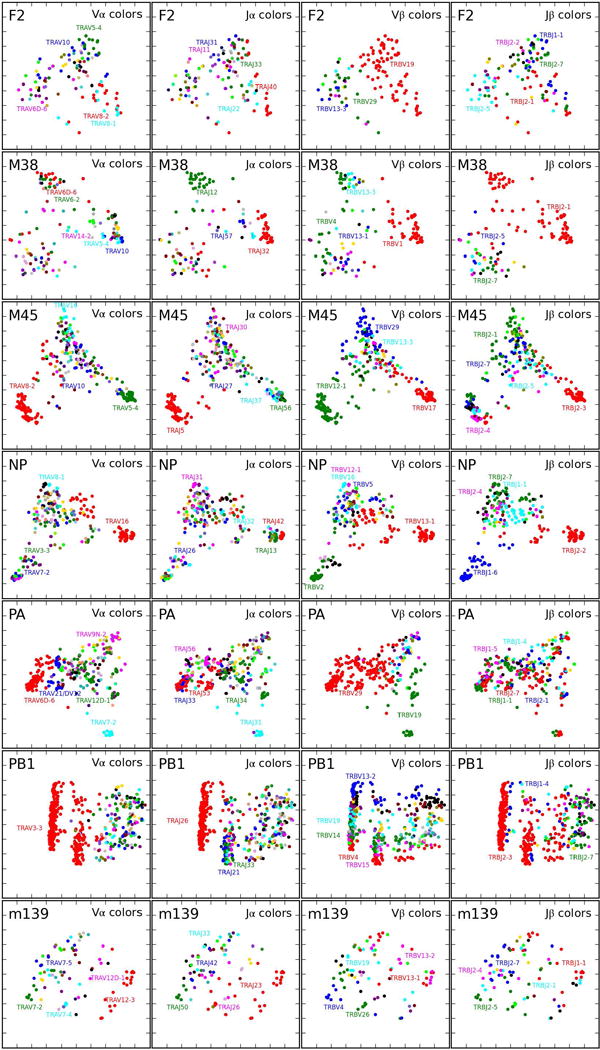
Two-dimensional projections of mouse epitope-specific TCR repertoires. Epitope-specific TCR landscapes were projected into two dimensions (2D) using kernel PCA analysis applied to the TCRdist distance matrix: TCRs with small TCRdist values tend to project to nearby points in 2D. The same 2D projection is shown in the four panels of each row, colored by Vα, Jα, Vβ and Jβ gene segment usage (left to right, respectively). The colors are based on gene frequency in the projected repertoire and follow the same sequence used throughout the manuscript: in decreasing order, 1. red, 2. green, 3. blue, 4. cyan, 5. magenta, 6. black, followed by assorted colors for rare frequencies. A summary of number of subjects, total number of TCR sequences and unique TCR clones analyzed for each epitope are shown in Extended Data Table 1.
Extended Data Figure 5.
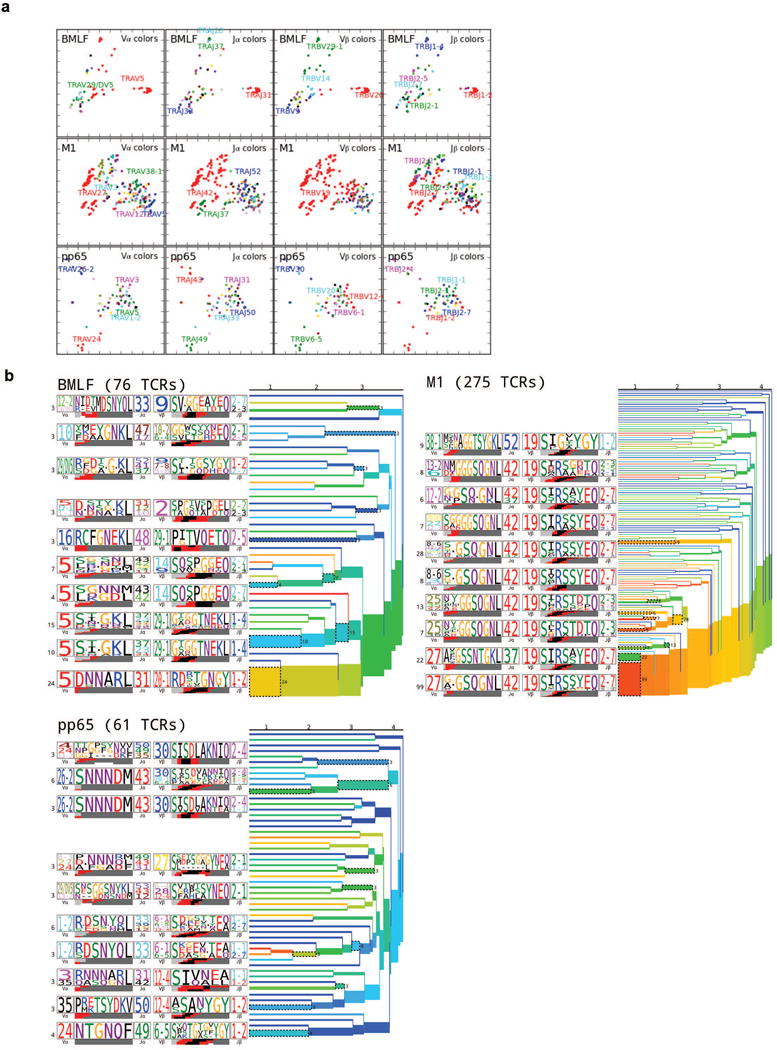
Two-dimensional projections and clustering dendrograms of human epitope-specific TCR repertoires. a, Kernel PCA projections for the three human epitopes, colored as in Extended Data Fig. 4. b, Average-linkage dendrograms of TCR clusterings for the human repertoires. Each clustering was generated using a fixed-distance-threshold algorithm and colored by generation probability (red: highest and blue: lowest probability of ease of TCR recombination). The TCR logos for selected receptor subsets (corresponding to the branches of the dendrogram enclosed in dashed boxes) are shown, labeled by cluster size both to the left of each logo and to the right of the corresponding branches. Each TCR logo depicts the V- and J-gene frequencies, the CDR3 amino acid sequence, and the inferred rearrangement structure of the grouped receptors (colored by source region, light gray for the V-region, dark gray for J, black for D, and red for N-insertions; details in Methods). A summary of number of subjects, total number of TCR sequences and unique TCR clones analyzed for each epitope are shown in Extended Data Table 1.
Extended Data Figure 6.
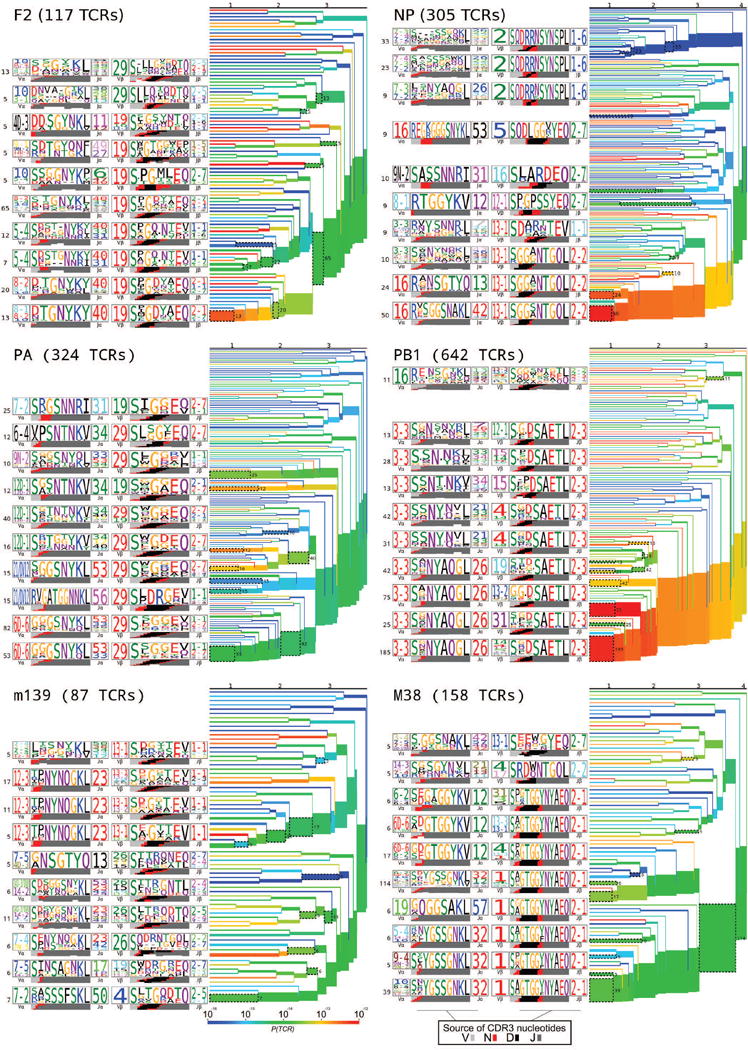
Clustering dendrograms of mouse epitope-specific TCR repertoires. Each mouse epitope-specific TCR repertoire not depicted in main text Fig. 2 was clustered using a fixed-distance-threshold clustering algorithm and represented as a dendrogram colored by generation probability (red: highest and blue: lowest probability of ease of TCR recombination), with TCR logos for selected receptor subsets (corresponding to the branches of the dendrogram enclosed in dashed boxes), labeled by cluster size both to the left of each logo and to the right of the corresponding branches. Each TCR logo depicts the V- and J-gene frequencies, the CDR3 amino acid sequence, and the inferred rearrangement structure of the grouped receptors (colored by source region, light gray for the V-region, dark gray for J, black for D, and red for N-insertions; details in Methods). A summary of number of subjects, total number of TCR sequences and unique TCR clones analyzed for each epitope are shown in Extended Data Table 1.
Extended Data Figure 7.
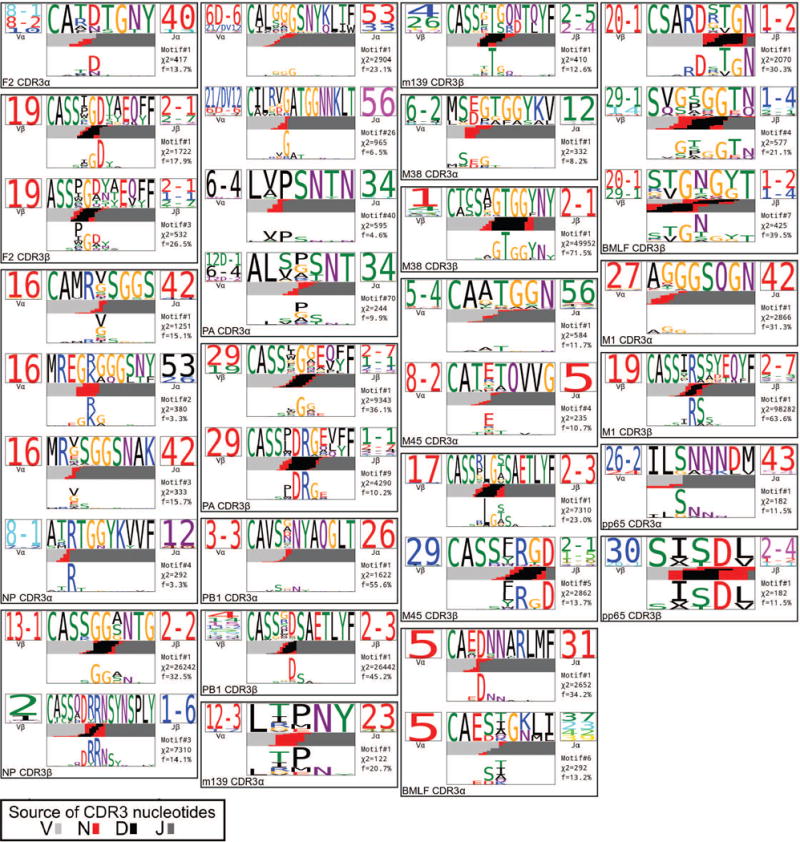
TCR logo representations of CDR3 α and β sequence motifs. The results of our CDR3 motif discovery algorithm were visualized using a TCR logo that summarizes V and J usage, CDR3 amino acid enrichment, and inferred rearrangement structures. The motif sequence logo is shown at full height (top) and scaled (bottom) by per-column relative entropy to background frequencies derived from TCRs with matching gene-segment composition in order to highlight motif positions under selection. The motif chi-squared score (see Methods) and the fraction of the repertoire matched are given below the J-gene logo. A summary of number of subjects, total number of TCR sequences and unique TCR clones analyzed for each epitope are shown in Extended Data Table 1.
Extended Data Figure 8.
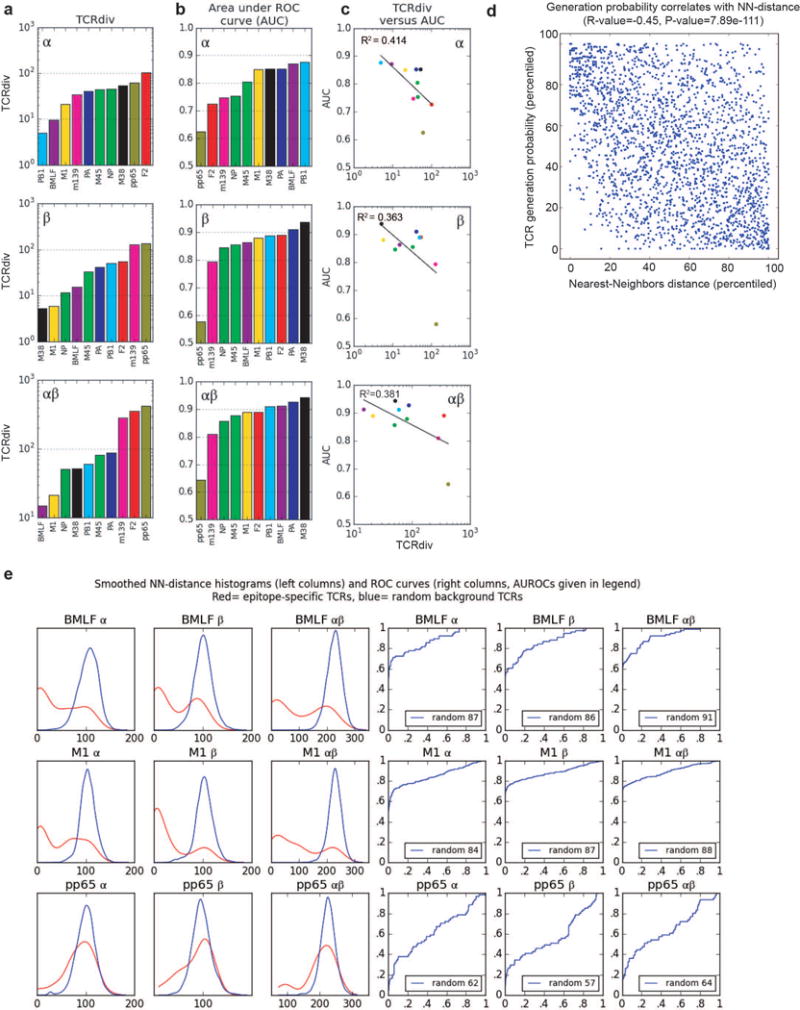
Quantifying the defining features of epitope-specific populations. a, TCRdiv diversity measures; b, the area under the ROC curves (AUC), a standard measure of classification success; and c, correlations between the discrimination AUC and the TCRdiv diversity measure at single and paired chain level. d, Correlation between repertoire sampling density and generation probability. Nearest-neighbors sampling metric for all TCRs in the dataset (x-axis) is plotted against an estimated generation probability (y-axis) based on a simple model of the rearrangement process that accounts for distance from germ line and convergent recombination. The distributions of each measure were normalized (percentiled by rank) within each dataset so that global differences between repertoires do not influence the correlation. e, Quantifying the defining features of human epitope-specific responses. Smoothed, nearest-neighbor distance distributions with respect to the labeled repertoire are plotted in the left three columns for epitope-specific TCRs (red curves) and randomly selected background TCRs (blue curves); TCRdist distances were calculated over the α chain (column 1), the β chain (column 2), or the full receptor (column 3). Plotted in columns 4–6 are receiver operating characteristic (ROC) curves assessing the performance of neighbor-distance as a TCR classifier, comparing sensitivity and specificity in differentiating epitope-specific receptors from randomly selected background receptors (blue ROC curves). Analyses for both single and paired chains are shown, as indicated in the plot labels. A summary of number of subjects, total number of TCR sequences and unique TCR clones analyzed for each epitope are shown in Extended Data Table 1.
Extended Data Figure 9.
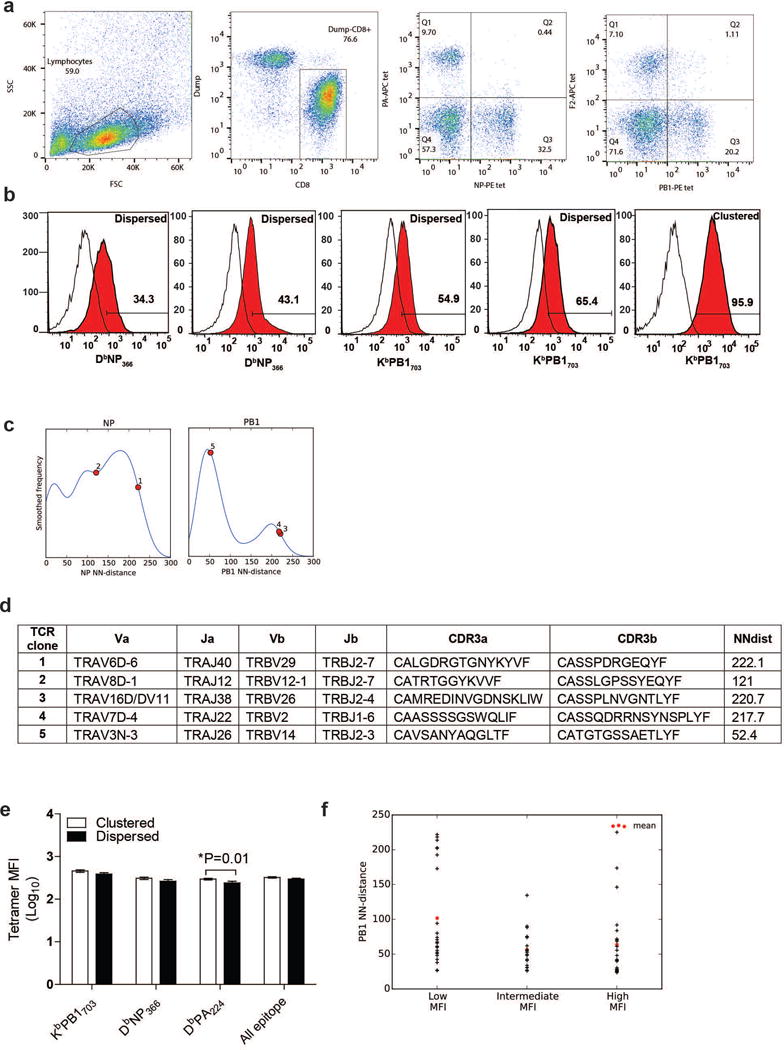
Specificity and avidity of TCRs of the dispersed region of the TCRdist dendrograms. a, Representative flow plots showing gating strategies of tetramer positive CD8 T cells from influenza infected lungs. b, Cloning and expression of clustered and dispersed receptors from the indicated epitopes stained with specific tetramer vs. control levels. Representative TCRs from clustered and dispersed region of the TCRdist dendrogram were cloned, expressed, and tested for binding against specific tetramers. Binding of two non-clustered TCRs from NP and PB1 epitope and a TCR from the clustered region of PB1 epitope is shown. c, The distribution of the tested TCRs (numbered 1–5 corresponding to left to right occurrence in (b) on a NN-distance plot and d, their V-J usage, CDR3 sequences with NN-distance score are shown. e, Analysis of the mean fluorescence intensities (MFI) of the clustered and dispersed (separated by visual threshold of 135 NN-distance score) group of receptors shows no consistent segregation of the avidity. Mean and standard error of mean are shown. f, PB1 specific TCRs derived from cells sorted by low, intermediate and high gating show overlapping distribution of NN-distance score [N= 23 (low), 18 (intermediate), 23 (high) cells].
Extended Data Table 1.
The TCR repertoires of 10 epitope-specific populations.
| Name | Species | MHC | Peptide | Virus | No. of subjects | No. of parsed reads | No. of clones1 | Clonality2 | Pshare3-α | Pshare-β | Pshare-αβ |
|---|---|---|---|---|---|---|---|---|---|---|---|
| F2 | mouse | Db | LSLRNPILV | IAV | 9 | 162 | 117 | 0.954 | 3.09E-03 | 2.66E-03 | 0.00E+00 |
| NP | mouse | Db | ASNENMETM | IAV | 24 | 815 | 305 | 0.855 | 7.27E-03 | 3.46E-02 | 2.16E-03 |
| PA | mouse | Db | SSLENFRAYV | IAV | 15 | 620 | 324 | 0.958 | 1.03E-02 | 3.78E-03 | 1.19E-03 |
| PB1 | mouse | Kb | SSYRRPVGI | IAV | 34 | 932 | 642 | 0.968 | 2.46E-02 | 4.82E-03 | 5.91E-04 |
| m139 | mouse | Kb | TVYGFCLL | mCMV | 8 | 124 | 87 | 0.933 | 1.18E-02 | 1.64E-03 | 0.00E+00 |
| M38 | mouse | Kb | SSPPMFRV | mCMV | 14 | 407 | 158 | 0.843 | 6.36E-03 | 1.06E-01 | 2.16E-03 |
| M45 | mouse | Db | HGIRNASFI | mCMV | 1 | 345 | 291 | 0.989 | 8.74E-03 | 6.34E-03 | 1.20E-03 |
| BMLF | human | A0201 | GLCTLVAML | EBV | 6 | 470 | 76 | 0.823 | 5.41E-02 | 2.11E-02 | 4.85E-03 |
| M1 | human | A0201 | GILGFVFTL | IAV | 15 | 453 | 275 | 0.888 | 1.98E-02 | 6.45E-02 | 1.33E-02 |
| pp65 | human | A0201 | NLVPMVATV | hCMV | 10 | 307 | 61 | 0.528 | 1.51E-02 | 2.43E-03 | 0.00E+00 |
Two TCRs are considered as belonging to the same clone if they are from the same mouse and have identical nucleotide sequences.
Clonality is measured by first computing 1.0-Simpson’s diversity index of the clone size distribution for each subject and then averaging these values over the different subjects with weights based on the size of each subject’s repertoire.
Pshare is the estimated rate at which a clone drawn from one subject has an identical amino acid sequence to one drawn from another subject.
Extended Data Table 2.
Biophysical characteristics of TCR repertoire of 10 epitope specific populations.
| Name | # of Sequences | α_lengt3h | α_charge | α_hydrophobicity | β_length | β_charge | β_hydrophobicity | αβ_length | αβ_charge | αβ_hydrophobicity |
|---|---|---|---|---|---|---|---|---|---|---|
| F2 | 117 | 13.1 (1.4) | 0.2 (1.0) | −0.9 (1.2) | 13.7 (1.1) | −1.1 (0.7) | −0.5 (1.1) | 26.8 (1.8) | −0.8 (1.1) | −1.4 (1.7) |
| NP | 305 | 14.0 (1.4) | 1.2 (0.9) | −1.3 (1.7) | 14.3 (1.5) | −0.2 (0.9) | −1.7 (2.0) | 28.3 (2.0) | 1.0 (1.2) | −3.1 (2.1) |
| PA | 324 | 13.6 (1.2) | 0.9 (0.8) | −0.4 (1.5) | 12.0 (1.7) | −1.0 (0.8) | −0.6 (1.7) | 25.7 (2.2) | −0.1 (1.2) | −1.0 (2.2) |
| PB1 | 642 | 13.0 (1.0) | 0.1 (0.7) | 0.0 (1.1) | 13.4 (0.9) | −1.5 (0.8) | −0.9 (1.1) | 26.4 (1.3) | −1.4 (1.1) | −0.8 (1.6) |
| m139 | 87 | 13.9 (1.0) | 0.5 (0.9) | −0.5 (1.2) | 13.4 (1.4) | −0.8 (0.9) | −1.2 (1.5) | 27.3 (1.7) | −0.3 (1.1) | −1.7 (2.0) |
| M38 | 158 | 14.2 (1.1) | 0.7 (0.7) | 0.1 (1.3) | 16.1 (1.6) | −1.0 (0.5) | −0.8 (1.1) | 30.2 (2.2) | −0.3 (0.9) | −0.7 (1.9) |
| M45 | 291 | 13.6 (1.3) | 0.4 (0.9) | −0.5 (1.3) | 14.3 (1.1) | −0.9 (0.9) | −0.9 (1.4) | 27.9 (1.6) | −0.6 (1.2) | −1.4 (2.1) |
| BMLF | 76 | 11.9 (1.6) | −0.5 (0.9) | −1.0 (1.4) | 13.8 (1.1) | −0.5 (0.9) | −1.4 (1.7) | 25.6 (2.2) | −1.0 (1.2) | −2.4 (2.5) |
| M1 | 275 | 13.8 (1.7) | 0.0 (0.8) | 0.5 (1.2) | 13.5 (1.3) | −0.2 (0.7) | −1.9 (1.5) | 27.3 (2.1) | −0.2 (1.0) | −1.4 (1.6) |
| pp65 | 61 | 12.9 (1.6) | 0.1 (0.9) | −1.0 (1.5) | 14.6 (1.9) | −0.7 (0.8) | −0.9 (1.7) | 27.5 (2.4) | −0.6 (1.1) | −1.9 (2.2) |
Mean and standard deviations (in parenthesis) are shown.
Supplementary Material
Acknowledgments
We would like to thank the St Jude Children’s Research Hospital Animal Resource Center’s staff for their support and excellent animal care. We thank Dr. Greig Lennon for the help with single-cell sorting. We thank the Hartwell Center at St. Jude for sequencing support. We also thank Melissa Morris, Lana McLaren, Thomas H. Oguin III, Walid Awad, Anthony Zamora, David Boyd, Xizhi (Johnny) Guo, Sophie Valkenburg, Emma Grant, Nicole Bird and Nicole Mifsud for their help in conducting experiments and preparation of the manuscript. The work was supported by NIH grant AI107625 and ALSAC (to PGT), FHCRC internal development funding to PB, and an NHMRC Program Grant (1071916) to KK and NLG. NLL is the recipient of a Sylvia and Charles Viertel Senior Medical Research Fellowship. EBC is an NHMRC Peter Doherty Fellow and KK is an NHMRC SRF Level B Fellow. GCW was the recipient of National Institute on Aging (NIA) K23 AG033113, NIA P30 AG021334, John A. Hartford Foundation’s Center of Excellence in Geriatric Medicine Scholars Award, and Johns Hopkins Biology of Healthy Aging Program
Footnotes
Author contribution
PD, AG, TH, PB and PGT wrote the manuscript and designed figures. PD, GCW, SS and PGT designed experiments. PD, GCW, AS and SS conducted experiments. PD, GCW, SS and AS acquired data. PD, GCW, SS, AS, JCC, BC, THON, KK, NLG, PB and PGT analyzed data. PD, AG, TH, PB, PGT interpreted data. PD, AG, TH, AS, PB, GCW, KK, NLG, PGT and JCC edited the manuscript. All authors approved final manuscript.
Author information
The authors declare no competing financial interests. Readers are welcome to comment on the online version of this article at www.nature.com/nature.
References
- 1.Davis MM, Bjorkman PJ. T-cell antigen receptor genes and T-cell recognition. Nature. 1988;334:395–402. doi: 10.1038/334395a0. [DOI] [PubMed] [Google Scholar]
- 2.Mora T, Walczak AM. Quantifying lymphocyte receptor diversity. bioRxiv. 2016;046870 doi: 10.1101/046870. [DOI] [Google Scholar]
- 3.Giraud M, et al. Fast multiclonal clusterization of V(D)J recombinations from high-throughput sequencing. BMC Genomics. 2014;15:409. doi: 10.1186/1471-2164-15-409. [DOI] [PMC free article] [PubMed] [Google Scholar]
- 4.Alamyar E, Giudicelli V, Li S, Duroux P. IMGT/HighV-QUEST the IMGT® web portal for immunoglobulin (IG) or antibody and T cell receptor (TR) analysis from NGS high throughput and deep sequencing. Immunomethods. 2012 [Google Scholar]
- 5.Bolotin DA, et al. MiTCR: software for T-cell receptor sequencing data analysis. Nat Methods. 2013;10:813–814. doi: 10.1038/nmeth.2555. [DOI] [PubMed] [Google Scholar]
- 6.Gerritsen B, Pandit A, Andeweg AC, de Boer RJ. RTCR: a pipeline for complete and accurate recovery of T cell repertoires from high throughput sequencing data. Bioinformatics. 2016;32:3098–3106. doi: 10.1093/bioinformatics/btw339. [DOI] [PMC free article] [PubMed] [Google Scholar]
- 7.Turner SJ, Doherty PC, McCluskey J, Rossjohn J. Structural determinants of T-cell receptor bias in immunity. Nat Rev Immunol. 2006;6:883–894. doi: 10.1038/nri1977. [DOI] [PubMed] [Google Scholar]
- 8.Li H, et al. Recombinatorial biases and convergent recombination determine interindividual TCRβ sharing in murine thymocytes. J Immunol. 2012;189:2404–2413. doi: 10.4049/jimmunol.1102087. [DOI] [PubMed] [Google Scholar]
- 9.Venturi V, et al. Sharing of T cell receptors in antigen-specific responses is driven by convergent recombination. Proc Natl Acad Sci U S A. 2006;103:18691–18696. doi: 10.1073/pnas.0608907103. [DOI] [PMC free article] [PubMed] [Google Scholar]
- 10.Genolet R, et al. Highly diverse TCRα chain repertoire of pre-immune CD8 T cells reveals new insights in gene recombination. EMBO J. 2012;31:1666–1678. doi: 10.1038/emboj.2012.48. [DOI] [PMC free article] [PubMed] [Google Scholar]
- 11.Ruggiero E, et al. High-resolution analysis of the human T-cell receptor repertoire. Nat Commun. 2015;6:8081. doi: 10.1038/ncomms9081. [DOI] [PMC free article] [PubMed] [Google Scholar]
- 12.Ndifon W, et al. Chromatin conformation governs T-cell receptor Jβ gene segment usage. Proc Natl Acad Sci U S A. 2012;109:15865–15870. doi: 10.1073/pnas.1203916109. [DOI] [PMC free article] [PubMed] [Google Scholar]
- 13.Howie B, et al. High-throughput pairing of T cell receptor α and β sequences. Sci Transl Med. 2015;7:301ra131. doi: 10.1126/scitranslmed.aac5624. [DOI] [PubMed] [Google Scholar]
- 14.Cinelli M, et al. Feature selection using a one dimensional naïve Bayes’ classifier increases the accuracy of support vector machine classification of CDR3 repertoires. Bioinformatics. 2017 doi: 10.1093/bioinformatics/btw771. [DOI] [PMC free article] [PubMed] [Google Scholar]
- 15.Thomas N, et al. Tracking global changes induced in the CD4 T-cell receptor repertoire by immunization with a complex antigen using short stretches of CDR3 protein sequence. Bioinformatics. 2014;30:3181–3188. doi: 10.1093/bioinformatics/btu523. [DOI] [PMC free article] [PubMed] [Google Scholar]
- 16.Day EB, et al. Structural basis for enabling T-cell receptor diversity within biased virus-specific CD8+ T-cell responses. Proc Natl Acad Sci U S A. 2011;108:9536–9541. doi: 10.1073/pnas.1106851108. [DOI] [PMC free article] [PubMed] [Google Scholar]
- 17.Miles JJ, et al. Genetic and structural basis for selection of a ubiquitous T cell receptor deployed in Epstein-Barr virus. 2011 doi: 10.2210/pdb3o4l/pdb. [DOI] [PMC free article] [PubMed] [Google Scholar]
- 18.Stewart-Jones GBE, McMichael AJ, Bell JI, Stuart DI, Yvonne Jones E. A structural basis for immunodominant human T cell receptor recognition. Nat Immunol. 2003;4:657–663. doi: 10.1038/ni942. [DOI] [PubMed] [Google Scholar]
- 19.Ishizuka J, et al. The Structural Dynamics and Energetics of an Immunodominant T Cell Receptor Are Programmed by Its Vβ Domain. Immunity. 2008;28:171–182. doi: 10.1016/j.immuni.2007.12.018. [DOI] [PubMed] [Google Scholar]
- 20.La Gruta NL, et al. Epitope-specific TCRβ repertoire diversity imparts no functional advantage on the CD8+ T cell response to cognate viral peptides. Proceedings of the National Academy of Sciences. 2008;105:2034–2039. doi: 10.1073/pnas.0711682102. [DOI] [PMC free article] [PubMed] [Google Scholar]
- 21.Rudd BD, Venturi V, Davenport MP, Nikolich-Zugich J. Evolution of the antigen-specific CD8+ TCR repertoire across the life span: evidence for clonal homogenization of the old TCR repertoire. J Immunol. 2011;186:2056–2064. doi: 10.4049/jimmunol.1003013. [DOI] [PMC free article] [PubMed] [Google Scholar]
- 22.Venturi V, Kedzierska K, Turner SJ, Doherty PC, Davenport MP. Methods for comparing the diversity of samples of the T cell receptor repertoire. J Immunol Methods. 2007;321:182–195. doi: 10.1016/j.jim.2007.01.019. [DOI] [PubMed] [Google Scholar]
- 23.Li B, et al. Landscape of tumor-infiltrating T cell repertoire of human cancers. Nat Genet. 2016;48:725–732. doi: 10.1038/ng.3581. [DOI] [PMC free article] [PubMed] [Google Scholar]
- 24.Parkhurst MR, et al. Isolation of T cell receptors specifically reactive with mutated tumor associated antigens from tumor infiltrating lymphocytes based on CD137 expression. Clin Cancer Res. 2016 doi: 10.1158/1078-0432.CCR-16-2680. [DOI] [PMC free article] [PubMed] [Google Scholar]
- 25.Pasetto A, et al. Tumor- and Neoantigen-Reactive T-cell Receptors Can Be Identified Based on Their Frequency in Fresh Tumor. Cancer Immunol Res. 2016;4:734–743. doi: 10.1158/2326-6066.CIR-16-0001. [DOI] [PMC free article] [PubMed] [Google Scholar]
- 26.Tran E, et al. Cancer immunotherapy based on mutation-specific CD4+ T cells in a patient with epithelial cancer. Science. 2014;344:641–645. doi: 10.1126/science.1251102. [DOI] [PMC free article] [PubMed] [Google Scholar]
- 27.Dash P, et al. Paired analysis of TCRα and TCRβ chains at the single-cell level in mice. J Clin Invest. 2011;121:288–295. doi: 10.1172/JCI44752. [DOI] [PMC free article] [PubMed] [Google Scholar]
- 28.Wang GC, Dash P, McCullers JA, Doherty PC, Thomas PG. T cell receptor αβ diversity inversely correlates with pathogen-specific antibody levels in human cytomegalovirus infection. Sci Transl Med. 2012;4:128ra42. doi: 10.1126/scitranslmed.3003647. [DOI] [PMC free article] [PubMed] [Google Scholar]
- 29.Dash P, Wang GC, Thomas PG. Single-Cell Analysis of T-Cell Receptor αβ Repertoire. Methods Mol Biol. 2015;1343:181–197. doi: 10.1007/978-1-4939-2963-4_15. [DOI] [PubMed] [Google Scholar]
- 30.Guo XZJ, et al. Rapid cloning, expression, and functional characterization of paired αβ and γδ T-cell receptor chains from single-cell analysis. Mol Ther Methods Clin Dev. 2016;3:15054. doi: 10.1038/mtm.2015.54. [DOI] [PMC free article] [PubMed] [Google Scholar]
- 31.Altschul SF, Gish W, Miller W, Myers EW, Lipman DJ. Basic local alignment search tool. J Mol Biol. 1990;215:403–410. doi: 10.1016/S0022-2836(05)80360-2. [DOI] [PubMed] [Google Scholar]
- 32.Lefranc MP, et al. IMGT, the international ImMunoGeneTics information system. Nucleic Acids Res. 2009;37:D1006–12. doi: 10.1093/nar/gkn838. [DOI] [PMC free article] [PubMed] [Google Scholar]
- 33.Putintseva EV, et al. Mother and child T cell receptor repertoires: deep profiling study. Front Immunol. 2013;4:463. doi: 10.3389/fimmu.2013.00463. [DOI] [PMC free article] [PubMed] [Google Scholar]
- 34.Kullback S, Leibler RA. On Information and Sufficiency. Ann Math Stat. 1951;22:79–86. [Google Scholar]
- 35.Lin J. Divergence measures based on the Shannon entropy. IEEE Trans Inf Theory. 1991;37:145–151. [Google Scholar]
- 36.Vinh NX, Julien E, James B. Information theoretic measures for clusterings comparison. Proceedings of the 26th Annual International Conference on Machine Learning - ICML ’09. 2009 doi: 10.1145/1553374.1553511. [DOI] [Google Scholar]
- 37.Henikoff S, Henikoff JG. Amino acid substitution matrices from protein blocks. Proc Natl Acad Sci U S A. 1992;89:10915–10919. doi: 10.1073/pnas.89.22.10915. [DOI] [PMC free article] [PubMed] [Google Scholar]
- 38.Rokach L, Lior R, Oded M. Data Mining and Knowledge Discovery Handbook. 2005:321–352. [Google Scholar]
- 39.Genolet R, et al. Highly diverse TCRα chain repertoire of pre-immune CD8 T cells reveals new insights in gene recombination. EMBO J. 2012;31:1666–1678. doi: 10.1038/emboj.2012.48. [DOI] [PMC free article] [PubMed] [Google Scholar]
- 40.Ruggiero E, et al. High-resolution analysis of the human T-cell receptor repertoire. Nat Commun. 2015;6:8081. doi: 10.1038/ncomms9081. [DOI] [PMC free article] [PubMed] [Google Scholar]
- 41.Ndifon W, et al. Chromatin conformation governs T-cell receptor Jβ gene segment usage. Proc Natl Acad Sci U S A. 2012;109:15865–15870. doi: 10.1073/pnas.1203916109. [DOI] [PMC free article] [PubMed] [Google Scholar]
- 42.Howie B, et al. High-throughput pairing of T cell receptor α and β sequences. Sci Transl Med. 2015;7:301ra131. doi: 10.1126/scitranslmed.aac5624. [DOI] [PubMed] [Google Scholar]
- 43.Lefranc MP, et al. IMGT, the international ImMunoGeneTics information system. Nucleic Acids Res. 2009;37:D1006–12. doi: 10.1093/nar/gkn838. [DOI] [PMC free article] [PubMed] [Google Scholar]
Associated Data
This section collects any data citations, data availability statements, or supplementary materials included in this article.
Supplementary Materials
Data Availability Statement
The processed datasets have been deposited at the NCBI Short Read Archive database with accession code:SRP101659. The data have also been uploaded to vdjdb (https://vdjdb.cdr3.net/).


