Abstract
C. elegans sleep during development is regulated by genes and cellular mechanisms that are conserved across the animal kingdom ( Singh et al., 2014 ; Trojanowski and Raizen, 2016). C. elegans developmental sleep is usually assessed during the transition to adulthood, a 2.6 h time interval called lethargus ( Raizen et al., 2008 ; Singh et al., 2011 ). During lethargus, animals cycle between periods of immobility (sleep bouts) and periods of active locomotion (motion bouts). Sleep bouts resemble sleep in other species based on behavioral criteria, including cessation of feeding and locomotion, increased arousal threshold for response to sensory stimulation, rapid reversibility, and homeostatic response to sleep loss. Several assays have been developed to study sleep in C. elegans ( Belfer et al., 2013 ; Bringmann, 2011; Nelson et al., 2013 ; Raizen et al., 2008 ). Here, we contribute a detailed protocol for assessment of C. elegans sleep during lethargus, which has been used successfully by many research groups, incorporating simple microfluidic chambers, a low cost camera with lighting system, and computational analysis based on image subtraction. We note that this system could be easily adapted to assess sleep in any small animal.
Keywords: C. elegans sleep , Lethargus, Microfluidic chambers, Image subtraction, Total sleep, Lethargus duration, Average bout duration, Quiescence
Background
C. elegans sleep is often assessed based on the cessation of locomotion, which is a common characteristic of sleep across the animal kingdom. Due to the intermittent nature of sleep bouts during C. elegans developmental sleep, computer vision is generally used to track the activity of C. elegans during lethargus. Animals are constrained to a single focal plane to keep them in focus. Because C. elegans can be exhausted in liquid by prolonged swimming (Ghosh and Emmons, 2008), C. elegans sleep researchers rely almost exclusively on assay formats that enforce crawling, not swimming. Also, because food may dramatically alter behavior, C. elegans sleep studies are usually undertaken in the presence of bacterial food. There are two major assay formats: animals confined to larger spaces and tracked across multiple developmental stages ( Belfer et al., 2013 ; Nelson et al., 2013 ; Raizen et al., 2008 ) or animals confined to small spaces and tracked for shorter time intervals (Bringmann, 2011; Singh et al., 2011 ). The original report of C. elegans sleep utilized the first assay format, which permitted detection of sleep during each larval lethargus as animals crawled on the surface of a culture dish. This required one camera per animal, which limited throughput ( Raizen et al., 2008 ). More recent work generally uses small chambers arranged in tight groupings, which allows simultaneous tracking of multiple animals with one camera. Various small-chamber formats are available. An automated polydimethylsiloxane (PDMS) chamber system is available with 60 chambers, but this format requires high levels of consistency in chamber loading with media and seeding bacteria, which is best achieved with robotic systems ( Nelson et al., 2013 ). As these systems are not widely available to academic labs, most groups use other assay formats. Very small chambers constructed from agarose hydrogels have also been used to constrain locomotion of L1 larvae and it is possible that these could be reformatted for use with older C. elegans larval stages (Bringmann, 2011). But, agarose hydrogels are not easily reusable and most C. elegans sleep research focuses on the last lethargus, during the transition to adulthood. Here, we describe in detail a tractable PDMS-based, small chamber assay system, which allows simultaneous tracking of up to 10 L4 to adult animals. This is a variation of an earlier 6-chamber format assay ( Singh et al., 2011 ). The assay is based on reusable PDMS chips and requires a minimal space to track animals in the last larval lethargus. The small chamber assay format described here requires reagents and equipment that are readily available in most C. elegans laboratories and has been adapted by several groups beyond our own.
Materials and Reagents
1.5 ml Eppendorf tube
Glass slides (Fisher Scientific, catalog number: 12-550-343)
Tape (e.g., FisherbrandTM 0.75 in. colored label tapes, Fisher Scientific, catalog number: 15-901-20A for white tapes)
100 mm Petri dishes (e.g., Sigma-Aldrich, catalog number: P5856)
Cover slip, 25 x 25 mm, glass (VWR, catalog number: 48368084)
15 ml Falcon tubes (Corning, catalog number: 352095)
Parafilm (Bemis, catalog number: PM999)
FisherbrandTM Pasteur pipette (Fisher Scientific, catalog number: 22-183624) with dropper bulb
Double sided tape (e.g., Scotch permanent double sided tape, Staples, catalog number: 504829)
C. elegans strains: standard wild type laboratory strain, N2. Additional strains are also available at the Caenorhabditis Genetics Center (CGC, http://cbs.umn.edu/cgc)
Escherichia coli OP50 strain (available at the CGC)
Antibiotics-treated OP50 (made from E. coli, preparation procedure provided below)
Sylgard® 184 silicone elastomer kit (Dow Corning, catalog number: BCBI10824)
Ethanol
LB agar (BD, catalog number: 240110)
Kanamycin (Sigma-Aldrich, catalog number: K1876)
Sodium chloride (NaCl) (Fisher Scientific, catalog number: BP358-212)
BactoTM peptone (BD, BactoTM, catalog number: 211677)
Magnesium sulfate heptahydrate (MgSO4.7H2O) (Fisher Scientific, catalog number: BP213-1)
Calcium chloride dihydrate (CaCl2.2H2O) (Fisher Scientific, catalog number: BP510-250)
Cholesterol (Sigma-Aldrich, catalog number: C8667)
Potassium phosphate buffer (pH 6)
BactoTM agar (BD, BactoTM, catalog number: 214010)
Liquid nematode growth media (NGM) for re-suspending antibiotic-treated OP50 (see Recipes)
2% agar for sealing chambers (see Recipes)
Equipment
Microfluidic chamber chip (design and instructions provided)
Template mask/mold: http://www1.simtech.a-star.edu.sg/smf, http://www.flowjem.com
Oven
Spectrometer (e.g., Thermo Fisher Scientific, Thermo ScientificTM, model: NanoDropTM 2000 Spectrophotometers, catalog number: ND-2000C)
Heating block (e.g., Benchmark two-block digital dry bath, Benchmark, catalog number: BSH1002)
Centrifuge for 50 ml conical tubes (e.g., Eppendorf, model: 5810 R)
Tabletop centrifuge for 1.5 ml Eppendorf tubes (e.g., Eppendorf, model: 5424)
Shaker (e.g., Eppendorf, New BrunswickTM, model: Innova® 44, catalog number: M1282-0000)
Dissection scope (e.g., Zeiss, model: SteREO Discovery.V8) or other light source
Camera with time-lapse imaging software or custom script (at least 2MP, e.g., Zeiss AxioCam ICc3 [Zeiss, model: AxioCam ICc3] with ZEN software or less expensive cameras with custom imaging acquisition software you write or obtain)
Computer for image acquisition and analysis
Software
MATLAB (MathWorks, Inc.)
Open source software: Python 2.7.3 or up (but not Python 3), Numpy 1.6.2 or up, Scipy-0.10.1 or up, and Matplotlib-1.1.1 or up
Procedure
-
Making microfluidic chips
Each chamber on the microfluidic chip is designed to contain one animal, which allows unambiguous tracking of movement by an individual animal. We consistently hand-loaded chips containing 10 individual assay chambers. Chambers were designed to provide sufficient space for locomotion, and to promote crawling. Swimming leads to exhaustion-induced sleep and, thereby, confounds developmental sleep assessment. For assessing sleep after larval stage 4 (L4) during the L4/adult lethargus, a chamber height of 30 μm confines animals to a single focal plane and promotes crawling (Figure 1). Additionally, each chamber contains numerous hexagonal posts of 50 μm in diameter. These are closely spaced to promote crawling, with a minimum gap of 130 μm, based on previous work ( Lockery et al., 2008 ). We provide an AutoCAD file for a 10-chamber microfluidic chip in the Supplement. Chamber designs must be altered if a different size animal or a different developmental stage is to be examined. For example, if an earlier developmental stage is preferred, a shorter chamber height and smaller gaps between posts should be used to promote animal crawling.
Order template mask/mold for microfluidic chip. Any commercial sources for custom mold and chip fabrication are appropriate, e.g., http://www1.simtech.a-star.edu.sg/smf, http://www.flowjem.com.
Create microfluidic chips from the mold using a Sylgard® 184 silicone elastomer (PDMS) kit with 1:10 ratio of cross-linker/curing agent A to siloxane B. PDMS should be poured to roughly 4 mm thick over the mold. Cure the PDMS in an oven at 55 °C for 18 h. Peel away the PDMS from the mold and trim to create chips with chambers centered in a roughly 14 x 16 mm rectangle chip.
New PDMS chips are hydrophobic, which makes it hard to fill chambers with liquid. Soaking the chips in OP50 liquid culture (from step B2, below) at room temperature overnight, followed by washing with water and ethanol renders the PDMS less hydrophobic. To completely de-gas chips before loading animals, chips are left to dry on the bench for a week at room temperature in an unsealed container.
-
Preparing antibiotics-treated OP50
Streak out OP50 E. coli onto an LB agar plate from the glycerol stock (see https://www.addgene.org/plasmid-protocols/bacterial-plates/). Culture at 37 °C overnight.
The next day, inoculate a single colony into 100 ml liquid LB (https://www.addgene.org/plasmid-protocols/inoculate-bacterial-culture/). Grow OP50 culture at 30 °C for 18 h at 220 rpm or 37 °C for 12 h at 220 rpm.
-
Remove 300 μl from the overnight liquid LB culture and add 600 μl LB. Determine bacteria concentration by optical density using a spectrometer at 600 nm. Concentrate the culture to a final OD600 of 10 by spinning, removing excess liquid, and re-suspending the bacterial pellet. Add kanamycin to the re-suspended bacteria to yield a final concentration of 25 ng/ml of antibiotic; this will prevent OP50 growth. Store the concentrated OP50 + kanamycin culture at 4 °C.
Note: The bacteria have to be completely static for a sleep assay, else bacterial metabolic products lead to C. elegans stress and less sleep. Therefore, the concentrated OP50 + kanamycin culture has to age for at least a week before setting up a sleep assay. Then, it should be used within five weeks.
-
Loading animals to the chambers
Before setting up a sleep assay, turn on a heating block to 90 °C and use it to melt 2% agar for use in step D2.
Transfer 200 μl of OP50 + kanamycin culture into a 1.5 ml Eppendorf tube. Centrifuge at 845 × g for 4 min to pellet the bacteria. Remove the supernatant and resuspend the pellet with 300 μl liquid NGM. This creates ‘movie food’ (final OD600 of 6.7) that animals eat while in the chamber. Movie food must be prepared fresh for each assay and used within a few hours.
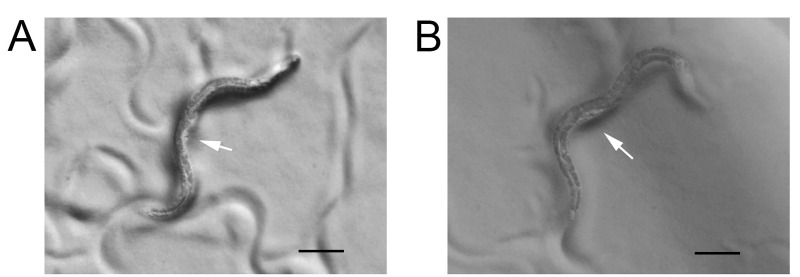
Pick early- to mid-L4 larval stage animals (Figure 2) to new plates for each genotype/treatment to be tested. Morphological characteristics of the vulval developmental staging can be found in ( Mok et al., 2015 ). Animals from L4.2 to L4.5 described in Figure 1 of this article are usually loaded into chambers for the sleep assessment.
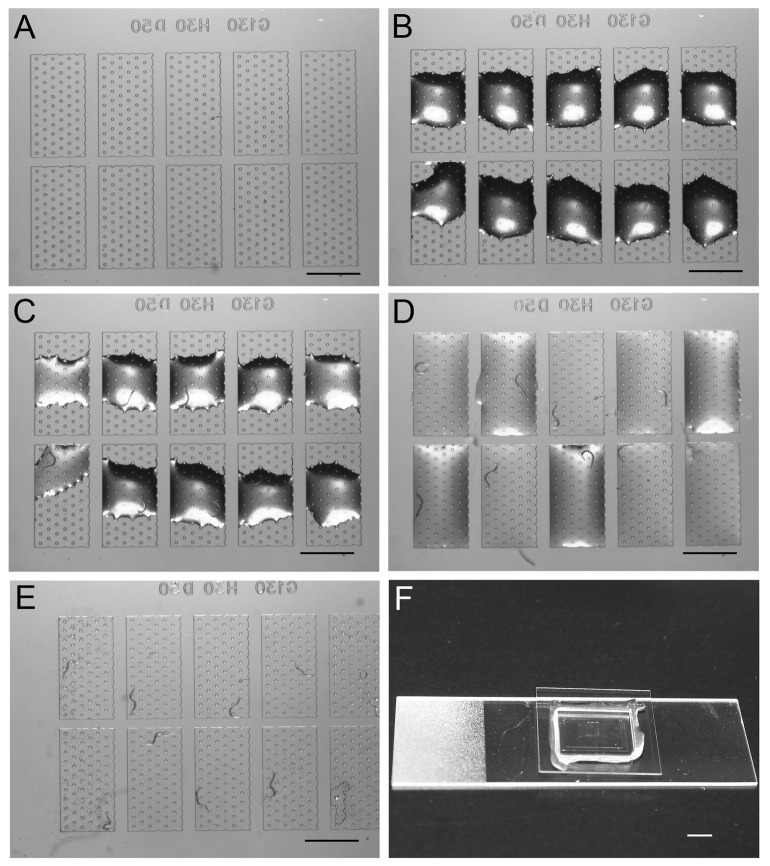
Place a glass slide on the dissection scope stage and center the chip on the slide. Press the adhesive side of lab tape firmly onto the chip to clean both the top (side with chambers) and the bottom (flat side). Place the chip with the top chamber-side facing up and open (Figure 3A).
-
Take 5 μl of movie food and place 1 drop (approximately 0.5 μl) on each of the 10 chambers (Figure 3B). Movie food drops should not touch each other. Pick one animal into each drop. One chamber can be left empty as a blank control (Figure 3C). Try to avoid bringing solid OP50 from the plate to the movie food, as bacterial growth in the chamber is detrimental to animals. Once all the animals are loaded to the chambers, place the cover glass onto the chip (Figure 3E). Practice loading of chips is suggested, which increases ability to trap one animal per chamber, with no big air bubbles inside the chamber.
Notes:
The amount of movie food on each chamber when the cover slip is dropped in step C5 is critical for success. Animals will move across the chip surface with too much liquid, resulting in two or more animals in the same chamber and loss of data from both. Conversely, too little liquid results in large air bubbles that expand over time and interfere with motion detection by image subtraction. We find that in dry seasons especially during winter, even small air bubbles will expand quickly over time. To prevent data loss, we recommend a modification after step C5. After sealing the cover slip and chip with agar, tape the slide inside a 100 mm Petri dish, and fill the Petri dish with ddH2O up to the level of the cover slip. Make sure there is no water above the cover slip. Use double sided tape to secure the Petri dish onto the imaging platform.
Movie food droplets can evaporate while animals are being loaded. In initial trials, we recommend distributing 10 μl of movie food onto the 10 chambers, yielding 1 μl/chamber. And, in initial trails, load only 5 animals onto each chip. Also, it may be convenient to move animals from plates to an extra large drop of liquid NGM near the chambers, followed by distribution of animals into drops atop chambers. Remove the extra large drop before proceeding to step C5.
-
Press a single cover slip down firmly onto the chip. Use molten 2% agar (from the 90 °C heating block) to create a ring of agar that completely seals the junction between the chip and cover glass (Figure 3F). This prevents liquid evaporation and air infiltration into the chambers.
Notes:
Regrettably, it is common for inexperienced practitioners to have multiple animals trapped in the same chamber or to have air bubbles in chambers. To maximize the number of usable chambers with single animals and to prevent air bubbles, we recommend spreading the movie food droplet on each chamber with your pick so it covers the entire chamber surface, but does not contact the movie food droplet atop the next chamber (Figure 3D). If the chip is very hydrophobic, plasma cleaning will render the PDMS chip temporarily hydrophilic. Or, incubate chip in OP50 overnight again (step A3).
The velocity of cover slip addition is critical. Too fast results in creating bubbles; too slow results in animals shifting to other chambers. Practicing without animals is recommended.
-
Acquiring images at set frequency
After animals are loaded to the chambers and sealed with cover glass, tape the coverslip/chip assembly to the imaging platform so the edges of the chamber are parallel to the edges of the camera image and the chambers with animals are centered in the camera image. Carefully center the chambers to provide the most uniform illumination and consistent results.
Set up the computer/camera system to record activity for an extended length of time (usually 12 h) to catch each lethargus entry and exit, as well as sleep bout number and duration. Animals must be brought into sharp focus for maximum detection of movement. See notes below for camera setups. Image capture frequency is determined by experimental design and is dependent on appropriate camera settings and computer storage/processing available. We normally acquire one image every 10 sec for 12 h. This allows easy discrimination between control/wild type and mutant animals with sleep defects. The sleep defects observed include changes in total time in sleep bouts, changes in bout duration or frequency, and altered lethargus duration. These can be calculated with the analysis strategy described below. Postural changes in sleep have been reported; it should be possible to detect these using other image analysis programs (Ghosh and Emmons, 2008; Iwanir et al., 2013 ).
-
After images are captured, the cover slip removed, the agar and animals are discarded. The chip should be washed with water for reuse. Chips can be used indefinitely, unless damaged. We have not been able to recover individual animals from chambers.
Notes:
Any dissection scope mounted with a 2MP or higher camera equipped with time-lapse image acquisition software can be used to acquire the images. Or, simply suspend a camera and lens that can image an area slightly larger than the chambers, above a reflected illumination glass stage. We have used a 50 mm fixed focal length 10 megapixel lens with manual focus and iris (F-stop: 2.0, Filter: 30.5, Pitch: 0.5, Graftek Imaging), combined with Allied Vision Technologies Guppy Pro F-503 color CCD camera (Edmund Optics). These were combined with a Schneider C-mount Extension Tube Kit (B & H Photo) to achieve the desired field of view, as described in our previous on-line article (Huang, 2013). Any camera and lens system that can yield a high resolution, high contrast image of animals in the chamber region can be used, as shown in Figure 3.
Black and white images are strongly recommended. We use a variety of cameras and software for image acquisition. The software should provide JPG images as output.
Lighting must be consistent and stable. Set the lighting to give best contrast between the animals and the background to maximize detection of motion. The images in Figure 4 are a good illustration of this. Also bright illumination will minimize the impact of changes in room illumination. Once lighting levels are determined that give consistent and good results, use the lighting level for all future experiments.
Camera noise and other noise should be determined for each experimental set-up, based on image analysis of chambers run without animals, using experimental levels of illumination. See below for details.
-
Analyzing images
-
Introduction to image analysis: the first step of analysis is image subtraction. The algorithm calculates pixel difference between adjacent images for each chamber and then subtracts camera noise for each pixel ( Singh et al., 2011 ). The output file from this analysis contains a list for each chamber of pixel differences for each consecutive pair of images. Below is a step-by-step guide to use the Hart laboratory image subtraction program in MATLAB. Go to https://github.com/Huiyan-Huang and download all the files from the image subtraction branch. Before running this analysis, the camera noise has to be determined. Please refer to the note section below to set the variable tolerance (tol) for the image subtraction script. Tolerance has to be adjusted for each camera using the experimental levels of illumination.
-
Consolidate JPG images from one chip into a single folder. The image names must increment sequentially (e.g., test0001.jpg, test0002.jpg, …). In this example, the image folder name is called yyyy.mm.dd.N2.12h.
Note: If your movies are in video format, they must be saved as individual JPG images.
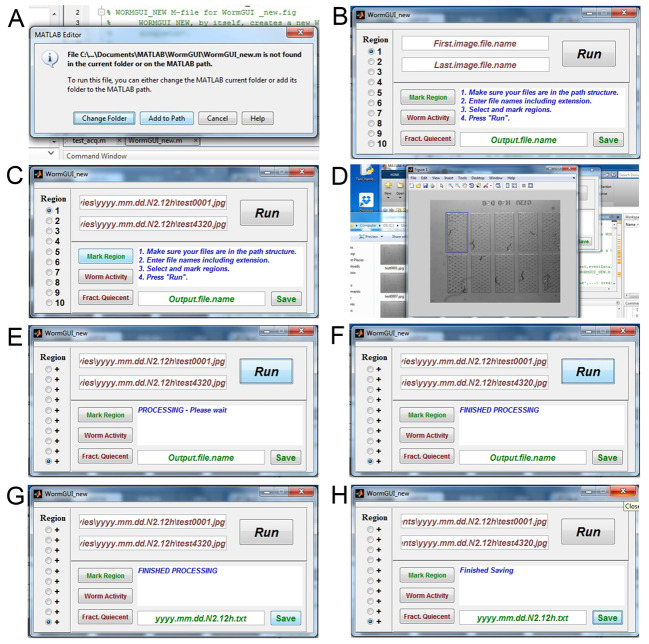
Open MATLAB on the same computer. Within MATLAB, open the WormGUI_10 folder from the ‘Current Folder’ window in the MATLAB interface. Open WormGUI_new.m file in MATLAB. Click the green ‘Run’ button above the MATLAB editor window. If WormGUI_new.m is not found in the current folder or on the MATLAB path, a message window will pop up. Select ‘Add to Path’ (Figure 4A) and the WormGUI_new window will appear (Figure 4B).
The WormGUI window needs to know where the image files to be analyzed are stored on the computer. Copy the path name (e.g., C:\Users\Hart_E5430\Desktop\Sleep movies\yyyy.mm.dd.N2.12h) for the folder containing your image files and paste it in the window that says ‘First.image.file.name’ in the WormGUI. Add the name of your first image file to the path name (e.g., C:\Users\Hart_E5430\Desktop\Sleep movies\yyyy.mm.dd.N2.12h\test0001.jpg). Do the same for the path and name of your last image file in the window below that says ‘Last.image.file.name’ (Figure 4C) (e.g., C:\Users\Hart_E5430\Desktop\Sleep movies\yyyy.mm.dd.N2.12h\test4320.jpg)
Select the chamber to be analyzed using the buttons to the left. Click ‘Mark Region’ to open the first image. Draw a box around the first chamber to mark it as Region 1. Close the popped up image. Do the same for the next 9 chambers. The boxes you draw here do not need to be equal in size. But, for sleep analysis, the entire chamber must be contained within the demarcated region to avoid loss of experimental data (Figure 4D).
Click the ‘Run’ button in the WormGUI to start the analysis. When the message window shows ‘Processing – Please wait’, do not close the WormGUI window (Figure 4E). Keep an eye on the MATLAB command window, if error messages occur, close the WormGUI window and repeat from step E1a.
When the message in the WormGUI changes to ‘FINISHED PROCESSING’ (Figure 4F), fill in the window below that says ‘Output.file.name’ with a name for your result file with a .txt extension (e.g., yyyy.mm.dd.N2.12h.txt). Click the ‘Save’ button (Figure 4G) and close the window when the message says ‘Finished Saving’ (Figure 4H).
The results file will be in the MATLAB current folder. We recommend creating a new results folder on your computer (e.g., C:\Users\Hart_E5430\Desktop\Sleep movies\Results) and copying the results file into it. Note the path of this new results file for the analysis in the next step (e.g., C:\Users\Hart_E5430\Desktop\Sleep movies\yyyy.mm.dd.N2.12h.txt).
Note: Value of the variable ‘tol’ is determined empirically for each camera/illumination intensity and is equal to the maximum pixel difference between adjacent images when no motion occurs in the chamber. We recommend taking a series of images (e.g., every 10 sec for 20 min) for an empty chip and running the image subtraction analysis and sleep metrics calculation (below). In our image acquisition systems, tol is usually between 25 and 50. Values of tol that are too low or high will mask sleep or motion, respectively. ‘tol’ should be iteratively determined and set to the lowest value that gives no motion for empty chambers. To initially set the value for tol, open MATLAB. Within MATLAB, open the WormGUI_10 folder from the ‘Current Folder’ window in the MATLAB interface. Open WormActivity.m file in MATLAB. In the MATLAB ‘Editor’ window, change the value for tol in line 18 (Figure 5A). Click the ‘Save’ button on the top. Using the same value for tol, open RunWorms.m and change the value for tol in line 22 (Figure 5B). Save the changes.
-
-
Here, image subtraction values are used to determine a rolling average for sleep across time, an analysis strategy first suggested by Raizen et al. in 2008. Each image subtraction event is assigned a value of either 1 (animal did not move, pixel difference zero or less) or 0 (animal moved, pixel value non-zero). The image subtraction result file is first converted to a list of 0’s and 1’s for individual animals. Then, lethargus duration, total sleep, average bout duration, and other metrics are calculated. Comparison of the total sleep of mutant animals to wild type control animals is not sufficient to rule out changes in sleep. We suggest, at a minimum, reporting lethargus duration and bout duration in the analysis as well, as some mutant strains with aberrantly short sleep bout duration have normal total sleep quantity during L4/adult lethargus due to increases in lethargus duration. Bout number and frequency are also important metrics, but they can be derived from total sleep, average bout duration and lethargus duration. It should be noted that detailed descriptions of changes in sleep and motion bout timing and duration within lethargus are possible and may be important in future studies.
-
First, we define the metrics.
Lethargus entry is defined as fractional Quiescence (fQ) stays above 0.1 for at least 20 min. fQ is calculated as the rolling average for 60 frames, i.e., 10 min. Lethargus entry is further adjusted to be the first frame of the first bout from the 60 frames used to calculate fQ.
Lethargus exit is defined as fQ stays below 0.1 for at least 20 min. Lethargus exit is further adjusted to be the last frame of the last bout from the 60 frames used to calculate fQ.
Lethargus duration is the duration between lethargus entry and exit.
Total sleep is the total time spent in sleep between lethargus entry and exit. Note that behavioral lethargus may extend past the time of vulval eversion in some mutant strains.
Average bout duration is the average bout duration across all of lethargus, between lethargus entry and exit.
Bout number is the total number of bouts between lethargus entry and exit. Note that bout frequency decreases later in lethargus.
-
Below is a step-by-step guide to use the Hart lab sleep metrics calculation script, run in Python.
First, install the following free software: Python 2.7.3 or up (but not Python 3), Numpy 1.6.2 or up, Scipy-0.10.1 or up, and Matplotlib-1.1.1 or up.
Once Python is installed on your computer, go to https://github.com/Huiyan-Huang and download the TenChamberSingleFileV2.py file from the sleep metrics calculation branch. Copy the file to your ‘C:\Users\Documents\Results’ folder from the image subtraction analysis. This script calculates sleep metrics for images taken every 10 sec. If a different image frequency is used, please contact us for modified instructions.
-
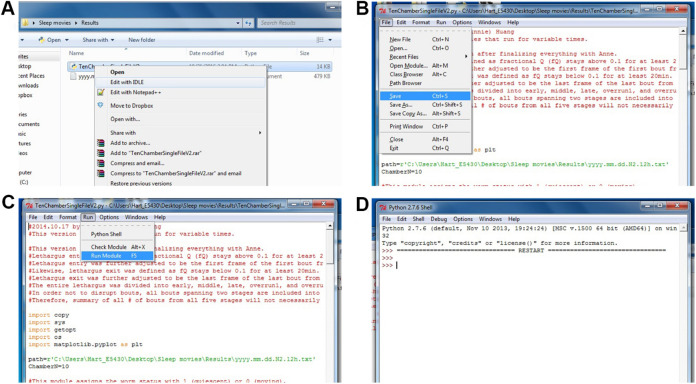
To run the analysis, right click ‘TenChamberSingleFileV1.py’, select ‘Edit with IDLE’ (Figure 6A). The Python script will be opened. Find the line with path=r’C:\Users\...\...\...txt’. Substitute ‘C:\ Users\...\...\...txt’ with the path for your result file from the above image subtraction algorithm (e.g., path=r’C:\Users\Hart_E5430\Desktop\Sleep movies\Results\ yyyy.mm.dd.N2.12h.txt’).
Note: It is important that you do not accidentally delete any part of the quotation mark (‘’) and the ‘r’ in front of the quotation mark. Also make sure the line beneath says ‘ChamberN=10’.
In the top menu bar, choose ‘File’, and click ‘Save’ (Figure 6B). Then, choose ‘Run’, and click ‘Run Module’ (Figure 6C). A Python shell will popup. Once you see two ‘>>>’ (Figure 6D), the analysis is done.
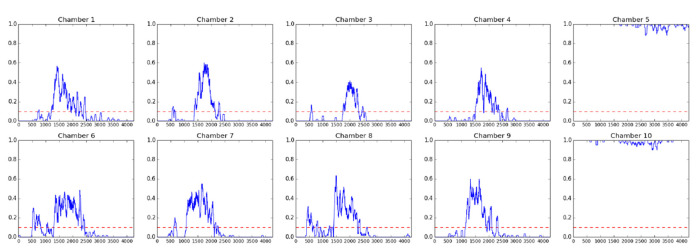
Now, in the same path as your .txt file, there will be two new files. One shows you the fractional quiescence over frames (Figure 7) and the other contains the detailed analysis for each chamber (Table 1).
-
-
Figure 1. The 10-chamber PDMS chip.
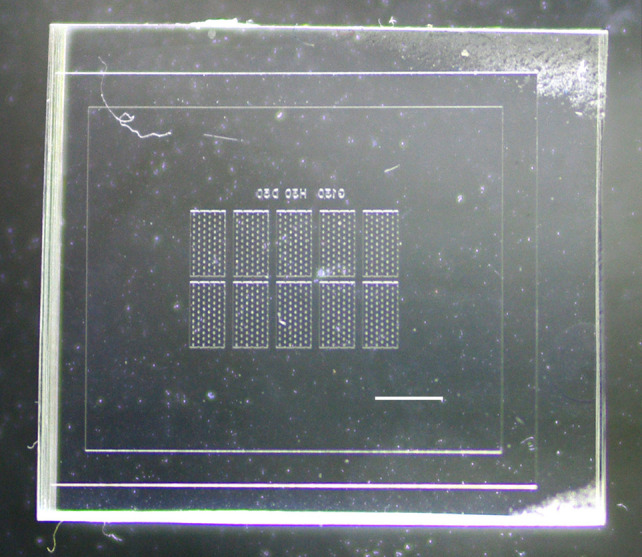
Scale bar = 2 mm.
Figure 2. Early- and mid-L4 larval stage animals.
A. Early L4 animal with a white crescent and arrow points to a triangle vulval lumen that is corresponding to L4.2 stage in Figure 1 of the reference ( Mok et al., 2015 ). B. Mid-L4 animal with a white crescent and arrow points to a crown shaped vulval lumen that is corresponding to L4.5 stage in Figure 1 of the reference ( Mok et al., 2015 ). Scale bars = 100 μm.
Figure 3. Procedures to load animals to the chambers.
A. Cleaned chip ready for the assay. B. Distribution of food droplets into each chamber. C. Early- to mid-L4 animals loaded into each droplet, leaving two as blank controls. D. Spreading of movie food across each chamber surface aid before adding the coverslip will decrease the odds of having two animals trapped in the same chamber. E. Coverslip is now in place, which traps each animal into a single chamber. Scale bars = 1 mm. F. The cover glass-chip-slide sandwich assembled for imaging. Scale bar = 5 mm.
Figure 4. Image subtraction analysis.
A. Possible message when running the WormGUI_new script; B. The WormGUI_new pop-up window; C. Path for the first and last images filled into the windows; D. The pop-up window for selecting each chamber as a region; E. Message for processing image subtraction; F. Message for finished processing; G. Name for result file entered; H. Message for finished saving the result file.
Figure 5. Set the value for viable tol.
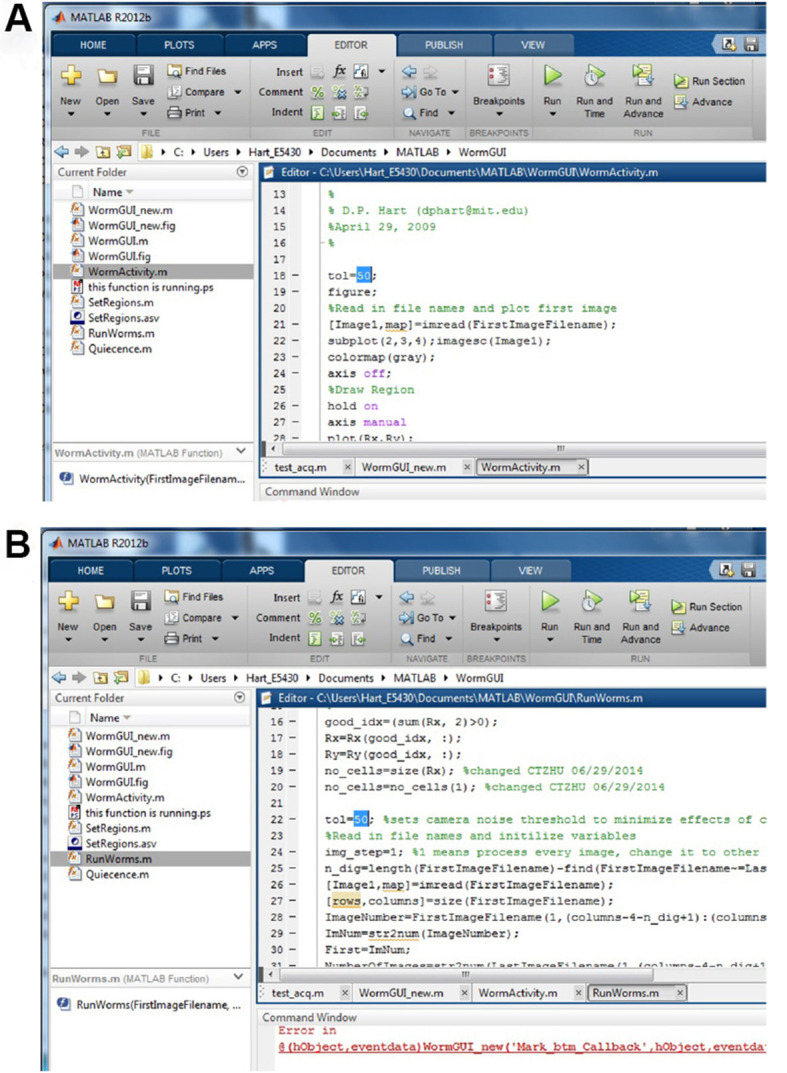
A. Set the tol in WormActivity.m; B. Set the tol in RunWorms.m.
Figure 6. Calculating sleep metrics.
A. Opening the Python script to calculate the sleep metrics; B. Saving the changes made for the analysis; C. Running the Python module to calculate the sleep metrics; D. Python shell has now finished processing.
Figure 7. Fractional quiescence (fQ) plots for animals in each chamber.
Each point represents the rolling average of surrounding 60 frames (10 min), when motion is assigned 0 and inactivity is assigned 1. Chamber 5 and chamber 10 did not contain animals, but did contain air bubbles which changed in size while imaging was occurring, which is reported as some movement in the graphs. The x-axis is frame number and the y-axis shows fQ. The red dotted line marks the 0.1 fQ threshold that is used to call entry and exit of lethargus. Here, we show the fQ plots for L4 to adult animals. For fQ plots of animals at other developmental stages, please refer to Figure 1 in a previous report of C. elegans sleep ( Raizen et al., 2008 ).
Table 1. Corresponding sleep metrics for N2 wild type animals shown in Figure 6 .
| name | entry/h | exit/h | duration/h | Corrected totalQ/min | tAPD/s | t# |
|---|---|---|---|---|---|---|
| 1 | 3.4 | 7.0 | 3.5 | 50 | 25 | 124 |
| 2 | 3.9 | 6.5 | 2.6 | 45 | 24 | 113 |
| 3 | 4.9 | 7.0 | 2.1 | 28 | 21 | 82 |
| 4 | 4.3 | 6.7 | 2.4 | 37 | 25 | 90 |
| 5 | 0.0 | 12.0 | 12.0 | 701 | 948 | 45 |
| 6 | 3.7 | 6.9 | 3.2 | 56 | 22 | 153 |
| 7 | 3.0 | 6.3 | 3.3 | 59 | 21 | 168 |
| 8 | 3.5 | 6.7 | 3.2 | 51 | 23 | 136 |
| 9 | 3.3 | 6.0 | 2.7 | 52 | 22 | 143 |
| 10 | 0.0 | 12.0 | 12.0 | 701 | 992 | 43 |
Data analysis
Table 1 provides an example of sleep analysis results. We normally compare the total sleep (Table 1, ‘Corrected totalQ/min’ column) between mutant and wild type/control animals. Some mutant animals also differ in lethargus duration (Table 1, ‘duration/h’ column) and average bout duration (Table 1, ‘tAPD/s’ column). Ideally, control animals and experimental animals should be loaded on the same chip or other strategies should be employed to allow direct comparison between different genotypes, different trials and/or different days of data collection. A minimum of 10 animals for each genotype should be examined; larger numbers for experimental and control animals will be required if differences between genotypes are small or behavior is variable for a given genotype. Statistic analysis should be done with comparable number of animals run for both wild type/control and genotype of your interest. A Student’s t-test can be used to compare the results, if both samples fall in a normal Student’s t-distribution. Other analysis should be employed if the results follow other distributions.
Data from chambers with two or more animals must be excluded, as image subtraction does not track individual animals, just movement within the chamber. Data from chambers with big air bubbles that do not disappear before animals enter lethargus must be excluded as well, as bubble movement cannot be discriminated from animal movement by image subtraction. Meanwhile, animals that do not recover to normal levels of active locomotion within 30 min of chamber loading are excluded from analysis, as these are animals that were trapped or died during recording. This can be determined by rapidly reviewing the images the next day, before analysis.
Notes
Temperature impacts sleep during lethargus. Studies should be done with consistent temperature control.
We recommend using previously defined C. elegans strains for calibration. N2 and egl-4 loss of function are commonly used.
If illumination, image size, noise, and other parameters are set appropriately, total sleep for 10 to 15 N2 wild type animals at 22 degrees Celsius should average 50 to 65 min during L4/adult lethargus.
Recipes
-
Liquid nematode growth media (NGM) for re-suspending antibiotics-treated OP50
0.3 g NaCl0.25 g peptone97.5 ml ddH2O100 μl 1 M MgSO4100 μl 1 M CaCl2100 μl 5 mg/ml cholesterol2.5 ml 1 M potassium phosphate buffer (pH 6)Filter sterilize and aliquot into 15 ml Falcon tubes
Take out one tube at a time and aliquot into 1.5 ml tubes
Note: The 15 ml aliquot can be sealed with Parafilm and stored at 4 °C for years, if not contaminated. The 1.5 ml aliquot can be stored at room temperature for months.
-
2% agar for sealing chambers
2 g agar100 ml ddH2O Microwave to dissolve/melt agar. Aliquot 2% agar into small quantities and store at 4 °C
Note: As long as nothing is growing in the agar, it should be good to use for years.
Acknowledgments
This work was supported by the National Institutes of Health NIH R01 NS055813 (A.C.H.) and Postdoctoral Fellowship in Translational Neuroscience (H.H.). This is a modification of a protocol reported previously ( Singh et al., 2011 ). All experimental protocols were approved by appropriate institutional review boards. We have no conflict of interest.
Citation
Readers should cite both the Bio-protocol article and the original research article where this protocol was used.
References
- 1.Belfer S. J., Chuang H. S., Freedman B. L., Yuan J., Norton M., Bau H. H. and Raizen D. M.(2013). Caenorhabditis-in-drop array for monitoring C. elegans quiescent behavior . Sleep 36(5): 689-698G. [DOI] [PMC free article] [PubMed] [Google Scholar]
- 2.Bringmann H.(2011). Agarose hydrogel microcompartments for imaging sleep- and wake-like behavior and nervous system development in Caenorhabditis elegans larvae . J Neurosci Methods 201(1): 78-88. [DOI] [PubMed] [Google Scholar]
- 3.Ghosh R. and Emmons S. W.(2008). Episodic swimming behavior in the nematode C. elegans . J Exp Biol 23): 3703-3711. [DOI] [PubMed] [Google Scholar]
- 4.Huang H., Zhu C. T. and Hart A.(2013). How to measure lethargus quiescence without monopolizing the dissection microscopes in your lab. The Worm Breeder’s Gazette 19(3). [Google Scholar]
- 5.Iwanir S., Tramm N., Nagy S., Wright C., Ish D., and Biron D.(2013). The microarchitecture of C. elegans behavior during lethargus: Homeostatic bout dynamics, a typical body posture, and regulation by a central neuron . Sleep 36(3): 385-395. [DOI] [PMC free article] [PubMed] [Google Scholar]
- 6.Lockery S. R., Lawton K. J., Doll J. C., Faumont S., Coulthard S. M., Thiele T. R., Chronis N., McCormick K. E., Goodman M. B. and Pruitt B. L.(2008). Artificial dirt: microfluidic substrates for nematode neurobiology and behavior. J Neurophysiol 99(6): 3136-3143. [DOI] [PMC free article] [PubMed] [Google Scholar]
- 7.Mok D. Z. L., Sternberg P. W., and Inoue T.(2015). Morphologically defined sub-stages of C. elegans vulval development in the fourth larval stage . BMC Dev Biol 15:26. [DOI] [PMC free article] [PubMed] [Google Scholar]
- 8.Nelson M. D., Trojanowski N. F., George-Raizen J. B., Smith C. J., Yu C. C., Fang-Yen C. and Raizen D. M.(2013). The neuropeptide NLP-22 regulates a sleep-like state in Caenorhabditis elegans . Nat Commun 4: 2846. [DOI] [PMC free article] [PubMed] [Google Scholar]
- 9.Raizen D. M., Zimmerman J. E., Maycock M. H., Ta U. D., You Y. J., Sundaram M. V. and Pack A. I.(2008). Lethargus is a Caenorhabditis elegans sleep-like state . Nature 451(7178): 569-572. [DOI] [PubMed] [Google Scholar]
- 10.Singh K., Chao M. Y., Somers G. A., Komatsu H., Corkins M. E., Larkins-Ford J., Tucey T., Dionne H. M., Walsh M. B., Beaumont E. K., Hart D. P., Lockery S. R. and Hart A. C.(2011). C. elegans Notch signaling regulates adult chemosensory response and larval molting quiescence . Curr Biol 21(10): 825-834. [DOI] [PMC free article] [PubMed] [Google Scholar]
- 11.Singh K., Ju J. Y., Walsh M. B., DiIorio M. A. and Hart A. C.(2014). Deep conservation of genes required for both Drosophila melanogaster and Caenorhabditis elegans sleep includes a role for dopaminergic signaling . Sleep 37(9): 1439-1451. [DOI] [PMC free article] [PubMed] [Google Scholar]
- 12.Trojanowski N. F. and Raizen D. M.(2016). Call it Worm Sleep. Trends Neurosci 39(2): 54-62. [DOI] [PMC free article] [PubMed] [Google Scholar]


