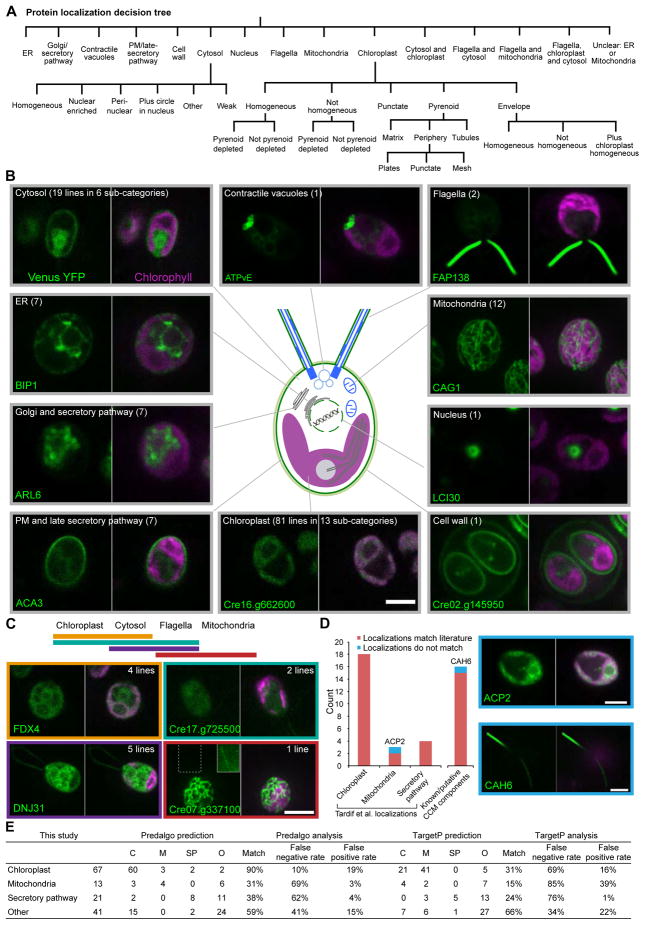
Figure 2. Tagged Proteins Localized to a Diverse Range of Cellular Locations, and Revealed That CAH6 Localizes to Flagella.
(A) A decision tree was used to assign proteins to specific subcellular locations.
(B) Representative images of proteins localized to different cellular locations. The number of different lines showing each localization pattern is in parentheses.
(C) Representative images of proteins that localized to more than one compartment. The solid outer line inset in the Cre07.g337100 image is an overexposure of the region surrounded by a dashed line, to highlight flagellar fluorescence.
(D) Comparison of our observations with published localizations. Images show the two proteins that did not match their published locations. All scale bars: 5 μm.
(E) Comparison of our observations with localizations predicted by PredAlgo and TargetP.

