

SUMMARY
Cells operate through protein interaction networks organized in space and time. Here, we describe an approach to resolve both dimensions simultaneously by using proximity labeling mediated by engineered ascorbic acid peroxidase (APEX). APEX has been used to capture entire organelle proteomes with high temporal resolution, but its breadth of labeling is generally thought to preclude the higher spatial resolution necessary to interrogate specific protein networks. We provide a solution to this problem by combining quantitative proteomics with a system of spatial references. As proof of principle, we apply this approach to interrogate proteins engaged by G-protein-coupled receptors as they dynamically signal and traffic in response to ligand-induced activation. The method resolves known binding partners, as well as previously unidentified network components. Validating its utility as a discovery pipeline, we establish that two of these proteins promote ubiquitin-linked receptor downregulation after prolonged activation.
In Brief
Proximity labeling coupled with quantitative proteomics captures location and timing of GPCR function in live cells.
INTRODUCTION
Biology relies on precise spatial organization and dynamic temporal remodeling of local protein interaction networks within the cell (Scott and Pawson, 2009). Accordingly, understanding any biological process necessitates defining three parameters: the composition of the underlying protein network, its organization in space, and its evolution over time (Figure 1A). These key parameters—the essential “what,” “where,” and “when” underlying cell biology at the molecular level—can be captured experimentally as independent variables. Mass spectrometry (MS) has been combined with affinity purification (AP-MS) to interrogate protein-protein interactions (Gavin et al., 2006; Ideker and Krogan, 2012; Jäger et al., 2011; Krogan et al., 2006) and their temporal dynamics (Bisson et al., 2011; Collins et al., 2013). Furthermore, AP-MS has been used in combination with subcellular fractionation to add spatial information and identify subcellular protein complexes (Foltz et al., 2006; Lavallée-Adam et al., 2013). However, a major challenge remains largely unmet: how to interrogate interaction networks engaged by a target protein while simultaneously capturing both the spatial and temporal context in which these interactions occur.
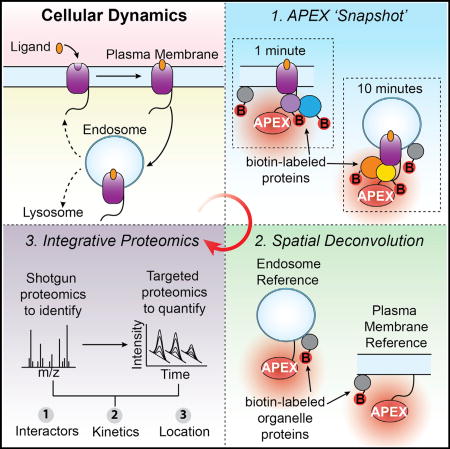
Figure 1. Time-Resolved Proximity Labeling with Spatially Specific Deconvolution to Identify Local Protein Interaction Networks and Subcellular Location.

(A) Spatiotemporal dynamics of a theoretical protein interaction network responding to a stimulus/perturbation.
(B) Workflow for identifying local protein network composition and subcellular location: (1) 30-s APEX labeling for time-resolved “snapshots” of the local proteome; (2) APEX-tagged spatial references to deconvolve compartment bystanders from pathway-specific protein interaction networks; and (3) a two-step mass spectrometric workflow to compare relative abundances of proteins biotinylated by the target and spatial references.
Proximity labeling provides a means to capture the immediate biochemical environment of a protein as it exists in situ, thus preserving the critical spatial and temporal context (Kim and Roux, 2016). Various methods have been developed but, among them, engineered ascorbic acid peroxidase (APEX) is of particular interest because of its rapid labeling kinetics (Lam et al., 2015; Martell et al., 2012; Rhee et al., 2013). While APEX has been used previously to identify steady state organelle proteomes, we reasoned that its speed—on par with many biological processes—could be harnessed to interrogate dynamically evolving protein interaction networks. A significant challenge is that the high labeling activity of APEX, precisely what makes it useful for capturing organelle proteomes, might preclude the higher spatial resolution necessary for use with individual proteins (Hung et al., 2014, 2016; Mick et al., 2015; Rhee et al., 2013). Specifically, APEX would be expected to label proteins in the local interaction network of a target protein, as well as nearby off-pathway proteins diffusing through the reactive biotin cloud, and thereby produce high background. After cell lysis, such proteins become convolved, making it challenging to identify which of the labeled proteins are truly part of the interaction network engaged by the target. Thus, while the breadth and speed of APEX proximity labeling holds the potential to capture location, timing, and interactions for a target protein, it is not known if it is possible to deconvolve such a complex proximity profile into its constituent parts.
We addressed this question by focusing on signaling receptors as canonical examples of proteins whose cellular function is dependent on the ability to rapidly change location and protein interactions (Irannejad et al., 2015; Kholodenko, 2006; Sorkin and von Zastrow, 2009). G-protein-coupled receptors (GPCRs), the largest family of signaling receptors, mediate the physiological responses to a wide variety of stimuli including hormones, neurotransmitters, and light (Rosenbaum et al., 2009). In response to agonist binding, GPCRs undergo a cascade of temporally defined and functionally interdependent signaling and regulatory events for which the receptors engage different protein interaction networks (Ritter and Hall, 2009). We selected the well-studied beta-2 adrenergic receptor (B2AR) to develop an APEX-based strategy with sufficient spatial and temporal resolution to distinguish specific local protein interaction networks from the overall organelle proteome. We describe an experimental pipeline that uses quantitative proteomics and a system of spatial references to extract higher-order spatial information from APEX labeling profiles through quantitative deconvolution (Figure 1B). With this approach, we show that it is possible to identify local network composition and subcellular location for a target protein of interest, and do so with sub-minute temporal resolution. We then show this strategy can be successfully employed to identify previously undiscovered players in protein interaction networks.
RESULTS
APEX Captures GPCR Protein Networks
We first set out to test if GPCRs could tolerate an APEX tag, and if these tagged receptors could capture known transducer and regulatory proteins. We inserted the engineered ascorbate peroxidase enzyme APEX2 as a genetic fusion to the cytoplasmic tail of B2AR and DOR. While DOR tolerated APEX2 as a carboxyterminal tag, we found the optimal tag location for B2AR to be an insertion of the APEX2 enzyme, separated by flexible linkers, within the tail of the receptor (Figure S1A). B2AR-APEX2 or DOR-APEX2 were stably expressed in HEK293 cells, and both were active for signaling and trafficking (Figures S1B–S1E). Cells were pre-incubated with biotin-phenol for 30 min, and receptors were activated during this period at different time points with specific agonists (Figure S1F). These pre-incubation conditions did not disrupt GPCR function (Figure S1G). As the final step, APEX labeling was activated by adding hydrogen peroxide (H2O2) for a 30-s biotinylation “snapshot” and was rapidly quenched using a combination of low temperature buffer, peroxidase inhibitors and a competitive substrate. Subsequently, biotinylated proteins were purified on streptavidin agarose. To identify and quantify relative abundance changes in biotin-labeled proteins following agonist stimulation, we developed a multi-step workflow utilizing either western blot or quantitative mass spectrometry (MS) (Figure 2A). For MS, biotin-labeled proteins were identified by shotgun proteomics and quantified by targeted proteomics using selected reaction monitoring (SRM).
Figure 2. APEX Captures GPCR Protein Interaction Networks.

(A) APEX workflow for western blot or mass spectrometric analysis of known GPCR protein interaction network components.
(B) Western blot analysis of arrestin3-GFP biotinylation captured by streptavidin agarose showing negative controls, unstimulated cells, or cells stimulated with agonist for 3 min before 30-s APEX labeling.
(C) Targeted proteomics comparison of endogenous arrestin3 biotinylation captured by streptavidin agarose between unstimulated cells or agonist-stimulated cells. Data from four independent experiments are presented as mean + SEM.
(D) Graphical representation of location- and time-specific functions of arrestin3 (blue), clathrin (red), and Retromer (orange) with B2AR (“B”; green).
(E) Western blot analysis of agonist-dependent biotinylation by B2AR-APEX2 of arrestin3-GFP, clathrin heavy chain (CLTC), and Retromer complex (subunit VPS35). Pull-down on streptavidin agarose.
(F) Targeted proteomics analysis of agonist-dependent biotinylation by B2AR-APEX2 of endogenous arrestin3 (blue), CLTC (red), and VPS35 (yellow). Data from four independent experiments are presented as mean + SEM.
(G) Targeted proteomics analysis of agonist-dependent biotinylation of GNAS (green; by B2AR-APEX2) or GNAI2 (purple; by DOR-APEX2). Data from four independent experiments are presented as mean + SEM.
To investigate if APEX fused to GPCRs is sufficiently sensitive to capture receptor protein network components, we first focused on arrestin3 (β-arrestin-2). Arrestin3 is critical to both B2AR and DOR function and associates transiently following agonist stimulation (Gurevich and Gurevich, 2015). Due to the nature of this interaction, co-immunoprecipitation of arrestin3 with GPCRs often requires additional crosslinking (Cheng et al., 2000; Luttrell et al., 1999; Perry et al., 2002). We found that APEX allows capture of agonist-responsive recruitment of arrestin3-GFP to both DOR and B2AR, and this was dependent on both H2O2 and biotin-phenol (Figure 2B). APEX combined with the targeted proteomics strategy allowed detection of endogenous arrestin3, and we detected more than a 6-fold increase in arrestin3 capture following receptor activation (Figure 2C). These data suggest that APEX can capture the transient, agonist-dependent interaction of arrestin3 with GPCRs.
GPCR function involves complex and time-dependent remodeling of local protein networks. B2AR endocytosis from the plasma membrane (3–10 min) involves arrestin3 and clathrin. Subsequent functions at endosomes (10–30 min) involve clathrin and VPS35 (Figure 2D) (Temkin et al., 2011). Monitoring B2AR-APEX labeling at different time points after agonist treatment showed that distinct temporal phases at which these proteins function with the receptor could be resolved, as indicated both by western blot detection and targeted proteomics (Figures 2E, 2F, and S1H). These experiments demonstrate that APEX has sufficient temporal resolution to parse ordered molecular events in B2AR regulation and trafficking.
We then asked if the APEX strategy can provide information regarding even faster events by examining proximity labeling of G proteins. GPCRs engage and allosterically activate cognate heterotrimeric G proteins within a second after agonist binding, and this is followed by alpha subunit dissociation that occurs over a period of seconds (Lohse et al., 2008). To ask if these events can be detected using our approach, we focused on GNAS as an alpha subunit activated by B2AR and GNAI2 as an alpha subunit activated by DOR. For both G proteins, agonist-induced receptor activation produced a marked decrease in APEX labeling detected at the 1-min time point. At later time points, GNAS labeling increased, while GNAI2 labeling continued to decrease but at a slower rate than observed in the first minute (Figure 2G). These later changes in APEX labeling likely reflect subsequent processes such as receptor desensitization and internalization. These observations suggest that our methodology has sufficient temporal resolution to detect subunit dissociation, but not initial G protein engagement by agonist-activated receptors, and can resolve differences in dissociation kinetics between distinct alpha subunits.
Together, these data offer empirical evidence that APEX combined with MS-based label-free quantification is compatible with GPCR biology and can capture many endogenous GPCR interacting proteins including those of low-affinity, transient, or non-direct interactions (Table S1).
APEX Captures Information about Relative Spatial Location
APEX proximity labeling is known to be sufficiently powerful to capture whole organelle proteomes; therefore, we expected the GPCR-APEX fusion strategy to label other proteins in proximity of the receptor in addition to interacting proteins. We refer to such proteins as “bystanders”: compartment-specific proteins residing in the local environment of the protein of interest but not physically interacting nor directly participating in its function. However, we wondered if these bystander proteins could provide useful information regarding location of the receptor. To this end, we picked four proteins as spatial markers along the agonist-stimulated trafficking route of B2ARs: radixin (RDX) and occludin (OCLN) as plasma membrane markers and the early endosomal antigen 1 (EEA1) and the t-SNAREs homolog 1B (VTI1B) to mark endosomes (Figure 3A). Agonist-stimulated B2AR-APEX2 labeled these proteins with a time course that closely matched receptor trafficking between plasma membrane and endosomes as measured by flow cytometry (Figures 3B and 3C). We also validated that this approach could be applied for DOR (Figure S2A). These results verify that bystander proteins are indeed labeled by the present strategy. Importantly, they also suggest that bystanders do not simply represent noise; rather, they preserve biological information—within the same sample—about location.
Figure 3. Spatially Specific References Allow GPCR Interactors to be Differentiated from General Compartmental Proteins.

(A) Compartmental bystanders along the agonist-stimulated B2AR (“B”) trafficking route: RDX and OCLN at the plasma membrane and EEA1 and VTI1B at endosomes.
(B) Targeted proteomics analysis of compartmental protein bystanders biotinylated in B2AR-APEX2 cells in unstimulated cells or cells stimulated with isoproterenol for the noted times prior to biotinylation. Data from four independent experiments are presented as mean + SEM.
(C) Flow cytometric measurements of agonist induced B2AR-APEX2 trafficking. Data from three independent experiments are presented as mean + SEM.
(D) APEX-tagged constructs targeting APEX2 to the plasma membrane, early endosome, or cytoplasm.
(E) Micrographs of PM-APEX2, Endo-APEX2, and Cyto-APEX2 using live-cell confocal imaging (scale bar, 10 µm).
(F and G) Relative protein abundance of biotinylated receptor-specific protein complexes (blue bars) or plasma membrane bystanders (light gray bars) comparing B2AR-APEX2 after (F) 1 min agonist stimulation or (G) 10 min agonist stimulation to PM-APEX2, Cyto-APEX2, or ENDO-APEX2 measured by targeted proteomics analysis. Statistical significance was calculated using one-way ANOVA (alpha = 0.05) with multiple comparisons correction. Differences in protein abundance between receptor-specific protein complexes and bystanders noted as (F) OCLN (#) and RDX (*) or (G) VTI1B (#), and EEA1 (*). Data from four independent experiments are presented as mean + SEM.
See also Figures S2 and S3 and Tables S2 and S5.
Spatially Specific References Allow GPCR Interactors to be Differentiated from General Compartmental Proteins
These findings indicate that the profile of proteins captured by the GPCR-APEX method represents a complex mixture of two time-dependent profiles: interaction network components and bystanders. To deconvolve these profiles, spatially specific APEX references were generated using established targeting strategies: Lyn11 (plasma membrane targeting), 2xFYVE (early endosome targeting), and GFP (cytoplasmic) (Gillooly et al., 2000; Inoue et al., 2005). These constructs are referred to here as PM-APEX2 (Lyn11-GFP-APEX2), Endo-APEX2 (GFP-2xFYVE-APEX2), and Cyto-APEX2 (GFP-APEX2) (Figures 3D and 3E). To avoid the targeting motifs disrupting compartmental function, HEK293 cells stably expressing low levels of these constructs were selected, expression-matched, and tested for unperturbed receptor trafficking (Figures S2B and S2C). We validated proximity labeling of PM-APEX2 and Endo-APEX2 with shotgun proteomics and demonstrated strong enrichment of known plasma membrane and endosomal proteins, respectively (Figures S2D and S2E; Table S2). These experiments also identified cytoplasmic background proteins that are equally biotin-labeled by the different APEX-constructs. We used these proteins as internal standards for targeted proteomics to normalize between different APEX-constructs as well as between biological replicates (Figures S3A and S3B).
We reasoned that APEX profiles generated from the same subcellular compartment would be quantitatively similar overall (i.e., bystander proteins), but differ for those proteins which are enriched around the GPCR through interaction networks. Consequently, we compared relative abundances of known B2AR network proteins and bystanders across different APEX samples by targeted proteomics. APEX proximity labeling was performed for B2AR-APEX2 as well as PM-APEX2, Endo-APEX2, and Cyto-APEX2. When comparing the abundance of proteins labeled by B2AR-APEX2 (one minute agonist) to its spatially specific reference PM-APEX2, we found the bystander proteins OCLN and RDX to be of similar abundance between the two constructs. We then examined the endocytic network engaged by B2AR immediately after activation, consisting of arrestin3 (ARRB2) and the AP2 complex (Figure S3C). Importantly, these proteins were significantly more enriched in the B2AR-APEX2 sample than PM-APEX2 (Figure 3F and Table S2; AP2S1 not detected by MS). Consistent with previous findings, the abundance differences of arrestin3 and AP2 were agonist dependent (Figure S3D; Table S2). Thus, we could quantitatively distinguish these bystanders from the B2AR endocytic network. We found that the selection of the correct spatial reference was critical. When using the wrong spatial reference for B2AR one minute after agonist (either Cyto-APEX or Endo-APEX2), known receptor network components could not be differentiated from bystanders (Figure 3F; Table S2). Together, these data demonstrate that it is possible to deconvolve bystanders from network components through quantitative proteomic comparison of spatial references at the same subcellular compartment as the APEX-tagged target.
To determine if the spatially specific reference approach could be extended to a different subcellular compartment, we examined B2AR-APEX2 at later phases following agonist stimulation. Activation of B2AR with agonist for 10 min results in its trafficking to early endosomes where it engages an endosomal sorting protein network that includes sorting nexin 27 (SNX27) and the Retromer complex (VPS26, VPS29, and VSP35) (Figure S3E). We utilized EEA1 and VTI1B as early endosomal bystander proteins. While this time point is technically more challenging because of receptor trafficking asynchrony over time, the spatially specific reference (Endo-APEX2) allowed the B2AR-specific endosomal network to be differentiated by abundance from bystander proteins (Figure 3G; Table S2).We again observed the importance of selecting a spatially accurate reference condition, as comparing B2AR-APEX2 (10 min after agonist; primarily endosomal) to Cyto-APEX2 or PM-APEX2 resulted in no difference in relative abundance between the GPCR network proteins and bystanders (Figure 3G; Table S2).
Together, these results suggest that spatially specific reference conditions, combined with label-free MS-based quantification, provide a method by which complex datasets generated by APEX proximity labeling can be deconvolved into their constituent parts.
Time-Resolved Proximity Labeling with Spatially Specific Deconvolution Identifies Interacting Partners for the Delta Opioid Receptor
We next tested the utility of our spatial reference approach for identifying unknown GPCR interacting proteins. We focused on DOR because of an open and unresolved question regarding the molecular and cellular basis of its downregulation. DOR down-regulation by endocytic trafficking to lysosomes is physiologically important and contributes to the development of tolerance to opioid analgesic drugs in vivo (Gendron et al., 2016). Mechanistically, lysosomal downregulation typically requires transmembrane proteins to engage the ubiquitin network in endosomes (Schmidt and Teis, 2012). However, receptors can differ in the components that they engage (Kennedy and Marchese, 2015). The key question of whether specific ubiquitin network components are required to select DOR for delivery to lysosomes remains unanswered (Henry et al., 2011; Hislop et al., 2009).
We developed a multi-step workflow to identify, score, and validate proteins specifically enriched in the local environment of DOR (Figure 4A). To interrogate this environment at different phases after agonist-induced activation, DOR-APEX2 expressing cells were exposed to the opioid agonist DADLE for varying periods of time prior to APEX labeling (Figure 4A). Proximity labeling was also performed for PM-APEX2 and Endo-APEX2 to obtain spatially specific references. Biotinylated proteins were quantified using label-free shotgun MS, an approach that we demonstrated to identify many known interactors for B2AR (Table S1).
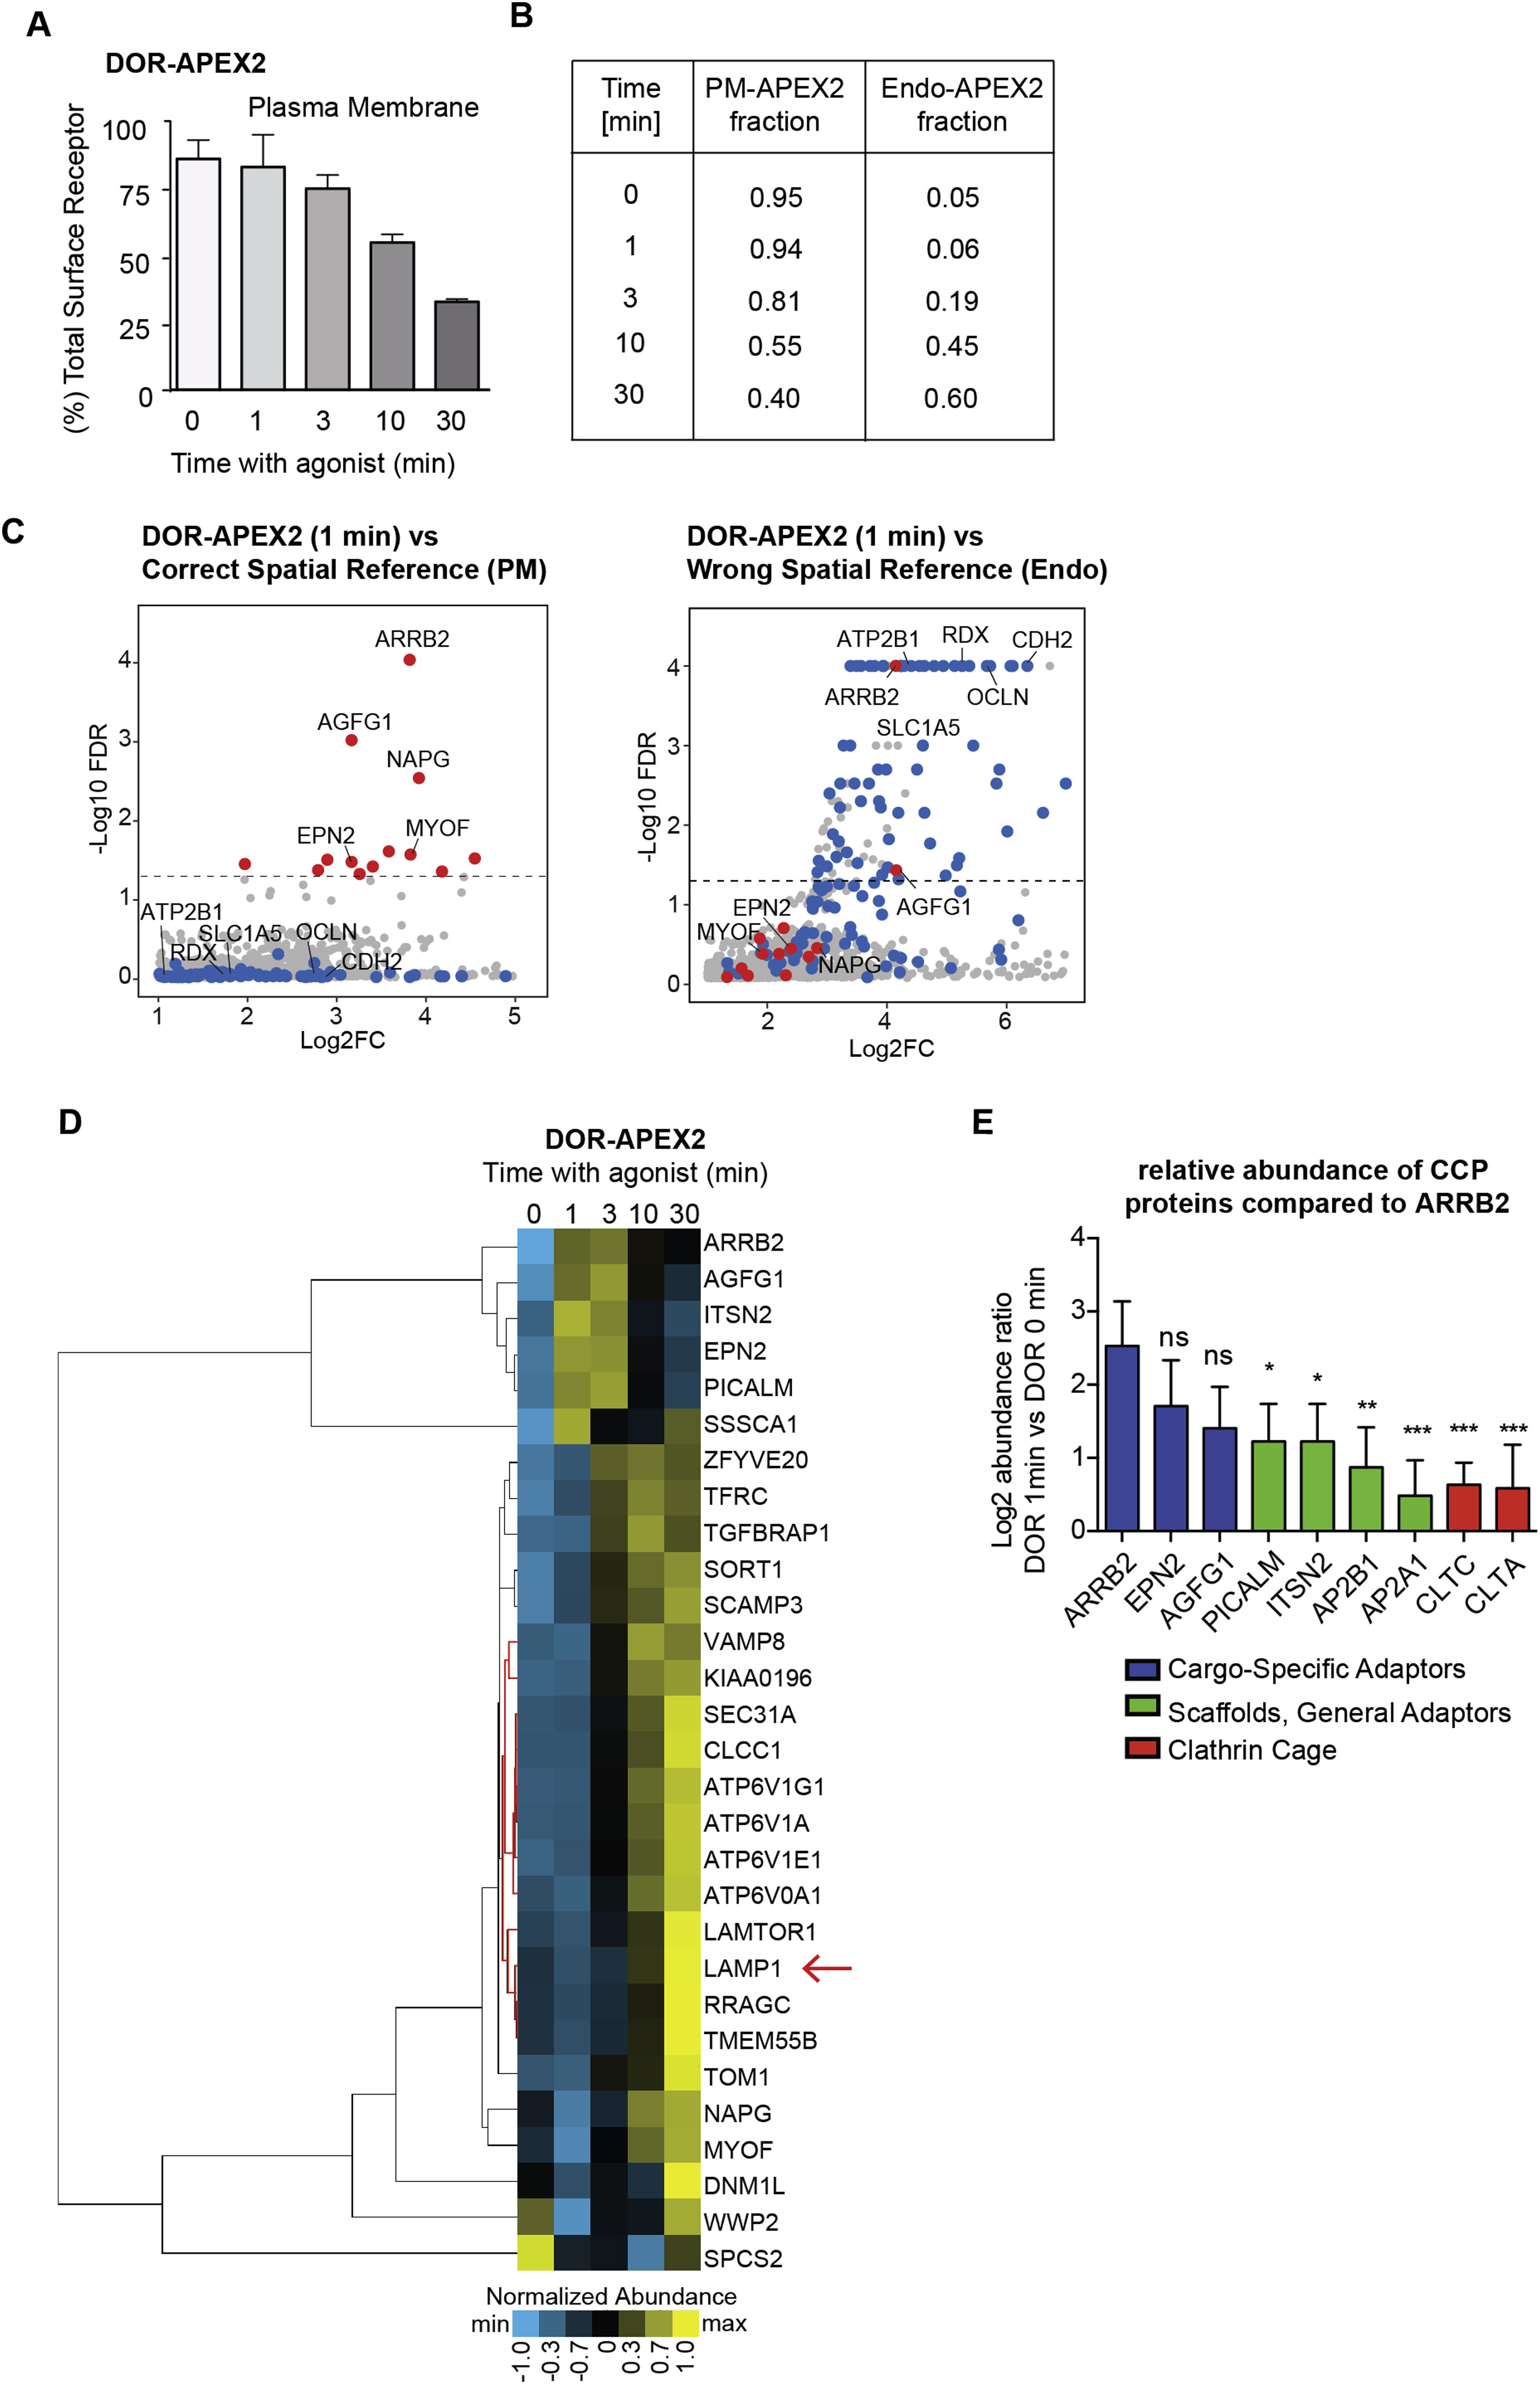
Figure 4. Time-Resolved Proximity Labeling with Spatially Specific Deconvolution Identifies Interacting Partners for the Delta Opioid Receptor.

(A) Spatially specific APEX proximity-profiling using shotgun proteomics and SAINT scoring to identify candidate DOR interaction network components and subsequent targeted proteomics for abundance quantification and hierarchical clustering of their temporal profiles.
(B) SAINT confidence scoring of the shotgun proteomics data for DOR-APEX2 compared to time-specific combined spatial references, false discovery rate (FDR), and fold change (FC) plotted. All proteins with an FDR of zero were given a value of 0.001 for plotting. Proteins passing the selected SAINT FDR cutoff (< 0.05) are colored in red as candidates. Proteins previously observed to be enriched in the plasma membrane proteome or endosome proteomes (Figure S3B) are colored in blue or green, respectively. All other proteins are shown in gray. Data from three independent experiments are presented as mean.
(C) Relative abundance quantification of SAINT hits using targeted proteomics. Abundance ratio was calculated comparing DOR and the time-specific combined spatial reference for each time point after agonist. Proteins significantly more abundant in the DOR sample (p < 0.05) than the spatial reference are colored in red, and all others are in gray. Data from four independent experiments are presented as mean + SEM.
(D) Hierarchical clustering for DOR interaction network proteins using the normalized abundance from targeted proteomics analysis. The non-reference controlled LAMP1 cluster was removed (see Figure S4D for full cluster).
The basis of our deconvolution strategy is to identify proteins labeled more strongly by GPCR-APEX2 than spatial references. To do so, we applied the probabilistic scoring algorithm SAINT for MS1 intensities and compared proteins labeled by DOR-APEX2 at each time point after receptor activation to the matching spatial reference (Choi et al., 2011, 2012). As the distribution of agonist-stimulated DOR between the plasma membrane and endosome changes over time, we created a specific spatial reference condition for each time point by fractionally combining the protein MS1 intensities derived from PM-APEX2 and Endo-APEX2 to reflect the overall receptor distribution (Figures 3C, S4A, and S4B). Using known GPCR interacting proteins as a reference, we selected an FDR cutoff for SAINT of 0.05 and obtained a list of 48 unique proteins (Figure 4B; Table S3). It should be again noted that using the correct spatial reference was essential, as applying the incorrect reference resulted in a candidate list highly enriched in bystander proteins (Figure S4C). To validate the results derived from the SAINT scoring system and obtain more sensitive and accurate quantification of relative biotin labeling over time, proteins passing the SAINT FDR cutoff were re-measured using targeted proteomics (Figure 4C; Table S3). 29 out of 42 proteins for which we could successfully develop targeted proteomics assays showed significant abundance differences (p < 0.05) between the receptor and time-specific reference and were selected as candidates for functional characterization (Tables S3 and S4).
To guide selection of these candidate proteins for follow-up studies, we employed hierarchical clustering to group proteins across temporal phases using the targeted proteomics measurements (Figures 4D and S4D). We found proteins clustering in distinct phases after agonist including early (1–3 min), middle (3–10 min) and late (10–30 min) phases. As expected, arrestin3 (ARRB2) peaked in the early phase. A similar temporal profile was shared by several other proteins that are known to function in clathrin-mediated endocytosis (AGFG1, ITSN2, EPN2, and PICALM) (McMahon and Boucrot, 2011). Several of the candidates in the middle phase (ZFYVE20, TGFBRAP1, and SCAMP3) and later phase (MYOF and WWP2) are known to function in endosomal sorting of other receptors (Bernatchez et al., 2007; Aoh et al., 2009; Dores et al., 2015; Falguières et al., 2012; Navaroli et al., 2012; Oo et al., 2011; Perini et al., 2014). Additionally, we found a cluster of proteins peaking at the late phase of receptor activity including LAMP1 and components of the acidifying endosomal ATPase (Figure S4D). As we did not have a reference controlling for the late-endosomal/lysosomal LAMP1-positive compartment, we considered these proteins as likely bystanders. Consequently, we did not include these proteins for hierarchical clustering analysis of APEX hits to consider for immediate follow-up (Figure 4D; see Figure S4D for full clustering).
Identification of WWP2 or TOM1 as Ubiquitin Network Components Required for DOR Trafficking to Lysosomes
We were intrigued to see WWP2 and TOM1, two ubiquitin-linked proteins, labeled by DOR during the late phase of activity (30 min after agonist) (Figure 4D). WWP2 is a HECT family E3 ligase and has been linked to the degradation of two GPCRs: PAR1 and S1P1 (Dores et al., 2015; Oo et al., 2011). TOM1 has two ubiquitin interaction domains (VHS and GAT) that bind ubiquitin in vitro and it has been shown to localize to endosomes (Seet et al., 2004; Wang et al., 2010; Yamakami et al., 2003). However, it remains unknown if TOM1 directly functions in endosomal sorting of membrane proteins. Importantly, neither protein is currently recognized to have any role in the biology of opioid receptors.
The proximity-labeling profile of TOM1 and WWP2 suggested that these proteins engage DOR at or shortly after receptor endocytosis and showed strongest labeling at late phases of receptor activity. Therefore, we hypothesized that the knockdown of TOM1 or WWP2 could result in endosomal mis-sorting and reduction in lysosomal degradation. To test this hypothesis, we used small interfering RNAs (siRNAs) for protein-specific knockdown of TOM1 and WWP2 (Figure S5A). Following siRNA-mediated knockdown of WWP2 or TOM1, cells stably expressing Flag-DOR were stimulated with agonist for time periods of 0 to 6 hr. DOR degradation was assessed and quantified by western blot. We found that knockdown of either TOM1 or WWP2 significantly impaired the degradation rate of the receptor (Figures 5A–5D).
Figure 5. Identification of WWP2 or TOM1 as Ubiquitin Network Components Required for DOR Trafficking to Lysosomes.

(A and B) Western blots for DOR (FLAG), WWP2, TOM1, or loading control (CLTC) from HEK293 cells stably expressing FLAG-DOR (no APEX2 tag) and treated with scramble or siRNAs to WWP2 (A) or TOM1 (B) for 72 hr. Cells were either untreated (0 hr) or agonist stimulated (6 hr).
(C and D) Quantification of FLAG-DOR in HEK293 cells treated with scramble or siRNAs to WWP2 (C) or TOM1 (D) for 72 hr. Cells were either untreated or agonist stimulated for the noted time. Data from three independent experiments are presented as mean + SEM.
(E) Flow cytometric measurements of agonist induced DOR internalization in either cells treated with scramble or siRNAs to WWP2 or TOM1 for 72 hr. Data from three independent experiments are presented as mean + SEM.
(F) Model of TOM1 and WWP2 function in endosomal sorting of DOR.
See also Figure S5.
We then tested if this defect in lysosomal degradation was due to a loss of receptor internalization. We found no significant effect from knockdown of either protein on DOR endocytosis relative to a positive control (siRNA to arrestin3) (Figure 5E), suggesting that the effect of TOM1 or WWP2 knockdown was further downstream. Additionally, the decrease in degradation was not a result of re-routing DOR into the recycling pathway (Figure S5B). Together these data identify two specific network components mediating DOR degradation, and identify TOM1 as a cargo sorting protein (Figure 5F).
DISCUSSION
Here, we present an approach based on APEX proximity labeling, spatial references, and quantitative MS that allows protein interaction networks to be resolved according to both location and timing. We established the utility of this method by applying it to GPCRs, which are traditionally difficult targets due to their movement within cells and ligand-induced remodeling of the protein interaction networks that they engage. We validated capture of known receptor binding partners, including those with transient or low-affinity interactions, and demonstrated that our pipeline can be used to discover components of protein interaction networks.
APEX Labeling of Known Protein Interaction Networks
A critical first step was to determine if APEX, which has been shown to label entire organelles, could be used to identify specific and relevant protein-protein interactions. The beta-2 adrenergic receptor is an extensively studied GPCR with many interacting proteins already known. As such, this GPCR offered an excellent test for the temporal and spatial resolution of APEX. We show that APEX proximity labeling can capture proteins that interact with the GPCR directly, including those with transient or with low-affinity interactions, such as the alpha subunit of heterotrimeric G proteins, arrestin3, and SNX27 (Lauffer et al., 2010). Additionally, APEX can capture proteins that are linked to the receptor indirectly, such as the AP2 complex or Retromer complex. Our data suggest that the spatiotemporal resolution of APEX is sufficiently high that agonist-dependent coupling of the receptor to already known transducers and regulators can be directly assessed from the streptavidin-purified fraction.
Deconvolution of APEX Labeling
Our data demonstrate that APEX labeling captures three classes of proteins in compartments that face the cytoplasm: proteins which interact with the target, nearby bystanders on the organelle, and freely diffusing cytoplasmic proteins. These spatially distinct types of proteins become convolved as a product of cell lysis. We found that the breadth of APEX labeling (∼90% of proteins were labeled by all constructs) was advantageous because it allows for deconvolution of these signals based on quantitative differences in labeling intensity. We demonstrated that comparing APEX labeling profiles generated at the same compartment allows components of local protein interaction networks to be deconvolved from labeled bystanders and cytoplasmic proteins. It is worth considering how this could work. Unlike immunoprecipitation which enriches proteins based on biochemical affinity, proximity-labeling captures proteins in a manner that depends on distance and duration. APEX undoubtedly has sufficient labeling activity to generate high background, but the cloud of activated biotin-phenol is finite (estimated as less than 20 nm in living cells) (Hung et al., 2014; Rhee et al., 2013). Thus, the probability of a protein being biotin-labeled by APEX depends on its distance from the APEX tag and dwell-time within the cloud of activated biotin-phenol. Proteins which interact with the APEX-tagged target will be closer to, and reside longer within, the cloud of activated label than non-interacting proteins. Our data suggest that these differences in relative location from the target protein, which are integrated across the 30-s labeling reaction, can be quantitatively and systematically resolved.
Using Time-Resolved Proximity Labeling with Spatially Specific Deconvolution to Identify Components of the DOR Network
SAINT identification of arrestin3 as the highest confidence interacting protein in the early phases after agonist addition is consistent with its known rapid recruitment and binding to the activated GPCR (Sorkin and von Zastrow, 2009). In addition to arrestin3, we observed several other proteins (EPN2, ITSN2, and PICALM), known components of the clathrin-coated pit (CCP) (McMahon and Boucrot, 2011), as proteins that either interact directly with the receptor or are locally associated in the early phase after agonist addition. Surprisingly, even though the CCP is a relatively small structure, individual components were labeled to different degrees (Figure S4E). This suggests that quantitative deconvolution of proximity labeling data has the potential to achieve even higher spatial resolution.
We demonstrate the utility of our approach to identify components of the GPCR network by addressing a problem in the biology of opioid receptors that has proven intractable by traditional approaches (Henry et al., 2011; Hislop et al., 2009). Specific ubiquitin ligases, and downstream ubiquitin binding proteins, promote receptor sorting to lysosomes and have been identified for many signaling receptors (Schmidt and Teis, 2012). For opioid receptors, however, traditional methods have failed to identify such proteins. Our method identified WWP2, a HECT family ubiquitin ligase and TOM1, a ubiquitin binding protein. We demonstrated that both proteins are involved in endosomal sorting of DOR to the lysosome, providing insight into the molecular mechanism of opioid receptor downregulation. While we show that our pipeline identifies important network components, not every protein identified by our pipeline should be assumed, a priori, to be functionally relevant. For example, DOR-APEX labeling identified TNFR at the early and middle phases, an observation that is consistent with DOR and TNFR being in close proximity both during endocytosis and during transit through shared early endosomal intermediates (Eichel et al., 2016; Tsao and von Zastrow, 2000). Yet, we do not presently conclude that TNFR and DOR specifically bind or that the former directly alters the cell biology of the later. Thus, as with traditional yeast two-hybrid or AP-MS approaches, additional mechanistic studies remain critical to validate whether identified proteins are true network components and, ultimately, functionally relevant.
While 30-s “snapshots” are clearly sufficient to capture and temporally resolve many known GPCR-interacting proteins, we note that heterotrimeric G proteins were not identified as high-scoring proteins despite being labeled by APEX. We think that this is because initial G protein association with GPCRs occurs with sub-second kinetics, which is faster than we can currently resolve (Lohse et al., 2008). We did observe decreased G protein labeling consistent with subsequent dissociation (Figure 2G), but the present SAINT-based scoring strategy only detects proteins whose labeling increases relative to spatial references. We suggest that future development of additional data analysis strategies, optimized for the structure and nature of proximity labeling datasets, could significantly increase the power of the present strategy.
Toward Application as a General Analytical Pipeline
We suggest that the present strategy combining time-resolved APEX labeling with quantitative proteomics and spatial references defines a generalizable discovery pipeline for unbiased protein network interrogation. However, our experience in applying the methodology to GPCRs has identified several requirements and considerations that may restrict the range of systems to which it can be applied. First, our strategy presently requires one to know the subcellular location of the protein of interest and its time-dependent redistribution. This is critical for selecting appropriate spatial references and for determining their relative contribution to the quantitative proteomic analysis at each time point. Information about subcellular location is already available for many proteins, including other signaling receptors, and there has been considerable recent progress in development of methods to define the subcellular location of target proteins more broadly (Itzhak et al., 2016; Lundberg and Uhlén, 2010; Marx, 2015; Rhee et al., 2013). In addition, we note that the present APEX methodology inherently returns information regarding subcellular location (Figures 3B and S2A). Accordingly, we suggest that the present pipeline could be expanded to provide unbiased subcellular location information de novo. We provide proof of principle supporting feasibility of such an approach (Figures S5C and S5D). A second requirement of the present strategy—as for all strategies requiring protein affinity tagging—is to position the tag to ensure minimal functional perturbation. We found that APEX2 is active as an amino terminus, carboxy terminus, or internal tag, thus allowing flexibility in designing a tagging scheme. Additionally, as APEX2 and GFP are of similar size, we suggest that a reasonable starting point for APEX tagging is to identify locations in which GFP has been successfully inserted into the protein of interest.
Constrained by the considerations elaborated above, we anticipate that the present methodology can be extended to virtually any membrane-associated protein. It remains to be determined whether the pipeline can be further extended to cytoplasmic proteins, which lack a specific organelle location. With accumulating evidence that the cytoplasm is spatially heterogeneous (Brangwynne, 2013; Eulalio et al., 2007), we suggest that a similar experimental approach—except using multiple cytoplasmic rather than organellar spatial references—could make this feasible. Whether this is indeed the case remains an interesting question for future study. In sum, here we describe and validate a methodology that extends the utility of APEX-mediated proximity labeling to achieve spatiotemporally resolved protein network interrogation in intact cells, thereby providing a flexible pipeline for defining the essential “what,” “where,” and “when” of protein interaction networks that fundamentally underlie biology at the molecular level.
STAR⋆METHODS
Detailed methods are provided in the online version of this paper and include the following:
-
●
KEY RESOURCES TABLE
-
●
CONTACT FOR REAGENT AND RESOURCE SHARING
-
●
EXPERIMENTAL MODEL AND SUBJECT DETAILS
-
○
Mammalian Cell Culture Conditions
-
○
-
●
METHODS DETAILS
-
○
cDNA constructs
-
○
Flow cytometric analysis of receptor trafficking
-
○
Flow cytometric analysis of receptor redistribution
-
○
DOR lysosomal degradation assay
-
○
Live cell cAMP accumulation assay
-
○
Live-cell imaging
-
○
APEX reaction and biotinylated protein capture
-
○
Western blots
-
○
Preparation of APEX-labeled proteins for western blot or mass spectrometry
-
○
Shotgun mass spectrometric data acquisition
-
○
Targeted mass spectrometric data acquisition
-
○
Hierarchical clustering
-
○
De novo identification of protein location
-
○
-
●
QUANTIFICATION AND STATISTICAL ANALYSIS
-
○
Statistics
-
○
Protein identification and quantification from shotgun proteomics
-
○
Statistical analysis of shotgun MS data
-
○
Scoring of specific DOR interactors
-
○
Protein quantification from targeted proteomics data
-
○
-
●
DATA AND SOFTWARE AVAILABILITY
-
○
Shotgun proteomics data access
-
○
Targeted proteomics data access
-
○
STAR⋆METHODS
CONTACT FOR REAGENT AND RESOURCE SHARING
Requests for resources, reagents, or questions about methods should be directed to Lead Contact Mark von Zastrow (mark.vonzastrow@ucsf.edu).
EXPERIMENTAL MODEL AND SUBJECT DETAILS
Mammalian Cell Culture Conditions
HEK293 cells (CRL-1583, ATCC) were cultured in Dulbecco’s modified Eagle’s medium (DMEM, GIBCO) and supplemented with 10% fetal bovine serum (UCSF Cell Culture Facility). HEK293 cells stably expressing APEX-tagged constructs were selected with 500 µg/mL G418 and maintained in 100 µg/mL G418. Transfections were performed using Lipofectamine 2000 or Lipofectamine 3000 for cDNA (2 uL of Lipofectaime per 1 µg of DNA) and RNAi-Max for siRNA (3 uL of RNAi-Max per 10 pmol of RNA). For transient DNA expression, cells were transfected 24 or 48 hr before experiments. siRNA duplexes were ordered from QIAGEN, and cells were transfected with siRNAs for 72 hr before experiments.
METHODS DETAILS
cDNA constructs
PM-APEX2, Endo-APEX2, and CYTO-APEX2 were cloned into pcDNA3APEX2-NES (Addgene #49386) by In-Fusion HD cloning into the NotI site. Lyn11-eGFP (PM), GFP-2xFYVE (Endo), and eGFP (CYTO) were amplified, respectively, from a gBlock (IDT), pEGFP-C1, or a previously described construct (Gillooly et al., 2000). Linkers were inserted by extension PCR. APEX-tagged GPCRs were cloned into pcDNA3.1 using PCR amplification and restriction enzyme cloning. Amino-terminally FLAG-tagged human B2AR and murine DOR were amplified by PCR from previously described constructs (Hislop et al., 2009; Temkin et al., 2011). Full length FLAG-DOR and the amino-terminal portion of FLAG-B2AR (1–382) were cloned using NheI and EcoRI (NEB), followed by a linker sequence, and APEX2 inserted with EcoRI and NotI (NEB). For FLAG-B2AR, the remaining portion of the receptor (383–413) was cloned 3′ to the APEX2 sequence, separated by a linker, with NotI and XbaI (NEB) (see Figure S1). See Table S6 for relevant primers.
Flow cytometric analysis of receptor trafficking
Flow cytometric analysis of receptor surface immunofluorescence was used to determine agonist induced internalization and subsequent agonist-withdrawn surface recovery (recycling). HEK293 cells stably expressing FLAG-tagged receptors were left untreated as a control, incubated with 10 µM agonist (isoproterenol for B2AR or DADLE for DOR) for the noted time (0–30 min). To measure recycling, cells were incubated with 10 µM agonist for 30 min, washed, and then incubated for an additional 30 min with 10 mM antagonist (alprenolol for B2AR or naloxone for DOR). All cells were washed twice in ice-cold PBS to stop trafficking, and incubated at 4°C for 45 min with 2 µg mL-1 Alexa647 (Life Technologies)-conjugated M1 anti-FLAG (Sigma F-3040). Cells were washed once in PBS at 4°C, and then mechanically lifted in PBS for an additional 45 min at 4°C. Median fluorescence intensity of 10,000 cells per condition was measured using a FACSCalibur instrument (Becton Dickinson). Internalization was calculated as a fraction of the agonist treated condition divided by untreated. Recycling was calculated as a fraction of surface recovered receptor divided by the internalized receptor. At least three independent biological experiments were performed in triplicate for each condition.
Flow cytometric analysis of receptor redistribution
Flow cytometric analysis of B2AR redistribution was used to determine agonist induced changes to the surface-accessible pool of internal receptors. HEK293 cells stably expressing FLAG-tagged B2AR were incubated 2 µg mL-1 Alexa647 (Life Technologies)-conjugated M1 anti-FLAG (Sigma F-3040) for 10 min at 37°C. Cells were washed twice, and then left untreated as a control, incubated with 10 µM isoproterenol for B2AR for the noted time (0–30 min). Cells were placed on ice, washed three times in PBS+0.04% EDTA at 4°C to remove surface M1, and then mechanically lifted in PBS+0.04% EDTA for an additional 45 min at 4°C.
DOR lysosomal degradation assay
HEK293 cells stably expressing FLAG-DOR (no APEX2 tag) were stimulated with 10 µM DADLE from 0 to 6 hr, and DOR degradation was assessed by loss of FLAG immunoreactivity on a western blot using M1 anti-FLAG (1:1000). For quantification, receptor band intensities were analyzed in the linear range using ImageStudioLite (LI-COR) with a standard curve and internal normalization standard (CLTC, 1:1000).
Live cell cAMP accumulation assay
HEK293 cells were transiently transfected with the APEX-tagged GPCR and a cAMP biosensor, pGLO-20F (Promega). Prior to agonist stimulation, cells were incubated with 250 µg mL-1 luciferin for 45 min in DMEM without phenol red or serum. 10 nM isoproterenol (for B2AR), 10 µM DADLE and 10 nM isoproterenol (for DOR), or 10 µM forskollin (reference condition) were added to each well, and placed at 37°C. Luminescence was recorded every 10 s with a CCD sensor for 5 min. Luminescence signal generated agonist stimulation was integrated across the 5 min acquisition, and normalized to maximum output from 10 µM forskollin.
Live-cell imaging
HEK293 cells expressing GFP-tagged constructs were plated onto polylysine coated glass coverslips. Cells were imaged on a spinning disk confocal microscope (Nikon TE-2000 with Yokogawa confocal scanner unit CSU22) using a 100x objective in 37°C in DMEM without Phenol Red and supplemented with 30 mM HEPES.
APEX reaction and biotinylated protein capture
500 µM biotin-phenol was pre-incubated with cells for 30 min at 37°C. 10 µM isoproterenol (for B2AR) or 10 µM DADLE (for DOR) experiments was added for the noted period of time (see Figure S1F for more information on the experimental scheme). Immediately prior to use, H2O2 was diluted to 2 mM final in room-temperature media (DMEM+10% FBS). APEX labeling was initiated by 1:1 mixing of the H2O2 containing media room temperature media (1 mM H2O2 final) with the biotin-phenol containing media. The labeling reaction was allowed to continue for 30 s, media was removed, and the cells were washed three times in ice cold quenching buffer (TBS supplemented with 1 mM CaCl2, 10 mM sodium ascorbate, 1 mM sodium azide, and 1 mM Trolox). Cells were incubated in quenching buffer for 20 min on ice, quenching buffer was removed, and cells were lysed in RIPA (50 mM Tris, 150 mM NaCl, 1% Triton X-100, 0.5% deoxycholate, 0.1% SDS, pH 7.4) supplemented with 10 mM sodium ascorbate, 1 mM sodium azide, 1 mM Trolox, 1mM DTT, and protease inhibitors (Roche Complete). Samples were briefly sonicated, spun down at 10,000 × g for 10 min, the supernatant was applied to streptavidin agarose resin (Thermo), and incubated overnight at 4°C.
Western blots
Lysate bound streptavidin agarose was washed four times (10 bed volumes per wash) in RIPA buffer. For all non-receptor proteins, samples were boiled in NuPAGE LDS sample buffer (Life Technologies) supplemented with 100 mM dithiothreitol or 200 mM B-mercaptoethanol. For receptors, samples were incubated for 60 min in reductant containing sample buffer at room temperature. All samples separated on 4%–12% SDS-PAGE (Life Technologies), transferred to nitrocellulose membrane (BioRad), and blocked in TBS Odyssey buffer (LI-COR). Primary antibodies for western blots: goat anti-VPS35 (1:500, Novus Biologicals NB100–1397), mouse anti-GFP (1:500, Roche 11814460001), mouse M1 anti-FLAG (1:500, Sigma F-3040), mouse anti-CLTC (1:500, Santa Cruz sc-12734), rabbit anti-TOM1 (1:500, Abcam ab170928), anti-WWP2 (1:500, Abcam ab103527) and mouse anti-GAPDH (1:1000, EMD Millipore MAB374). Membranes were subsequently washed in TBS-Tween (0.1% v/v) and then incubated with secondary fluorescent antibodies (680-donkey-anti-goat, 680-donkey-anti-rabbit, or 800-donkey-anti-mouse). Membranes were washed in TBS-Tween (0.1% v/v), rinsed in TBS, and imaged using an Odyssey Infrared Imaging System (LI-COR). For quantification, band intensities were analyzed in the linear range using ImageStudioLite (LI-COR) with a standard curve and internal normalization standard (GAPDH).
Preparation of APEX-labeled proteins for western blot or mass spectrometry
Streptavidin agarose resin was washed two times in RIPA buffer (50 bed volumes per wash), four times in TBS (50 bed volumes per wash), one time in 50 mM NH4HCO3, 3 M Urea (1 bed volume per wash). Samples were reduced on resin by adding TCEP (5 mM final) and incubating, with orbital shaking, for 30 min at 55°C. Samples were alkylated by adding iodoacetamide (10 mM final), covered from light and with orbital shaking, for 20 min at room temperature. The reaction was quenched upon addition of DTT (20 mM final). The streptavidin agarose resin was spun down and the buffer exchanged to 50 mM NH4HCO3, 2 M Urea. Biotinylated proteins were cleaved on resin by the incubation of trypsin overnight at 37°C (1 µg trypsin per 20 uL of streptavidin agarose). Following proteolysis, the resin was spun down by centrifugation at 1000 × g for 1 min, and supernatant collected. The resins were washed twice with 50 mM NH4HCO3, 2 M Urea and this material was pooled with the first supernatant. The sample was acidified with TFA. NEST C18 MacroSpin columns were used to desalt the peptide sample for mass spectrometric analysis.
Shotgun mass spectrometric data acquisition
Digested peptide mixtures were analyzed by LC-MS/MS on a Thermo Scientific LTQ Orbitrap Elite mass spectrometry system equipped with a Proxeon Easy nLC 1000 ultra high-pressure liquid chromatography and autosampler system. Samples were injected onto a C18 column (25 cm × 75 µm I.D. packed with ReproSil Pur C18 AQ 1.9 µm particles) in 0.1% formic acid and then separated with a 90 min gradient from 5% to 30% ACN in 0.1% formic acid at a flow rate of 300 nl/min. The mass spectrometer collected data in a data-dependent fashion, collecting one full scan in the Orbitrap at 120,000 resolution followed by 10 collision-induced dissociation MS/MS scans in the dual linear ion trap for the 10 most intense peaks from the full scan. Dynamic exclusion was enabled for 30 s with a repeat count of 1. Charge state screening was employed to reject analysis of singly charged species or species for which a charge could not be assigned. The resulting data were analyzed using MaxQuant for identification and quantification (Cox and Mann, 2008). SAINTexpress was applied to score protein networks components of DOR (Choi et al., 2011, 2012) and MSstats was used for statistical analysis (Choi et al., 2014) (see Quantification and Statistical Analysis).
Targeted mass spectrometric data acquisition
SRM assays were generated for selected interactors of B2AR and DOR, as well as for localization controls and ribosomal proteins (RPL18A, RPL28, RPL3, RPL35A, RPL6) as internal controls for normalization (Table S5). SRM assay generation was performed using Skyline (MacLean et al., 2010). For all targeted proteins, proteotypic peptides and optimal transitions for identification and quantification were selected based on a spectral library generated from the shotgun MS experiments. The Skyline spectral library was used to extract optimal coordinates for the SRM assays, e.g., peptide fragments and peptide retention times. For each protein 1–4 peptides were selected based on intensity, peptide length as well as chromatographic performance. For each peptide the 4 best SRM transitions were selected based on intensity and peak shape.
Digested peptide mixtures were analyzed by LC-SRM on a Thermo Scientific TSQ Quantiva MS system equipped with a Proxeon Easy nLC 1200 ultra high-pressure liquid chromatography and autosampler system. Samples were injected onto a C18 column (25 cm × 75 µm I.D. packed with ReproSil Pur C18 AQ 1.9 µm particles) in 0.1% formic acid and then separated with an 80 min gradient from 5% to 40% Buffer B (90% ACN/10% water/0.1% formic acid) at a flow rate of 300 nl/min. SRM acquisition was performed operating Q1 and Q3 at 0.7 unit mass resolution. For each peptide the best 4 transitions were monitored in a scheduled fashion with a retention time window of 4 min and a cycle time fixed to 2 s. Argon was used as the collision gas at a nominal pressure of 1.5 mTorr. Collision energies were calculated by, CE = 0.0348 * (m/z) + 0.4551 and CE = 0.0271 * (m/z) + 1.5910 (CE, collision energy and m/z, mass to charge ratio) for doubly and triply charged precursor ions, respectively. RF lens voltages were calculated by, RF = 0.1088* (m/z) + 21.029 and RF = 0.1157* (m/z) + 0.1157 (RF, RF lens voltage and m/z, mass to charge ratio) for doubly and triply charged precursor ions, respectively. The resulting data was analyzed with Skyline for identification and quantification of peptides. MSstats was used for statistical analysis (Choi et al., 2014) (see Quantification and Statistical Analysis).
Hierarchical clustering
The mean abundance data generated in targeted proteomics analysis was mean centered, normalized (scale −1 to +1), and clustered (uncentered correlation) using a single linkage using Gene Cluster 3.0 (de Hoon et al., 2004). Clustering results were visualized using Java Treeview (Saldanha, 2004).
De novo identification of protein location
Proximity labeling was performed for the protein of interest (PI-APEX2) and CYTO-APEX2. For proof-of-principle, PI-APEX2 used here was non-stimulated DOR-APEX2 or DOR-APEX2 stimulated for 10 min with agonist (10 µM DADLE). Label-free quantitative shotgun proteomics data acquisition, protein identification, and quantification, as well as statistical analysis were performed as described above. A significance cutoff FC ≥ 2 or FC ≤ 0.5 and p value ≤ 0.05 was used to identify proteins enriched in the PI sample. Unbiased analysis (PANTHER Overrepresentation Test of Cellular Components (release 20160715) was performed using Gene Onotology (GO Ontology database released 2016-12–28) against a reference list containing all Homo sapiens genes in the database (http://geneontology.org/page/go-enrichment-analysis) (Ashburner et al., 2000; Gene Ontology Consortium, 2015). We examined statistically significant enrichment (p < 0.05, Bonferroni multiple comparisons correction) for the following components: plasma membrane (GO:0005886), endosome (GO:0005768), late endosome/lysosome (GO:0005764), Golgi apparatus (GO:0005794), nucleus (GO:0005634), endoplasmic reticulum (GO:0005783), mitochondrion (GO: 0005739), peroxisomes (GO:0005777), and cilium (GO:0005929).
QUANTIFICATION AND STATISTICAL ANALYSIS
Statistics
For all non-mass spectrometry experiments, results are presented as mean ± standard error of the mean (SEM) based on at least 3 biologically independent experiments. Analysis of statistical significance was performed using Prism (6.0h, GraphPad) unpaired t test or, as necessary, one-way ANOVA (alpha = 0.05) with Sidak’s or Dunnett’s multiple comparisons correction.
Protein identification and quantification from shotgun proteomics
The raw data were analyzed using the MaxQuant algorithm (version 1.5.2.8) (Cox and Mann, 2008) for the identification and quantification of peptides and proteins. Data were searched against a database containing SwissProt Human (downloaded 12/2014), and the APEX2 sequence, concatenated to a decoy database where each sequence was randomized in order to estimate the false discovery rate (FDR). Variable modifications were allowed for methionine oxidation and protein N terminus acetylation. A fixed modification was indicated for cysteine carbamidomethylation. Full trypsin specificity was required. The first search was performed with a mass accuracy of ± 20 parts per million and the main search was performed with a mass accuracy of ± 4.5 parts per million. A maximum of 5 modifications and 2 missed cleavages were allowed per peptide. The maximum charge was set to 7+. Individual peptide mass tolerances were allowed. For MS/MS matching, the mass tolerance was set to 0.8 Da and the top 8 peaks per 100 Da were analyzed. MS/MS matching was allowed for higher charge states, water and ammonia loss events. The data were filtered to obtain a peptide, protein, and site-level false discovery rate of 0.01. The minimum peptide length was 7 amino acids. Results were matched between runs with a time window of 2 min for biological replicates.
Statistical analysis of shotgun MS data
Analysis of shotgun MS data were performed using the statistical models implemented in the MSstats package in order to calculate fold changes (FC) and p values (Choi et al., 2014). To reduce variation between APEX-constructs and their biological replicates we performed a constant normalization based on the median protein intensities per MS run. Proteins with a p value ≤ 0.05 and a log2 FC ≥ 1 were considered significant.
Scoring of specific DOR interactors
The following experimental design was used for the APEX experiments: For DOR-APEX2 we prepared four biological replicates of the time course. Each biological replicate was grown and processed at different times. The spatial references PM-APEX2 and ENDO-APEX2 were used as control condition and were processed and analyzed in parallel with the DOR-APEX2 time courses to avoid batch-effects. To create a single spatial reference condition for each time point, we fractionally combined the PM-APEX2 and Endo-APEX2 to reflect the overall receptor distribution at the plasma membrane and the endosome based on flow cytometric measurements of B2AR and DOR trafficking. First, we extracted protein MS1 intensities from each replicate of PM-APEX2 and ENDO-APEX2. Second, we fractionally combined the protein MS1 intensities from each replicate of PM-APEX2 and ENDO-APEX2 using the multiplication factors listed in Figure S4B to generate a specific spatial reference for each time point. Finally, we use SAINTexpress (Significance Analysis of INTeractome) to compare the DOR-APEX2 protein MS1 intensities at different time points after agonist treatment to the matching spatial reference and to assign confidence scores to observed PPIs (Choi et al., 2011, 2012). Protein MS1 intensities for each sample were calculated as the sum from the extracted MS1 peptide intensities for one protein in a given sample. To discriminate bona fide protein interactors of DOR from the spatial bystanders, we set an FDR threshold of 0.05. To generate an overall list of candidate DOR interactors, we combined the proteins with an FDR below 0.05 for each time point. The candidates were subsequently validated by targeted mass spectrometry.
Protein quantification from targeted proteomics data
SRM data were processed using Skyline (MacLean et al., 2010). Protein significance analysis was performed using MSstats (Choi et al., 2014). Normalization across samples was conducted based on selected global standard proteins (RPL18A, RPL28, RPL3, RPL35A, RPL6). Each protein was tested for abundance differences comparing DOR-APEX2 time points to the spatial references, PM-APEX2 and ENDO-APEX2. Proteins with an adjusted p value < 0.05 were considered significant. Model-based sample quantification implemented in MSstats was used to calculate the intensity of each protein in each biological sample and replicate combining all SRM transition intensities.
DATA AND SOFTWARE AVAILABILITY
Shotgun proteomics data access
RAW data and database search results have been deposited to the ProteomeXchange Consortium via the PRIDE partner repository with the dataset identifier PRIDE: PXD00575 (Vizcaíno et al., 2016).
Targeted proteomics data access
Raw data and SRM transition files can be accessed, queried, and downloaded via Panorama (https://panoramaweb.org/labkey/GPCR-APEX.url) (Sharma et al., 2014).
Supplementary Material
KEY RESOURCES TABLE
| REAGENT or RESOURCE | SOURCE | IDENTIFIER |
|---|---|---|
| Antibodies | ||
| Mouse anti-GFP | Roche | Cat# 11814460001; RRID: AB_390913 |
| Mouse anti-CLTC | Santa Cruz | Cat# sc-12734; RRID: AB_627263 |
| Goat anti-VPS35 | Novus Biologicals | Cat# NB100-1397; RRID: AB_2257186 |
| Mouse anti-FLAG (M1) | Sigma | Cat# F-3040; RRID: AB_439712 |
| Rabbit anti-TOM1 | Abcam | Cat# Ab170928 |
| Rabbit anti-WWP2 | Abcam | Cat# AB103527; RRID: AB_10710285 |
| Mouse anti-GAPDH | EMD Millipore | Cat# MAB374; RRID: AB_2107445 |
| Donkey anti-goat (680 conjugate) | LI-COR | Cat# 926-68074; RRID: AB_10956736 |
| Donkey anti-rabbit (680 conjugate) | LI-COR | Cat# 926-68073; RRID: AB_10954442 |
| Donkey anti-mouse (800 conjugate) | LI-COR | Cat# 926-32212; RRID: AB_621847 |
| Chemicals, Peptides, and Recombinant Proteins | ||
| Streptavidin Agarose Resin | Thermo Scientific/Pierce | Cat# PI-20353 |
| Biotin Phenol (Biotin Tyramide) | Berry & Associates | Cat# BT 1015 |
| Biotin Phenol (Biotin Tyramide) | Adipogen | Cat# CDX-B0270 |
| Deposited Data | ||
| Shotgun proteomics RAW and analyzed data | This study | http://www.ebi.ac.uk/pride/archive/projects/PXD005758 |
| Targeted proteomics RAW and analyzed data | This study | https://panoramaweb.org/labkey/GPCR-APEX.url |
| Experimental Models: Cell Lines | ||
| Human HEK293 Cells | ATCC | CRL-1573 |
| Recombinant DNA | ||
| pcDNA3.1: FLAG-B2AR-382-APEX2 | This study | N/A |
| pcDNA3.1: FLAG-DOR-APEX2 | This study | N/A |
| pcDNA3: CYTO-APEX2 | This study | N/A |
| pcDNA3: ENDO-APEX2 | This study | N/A |
| pcDNA3: PM-APEX2 | This study | N/A |
| pGLO-20F | Promega | Cat# E1171 |
| Sequence-Based Reagents | ||
| siRNA hWWP2 | QIAGEN | Cat# SI05083547 |
| siRNA hTOM1 | QIAGEN | Cat# SI03095344 |
| Primers listed in Table S6 | IDT | N/A |
| Software and Algorithms | ||
| Java TreeView 1.1.6r4 | Saldanha, 2004 | http://jtreeview.sourceforge.net |
| Gene Cluster 3.0 | de Hoon et al., 2004 | http://bonsai.hgc.jp/~mdehoon/software/cluster/ |
| PANTHER Overrepresentation Test of Cellular Components (release 20160715) | Ashburner et al., 2000; Gene Ontology Consortium, 2015 | http://geneontology.org/page/go-enrichment-analysis |
| MaxQuant | Cox and Mann, 2008 | http://www.coxdocs.org/doku.php?id=:maxquant:start |
| MSstats | Choi et al., 2014 | http://msstats.org |
| SAINTexpress | Choi et al., 2011 | http://saintapms.sourceforge.net/ |
| Skyline | MacLean et al., 2010 | https://skyline.ms/project/home/software/Skyline/begin.view |
| Prism 6.0h | GraphPad | https://www.graphpad.com/scientific-software/prism/ |
Highlights.
Method to spatially identify protein interaction networks in living cells
Quantitative proteomics applied to “deconvolve” APEX proximity labeling data
Ligand-stimulated remodeling of GPCR networks captured with sub-minute resolution
Previously unknown GPCR-linked proteins identified and functionally validated
Acknowledgments
B.T.L. was supported by the Program for Breakthrough Biomedical Research, which is partially funded by the Sandler Foundation and by the NIH (F32DA038947). R.H. is a recipient of postdoctoral fellowships from the Swiss National Science Foundation (P2EZP3_148742; P300P3_151154), the European Molecular Biology Organization (ALTF 1123-2013), and the Human Frontiers in Science Program (LT000089/2014-L). R.H. was also supported by NIH funding for the UCSF-Gladstone Institute of Virology and Immunology Center for AIDS Research (CFAR; P30-AI027763). K.E. is a recipient of the National Science Foundation Graduate Research Fellowship. A.Y.T. was supported by funding from the NIH (R01CA186568). M.v.Z. was supported by funding from the NIH (R01DA012864 and DA010711). N.J.K was supported from the NIH (P50 GM082250, U19 AI106754, P01 HL089707, P01 CA177332, U19 AI118610, R01 AI120694, and P01 AI063302). The work was carried out in the Thermo Fisher Scientific Mass Spectrometry Facility for Disease Target Discovery at the J. David Gladstone Institutes. We thank Hannes Braberg for advice on the hierarchical clustering analysis, Mike Shales for help with figure design, Aaron Marley, Nathan Thomsen, and James Wells for valuable discussion, and members of both the von Zastrow lab and Krogan lab for helpful advice and comments.
Footnotes
SUPPLEMENTAL INFORMATION
Supplemental Information includes five figures and six tables and can be found with this article online at http://dx.doi.org/10.1016/j.cell.2017.03.022.
AUTHOR CONTRIBUTIONS
B.T.L., R.H., N.J.K., and M.v.Z. conceived the experiments. B.T.L., R.H., K.E., and K.B.M. performed the experiments and analyzed the data. B.T.L., R.H., A.Y.T., N.J.K., and M.v.Z. contributed to the overall interpretation and to writing the manuscript.
References
- Aoh QL, Castle AM, Hubbard CH, Katsumata O, Castle JD. SCAMP3 negatively regulates epidermal growth factor receptor degradation and promotes receptor recycling. Mol Biol Cell. 2009;20:1816–1832. doi: 10.1091/mbc.E08-09-0894. [DOI] [PMC free article] [PubMed] [Google Scholar]
- Ashburner M, Ball CA, Blake JA, Botstein D, Butler H, Cherry JM, Davis AP, Dolinski K, Dwight SS, Eppig JT, et al. The Gene Ontology Consortium. Gene ontology: tool for the unification of biology. Nat. Genet. 2000;25:25–29. doi: 10.1038/75556. [DOI] [PMC free article] [PubMed] [Google Scholar]
- Bernatchez PN, Acevedo L, Fernandez-Hernando C, Murata T, Chalouni C, Kim J, Erdjument-Bromage H, Shah V, Gratton J-P, McNally EM, et al. Myoferlin regulates vascular endothelial growth factor receptor-2 stability and function. J. Biol. Chem. 2007;282:30745–30753. doi: 10.1074/jbc.M704798200. [DOI] [PubMed] [Google Scholar]
- Bisson N, James DA, Ivosev G, Tate SA, Bonner R, Taylor L, Pawson T. Selected reaction monitoring mass spectrometry reveals the dynamics of signaling through the GRB2 adaptor. Nat. Biotechnol. 2011;29:653–658. doi: 10.1038/nbt.1905. [DOI] [PubMed] [Google Scholar]
- Brangwynne CP. Phase transitions and size scaling of membrane-less organelles. J. Cell Biol. 2013;203:875–881. doi: 10.1083/jcb.201308087. [DOI] [PMC free article] [PubMed] [Google Scholar]
- Cheng ZJ, Zhao J, Sun Y, Hu W, Wu YL, Cen B, Wu GX, Pei G. beta-arrestin differentially regulates the chemokine receptor CXCR4-mediated signaling and receptor internalization, and this implicates multiple interaction sites between beta-arrestin and CXCR4. J. Biol. Chem. 2000;275:2479–2485. doi: 10.1074/jbc.275.4.2479. [DOI] [PubMed] [Google Scholar]
- Choi H, Larsen B, Lin Z-Y, Breitkreutz A, Mellacheruvu D, Fermin D, Qin ZS, Tyers M, Gingras A-C, Nesvizhskii AI. SAINT: probabilistic scoring of affinity purification-mass spectrometry data. Nat. Methods. 2011;8:70–73. doi: 10.1038/nmeth.1541. [DOI] [PMC free article] [PubMed] [Google Scholar]
- Choi H, Liu G, Mellacheruvu D, Tyers M, Gingras AC, Nesvizhskii AI. Analyzing protein-protein interactions from affinity purification-mass spectrometry data with SAINT. Curr. Protoc. Bioinformatics. 2012 doi: 10.1002/0471250953.bi0815s39. Chapter 8, Unit 8.15. [DOI] [PMC free article] [PubMed] [Google Scholar]
- Choi M, Chang C-Y, Clough T, Broudy D, Killeen T, MacLean B, Vitek O. MSstats: an R package for statistical analysis of quantitative mass spectrometry-based proteomic experiments. Bioinformatics. 2014;30:2524–2526. doi: 10.1093/bioinformatics/btu305. [DOI] [PubMed] [Google Scholar]
- Collins BC, Gillet LC, Rosenberger G, Röst HL, Vichalkovski A, Gstaiger M, Aebersold R. Quantifying protein interaction dynamics by SWATH mass spectrometry: application to the 14-3-3 system. Nat. Methods. 2013;10:1246–1253. doi: 10.1038/nmeth.2703. [DOI] [PubMed] [Google Scholar]
- Cox J, Mann M. MaxQuant enables high peptide identification rates, individualized p.p.b.-range mass accuracies and proteome-wide protein quantification. Nat. Biotechnol. 2008;26:1367–1372. doi: 10.1038/nbt.1511. [DOI] [PubMed] [Google Scholar]
- de Hoon MJL, Imoto S, Nolan J, Miyano S. Open source clustering software. Bioinformatics. 2004;20:1453–1454. doi: 10.1093/bioinformatics/bth078. [DOI] [PubMed] [Google Scholar]
- Dores MR, Lin H, Grimsey JN, Mendez F, Trejo J. The α-arrestin ARRDC3 mediates ALIX ubiquitination and G protein-coupled receptor lysosomal sorting. Mol. Biol. Cell. 2015;26:4660–4673. doi: 10.1091/mbc.E15-05-0284. [DOI] [PMC free article] [PubMed] [Google Scholar]
- Eichel K, Jullié D, von Zastrow M. β-Arrestin drives MAP kinase signalling from clathrin-coated structures after GPCR dissociation. Nat. Cell Biol. 2016;18:303–310. doi: 10.1038/ncb3307. [DOI] [PMC free article] [PubMed] [Google Scholar]
- Eulalio A, Behm-Ansmant I, Izaurralde E. P bodies: at the crossroads of post-transcriptional pathways. Nat. Rev. Mol. Cell Biol. 2007;8:9–22. doi: 10.1038/nrm2080. [DOI] [PubMed] [Google Scholar]
- Falguières T, Castle D, Gruenberg J. Regulation of the MVB pathway by SCAMP3. Traffic. 2012;13:131–142. doi: 10.1111/j.1600-0854.2011.01291.x. [DOI] [PubMed] [Google Scholar]
- Foltz DR, Jansen LET, Black BE, Bailey AO, Yates JR, 3rd, Cleveland DW. The human CENP-A centromeric nucleosome-associated complex. Nat. Cell Biol. 2006;8:458–469. doi: 10.1038/ncb1397. [DOI] [PubMed] [Google Scholar]
- Gavin A-C, Aloy P, Grandi P, Krause R, Boesche M, Marzioch M, Rau C, Jensen LJ, Bastuck S, Dümpelfeld B, et al. Proteome survey reveals modularity of the yeast cell machinery. Nature. 2006;440:631–636. doi: 10.1038/nature04532. [DOI] [PubMed] [Google Scholar]
- Gendron L, Cahill CM, von Zastrow M, Schiller PW, Pineyro G. Molecular Pharmacology of δ-Opioid Receptors. Pharmacol. Rev. 2016;68:631–700. doi: 10.1124/pr.114.008979. [DOI] [PMC free article] [PubMed] [Google Scholar]
- Gene Ontology Consortium. Gene Ontology Consortium: going forward. Nucleic Acids Res. 2015;43:D1049–D1056. doi: 10.1093/nar/gku1179. [DOI] [PMC free article] [PubMed] [Google Scholar]
- Gillooly DJ, Morrow IC, Lindsay M, Gould R, Bryant NJ, Gaullier JM, Parton RG, Stenmark H. Localization of phosphatidylinositol 3-phosphate in yeast and mammalian cells. EMBO J. 2000;19:4577–4588. doi: 10.1093/emboj/19.17.4577. [DOI] [PMC free article] [PubMed] [Google Scholar]
- Gurevich VV, Gurevich EV. Arrestins: critical players in trafficking of many GPCRs. Prog. Mol. Biol. Transl. Sci. 2015;132:1–14. doi: 10.1016/bs.pmbts.2015.02.010. [DOI] [PMC free article] [PubMed] [Google Scholar]
- Henry AG, White IJ, Marsh M, von Zastrow M, Hislop JN. The role of ubiquitination in lysosomal trafficking of δ-opioid receptors. Traffic. 2011;12:170–184. doi: 10.1111/j.1600-0854.2010.01145.x. [DOI] [PMC free article] [PubMed] [Google Scholar]
- Hislop JN, Henry AG, Marchese A, von Zastrow M. Ubiquitination regulates proteolytic processing of G protein-coupled receptors after their sorting to lysosomes. J. Biol. Chem. 2009;284:19361–19370. doi: 10.1074/jbc.M109.001644. [DOI] [PMC free article] [PubMed] [Google Scholar]
- Hung V, Zou P, Rhee HW, Udeshi ND, Cracan V, Svinkina T, Carr SA, Mootha VK, Ting AY. Proteomic mapping of the human mitochondrial intermembrane space in live cells via ratiometric APEX tagging. Mol. Cell. 2014;55:332–341. doi: 10.1016/j.molcel.2014.06.003. [DOI] [PMC free article] [PubMed] [Google Scholar]
- Hung V, Udeshi ND, Lam SS, Loh KH, Cox KJ, Pedram K, Carr SA, Ting AY. Spatially resolved proteomic mapping in living cells with the engineered peroxidase APEX2. Nat. Protoc. 2016;11:456–475. doi: 10.1038/nprot.2016.018. [DOI] [PMC free article] [PubMed] [Google Scholar]
- Ideker T, Krogan NJ. Differential network biology. Mol. Syst. Biol. 2012;8:565. doi: 10.1038/msb.2011.99. [DOI] [PMC free article] [PubMed] [Google Scholar]
- Inoue T, Heo WD, Grimley JS, Wandless TJ, Meyer T. An inducible translocation strategy to rapidly activate and inhibit small GTPase signaling pathways. Nat. Methods. 2005;2:415–418. doi: 10.1038/nmeth763. [DOI] [PMC free article] [PubMed] [Google Scholar]
- Irannejad R, Tsvetanova NG, Lobingier BT, von Zastrow M. Effects of endocytosis on receptor-mediated signaling. Curr. Opin. Cell Biol. 2015;35:137–143. doi: 10.1016/j.ceb.2015.05.005. [DOI] [PMC free article] [PubMed] [Google Scholar]
- Itzhak DN, Tyanova S, Cox J, Borner GHH. Global, quantitative and dynamic mapping of protein subcellular localization. eLife. 2016;5:5. doi: 10.7554/eLife.16950. [DOI] [PMC free article] [PubMed] [Google Scholar]
- Jäger S, Cimermancic P, Gulbahce N, Johnson JR, McGovern KE, Clarke SC, Shales M, Mercenne G, Pache L, Li K, et al. Global landscape of HIV-human protein complexes. Nature. 2011;481:365–370. doi: 10.1038/nature10719. [DOI] [PMC free article] [PubMed] [Google Scholar]
- Kennedy JE, Marchese A. Regulation of GPCR trafficking by ubiquitin. Prog. Mol. Biol. Transl. Sci. 2015;132:15–38. doi: 10.1016/bs.pmbts.2015.02.005. [DOI] [PMC free article] [PubMed] [Google Scholar]
- Kholodenko BN. Cell-signalling dynamics in time and space. Nat. Rev. Mol. Cell Biol. 2006;7:165–176. doi: 10.1038/nrm1838. [DOI] [PMC free article] [PubMed] [Google Scholar]
- Kim DI, Roux KJ. Filling the void: proximity-based labeling of proteins in living cells. Trends Cell Biol. 2016;26:804–817. doi: 10.1016/j.tcb.2016.09.004. [DOI] [PMC free article] [PubMed] [Google Scholar]
- Krogan NJ, Cagney G, Yu H, Zhong G, Guo X, Ignatchenko A, Li J, Pu S, Datta N, Tikuisis AP, et al. Global landscape of protein complexes in the yeast Saccharomyces cerevisiae. Nature. 2006;440:637–643. doi: 10.1038/nature04670. [DOI] [PubMed] [Google Scholar]
- Lam SS, Martell JD, Kamer KJ, Deerinck TJ, Ellisman MH, Mootha VK, Ting AY. Directed evolution of APEX2 for electron microscopy and proximity labeling. Nat. Methods. 2015;12:51–54. doi: 10.1038/nmeth.3179. [DOI] [PMC free article] [PubMed] [Google Scholar]
- Lauffer BEL, Melero C, Temkin P, Lei C, Hong W, Kortemme T, von Zastrow M. SNX27 mediates PDZ-directed sorting from endosomes to the plasma membrane. J. Cell Biol. 2010;190:565–574. doi: 10.1083/jcb.201004060. [DOI] [PMC free article] [PubMed] [Google Scholar]
- Lavallée-Adam M, Rousseau J, Domecq C, Bouchard A, Forget D, Faubert D, Blanchette M, Coulombe B. Discovery of cell compartment specific protein-protein interactions using affinity purification combined with tandem mass spectrometry. J. Proteome Res. 2013;12:272–281. doi: 10.1021/pr300778b. [DOI] [PMC free article] [PubMed] [Google Scholar]
- Lohse MJ, Hein P, Hoffmann C, Nikolaev VO, Vilardaga JP, Bünemann M. Kinetics of G-protein-coupled receptor signals in intact cells. Br. J. Pharmacol. 2008;153(Suppl 1):S125–S132. doi: 10.1038/sj.bjp.0707656. [DOI] [PMC free article] [PubMed] [Google Scholar]
- Lundberg E, Uhlén M. Creation of an antibody-based subcellular protein atlas. Proteomics. 2010;10:3984–3996. doi: 10.1002/pmic.201000125. [DOI] [PubMed] [Google Scholar]
- Luttrell LM, Ferguson SS, Daaka Y, Miller WE, Maudsley S, Della Rocca GJ, Lin F, Kawakatsu H, Owada K, Luttrell DK, et al. Beta-arrestin-dependent formation of beta2 adrenergic receptor-Src protein kinase complexes. Science. 1999;283:655–661. doi: 10.1126/science.283.5402.655. [DOI] [PubMed] [Google Scholar]
- MacLean B, Tomazela DM, Shulman N, Chambers M, Finney GL, Frewen B, Kern R, Tabb DL, Liebler DC, MacCoss MJ. Skyline: an open source document editor for creating and analyzing targeted proteomics experiments. Bioinformatics. 2010;26:966–968. doi: 10.1093/bioinformatics/btq054. [DOI] [PMC free article] [PubMed] [Google Scholar]
- Martell JD, Deerinck TJ, Sancak Y, Poulos TL, Mootha VK, Sosinsky GE, Ellisman MH, Ting AY. Engineered ascorbate peroxidase as a genetically encoded reporter for electron microscopy. Nat. Biotechnol. 2012;30:1143–1148. doi: 10.1038/nbt.2375. [DOI] [PMC free article] [PubMed] [Google Scholar]
- Marx V. Mapping proteins with spatial proteomics. Nat. Methods. 2015;12:815–819. doi: 10.1038/nmeth.3555. [DOI] [PubMed] [Google Scholar]
- McMahon HT, Boucrot E. Molecular mechanism and physiological functions of clathrin-mediated endocytosis. Nat. Rev. Mol. Cell Biol. 2011;12:517–533. doi: 10.1038/nrm3151. [DOI] [PubMed] [Google Scholar]
- Mick DU, Rodrigues RB, Leib RD, Adams CM, Chien AS, Gygi SP, Nachury MV. Proteomics of Primary Cilia by Proximity Labeling. Dev. Cell. 2015;35:497–512. doi: 10.1016/j.devcel.2015.10.015. [DOI] [PMC free article] [PubMed] [Google Scholar]
- Navaroli DM, Bellvé KD, Standley C, Lifshitz LM, Cardia J, Lambright D, Leonard D, Fogarty KE, Corvera S. Rabenosyn-5 defines the fate of the transferrin receptor following clathrin-mediated endocytosis. Proc. Natl. Acad. Sci. USA. 2012;109:E471–E480. doi: 10.1073/pnas.1115495109. [DOI] [PMC free article] [PubMed] [Google Scholar]
- Oo ML, Chang SH, Thangada S, Wu MT, Rezaul K, Blaho V, Hwang SI, Han DK, Hla T. Engagement of S1P1-degradative mechanisms leads to vascular leak in mice. J. Clin. Invest. 2011;121:2290–2300. doi: 10.1172/JCI45403. [DOI] [PMC free article] [PubMed] [Google Scholar]
- Perini ED, Schaefer R, Stöter M, Kalaidzidis Y, Zerial M. Mammalian CORVET is required for fusion and conversion of distinct early endosome subpopulations. Traffic. 2014;15:1366–1389. doi: 10.1111/tra.12232. [DOI] [PubMed] [Google Scholar]
- Perry SJ, Baillie GS, Kohout TA, McPhee I, Magiera MM, Ang KL, Miller WE, McLean AJ, Conti M, Houslay MD, Lefkowitz RJ. Targeting of cyclic AMP degradation to beta 2-adrenergic receptors by beta-arrestins. Science. 2002;298:834–836. doi: 10.1126/science.1074683. [DOI] [PubMed] [Google Scholar]
- Rhee HW, Zou P, Udeshi ND, Martell JD, Mootha VK, Carr SA, Ting AY. Proteomic mapping of mitochondria in living cells via spatially restricted enzymatic tagging. Science. 2013;339:1328–1331. doi: 10.1126/science.1230593. [DOI] [PMC free article] [PubMed] [Google Scholar]
- Ritter SL, Hall RA. Fine-tuning of GPCR activity by receptor-interacting proteins. Nat. Rev. Mol. Cell Biol. 2009;10:819–830. doi: 10.1038/nrm2803. [DOI] [PMC free article] [PubMed] [Google Scholar]
- Rosenbaum DM, Rasmussen SGF, Kobilka BK. The structure and function of G-protein-coupled receptors. Nature. 2009;459:356–363. doi: 10.1038/nature08144. [DOI] [PMC free article] [PubMed] [Google Scholar]
- Saldanha AJ. Java Treeview-extensible visualization of microarray data. Bioinformatics. 2004;20:3246–3248. doi: 10.1093/bioinformatics/bth349. [DOI] [PubMed] [Google Scholar]
- Schmidt O, Teis D. The ESCRT machinery. Curr. Biol. 2012;22:R116–R120. doi: 10.1016/j.cub.2012.01.028. [DOI] [PMC free article] [PubMed] [Google Scholar]
- Scott JD, Pawson T. Cell signaling in space and time: where proteins come together and when they’re apart. Science. 2009;326:1220–1224. doi: 10.1126/science.1175668. [DOI] [PMC free article] [PubMed] [Google Scholar]
- Seet LF, Liu N, Hanson BJ, Hong W. Endofin recruits TOM1 to endosomes. J. Biol. Chem. 2004;279:4670–4679. doi: 10.1074/jbc.M311228200. [DOI] [PubMed] [Google Scholar]
- Sharma V, Eckels J, Taylor GK, Shulman NJ, Stergachis AB, Joyner SA, Yan P, Whiteaker JR, Halusa GN, Schilling B, et al. Panorama: a targeted proteomics knowledge base. J. Proteome Res. 2014;13:4205–4210. doi: 10.1021/pr5006636. [DOI] [PMC free article] [PubMed] [Google Scholar]
- Sorkin A, von Zastrow M. Endocytosis and signalling: intertwining molecular networks. Nat. Rev. Mol. Cell Biol. 2009;10:609–622. doi: 10.1038/nrm2748. [DOI] [PMC free article] [PubMed] [Google Scholar]
- Temkin P, Lauffer B, Jäger S, Cimermancic P, Krogan NJ, von Zastrow M. SNX27 mediates retromer tubule entry and endosome-to-plasma membrane trafficking of signalling receptors. Nat. Cell Biol. 2011;13:715–721. doi: 10.1038/ncb2252. [DOI] [PMC free article] [PubMed] [Google Scholar]
- Tsao PI, von Zastrow M. Type-specific sorting of G protein-coupled receptors after endocytosis. J. Biol. Chem. 2000;275:11130–11140. doi: 10.1074/jbc.275.15.11130. [DOI] [PubMed] [Google Scholar]
- Vizcaíno JA, Csordas A, del-Toro N, Dianes JA, Griss J, Lavidas I, Mayer G, Perez-Riverol Y, Reisinger F, Ternent T, et al. 2016 update of the PRIDE database and its related tools. Nucleic Acids Res. 2016;44(D1):D447–D456. doi: 10.1093/nar/gkv1145. [DOI] [PMC free article] [PubMed] [Google Scholar]
- Wang T, Liu NS, Seet LF, Hong W. The emerging role of VHS domain-containing Tom1, Tom1L1 and Tom1L2 in membrane trafficking. Traffic. 2010;11:1119–1128. doi: 10.1111/j.1600-0854.2010.01098.x. [DOI] [PubMed] [Google Scholar]
- Yamakami M, Yoshimori T, Yokosawa H. Tom1, a VHS domain-containing protein, interacts with tollip, ubiquitin, and clathrin. J. Biol. Chem. 2003;278:52865–52872. doi: 10.1074/jbc.M306740200. [DOI] [PubMed] [Google Scholar]
Associated Data
This section collects any data citations, data availability statements, or supplementary materials included in this article.