

Abstract
We used the Moving to Opportunity (MTO) housing experiment to inform how housing choice vouchers and housing mobility policies can assist families living in high-poverty areas to make opportunity moves to higher quality neighborhoods, across a wide range of neighborhood attributes. We compared the neighborhood attainment of the three randomly-assigned MTO treatment groups (Low Poverty voucher, Section 8 voucher, Control group) at 1997 and 2002 locations (4-7 years after baseline), by using survey reports, and by linking residential histories to numerous different administrative and population-based datasets. Compared to controls, families in Low-Poverty and Section 8 groups experienced substantial improvements in neighborhood conditions across diverse measures, including economic conditions, social systems (e.g., collective efficacy), physical features of the environment (e.g., tree cover) and health outcomes. The Low-poverty voucher group moreover achieved better neighborhood attainment compared to Section 8. Treatment effects were largest for New York and Los Angeles. We discuss the implications of our findings for expanding affordable housing policy.
A primary goal of housing mobility programs is to expand access for low-income families to safe, higher quality neighborhoods and housing units. The Moving to Opportunity for Fair Housing Demonstration Program was a randomized housing mobility demonstration implemented in five large cities among over 4,600 families. It was designed to understand the impact of moving volunteer low-income families out of very distressed public housing located in high-poverty neighborhoods into lower poverty neighborhood environments. After families volunteered, they were randomly assigned to receive one of three types of housing assistance or “treatments”, which included an offer of one of two types of Section 8 rental vouchers (now called Housing Choice Vouchers), or no voucher offer (public housing controls). One voucher could be used in any neighborhood (the Regular Section 8 group), while the other voucher could only be used in a low-poverty neighborhood (low-poverty group, also called MTO experimental group or housing mobility group). This low-poverty group also received housing counseling to help families find and lease rental units in low-poverty neighborhoods. Interest in MTO is growing due to recent findings showing that children who moved to low-poverty neighborhoods at a younger age (13 or younger)—and thus had longer exposures at younger ages to better neighborhood environments—had higher earnings and attended higher quality colleges as adults compared to children in the control group(Chetty, Hendren, and Katz 2015).
By design, participants in the low-poverty treatment were expected to move to substantially lower-poverty neighborhoods compared to their neighborhoods of origin, which were very high poverty neighborhoods, compared to the control group who remained behind in public housing, and compared to the Section 8 group who were neither required to move to low-poverty neighborhoods nor offered counseling to help them find housing in low-poverty neighborhoods. Three policy-relevant questions remain. First, did MTO treatment improve other aspects of the neighborhood environment besides lowering neighborhood poverty? For example, did it help families find housing in neighborhoods with lower crime rates, or greater collective efficacy? Second, did families in the regular section 8 voucher group experience improvements in the neighborhood environment of the same magnitude as families in the low-poverty neighborhood voucher group? Third, was there site variation in improvements in neighborhood conditions across the five MTO cities? Housing vouchers represent the predominant federal investment in affordable housing policy, providing housing assistance for more than 2.2 million low-income households and accounting for 40% of the U.S. Department of Housing and Urban Development's recent annual budget (National Low Income Housing Coalition 2012, DeLuca et al. 2012). By answering these questions, this study will inform the extent to which the Housing Choice Voucher program (called the Section 8 Voucher program during the initial implementation of MTO) and housing mobility programs can produce improvements in the residential environments for low-income families.
Residential mobility theories
Residential mobility can be influenced by human capital, preferences, life-cycle development, and place-based social stratification (Verma 2003, Vartanian, Buck, and Gleason 2007). Human capital characteristics represent individual- and family-level resources and skills that enable moves, such as education, income, and workforce experience. Preferences for neighborhood amenities and neighborhood socioeconomic or racial composition also influence not only individual moves but aggregate residential patterns such as racial segregation (Clark 1991, Ellen 2000). Notably, because of the correlation between neighborhood amenities (e.g., good schools or safety) and neighborhood composition it may be hard to disentangle preferences for each (Ellen 2000). Additionally, individual preferences are influenced by the residential context; individual-level mobility decisions are at once shaped by the realities of segregation and have the cumulative effect of maintaining segregated neighborhoods. For example, minority and low-income families may rely on spatially bound social networks for their residential moves, which, reinforces existing segregation patterns (Carrillo et al. 2016).
Life-cycle characteristics may condition the need or desire to move, among other things, and include characteristics such as age, marital status, and fertility. Finally, the place stratification model (Logan and Molotch 2007) posits the influence of structural constraints—such as housing discrimination, segregation, and the resultant concentration of poverty (Massey and Denton 1993)—on residential mobility that are more consequential for families of color (South and Deane 1993, South and Crowder 1997). For instance, research suggest that African Americans compared to whites are less likely to move away from a poor neighborhood and more likely to move into one, even when controlling for socioeconomic status. Additionally, African Americans compared to non-blacks are less likely to convert neighborhood dissatisfaction into a move (South and Deane 1993, South and Crowder 1997). These structural barriers have been created by practices of mortgage lenders (Shlay 1988), real estate agents (Yinger 1995), and local governments (Shlay and Rossi 1981). Importantly, preferences and structural racial stratification reinforce each other. Segregation influences the geography, the social networks, and the constellation of known neighborhoods in a housing search. Therefore, preferences are often shaped by delimited knowledge which reproduces segregation (Krysan, Crowder, and Bader 2014, Carrillo et al. 2016).
All three of these theories may help to understand the residential mobility of minority families, like those in MTO. For example, all of the MTO families had children, and about three-quarters cited the desire to escape drugs and gangs as motivating their moves and half cited wanting to relocate to areas with better schools (Orr et al. 2003), suggesting that life-cycle characteristics were shaping their mobility decisions. However, MTO families were among the most disadvantaged in the United States; most were minority, very low-income, and had only experienced highly segregated, high poverty neighborhoods. Most were single parent families with high levels of baseline health vulnerabilities and violent crime victimization, and from some of the highest poverty neighborhoods in the U.S. Thus they were less equipped to leverage some of the human capital factors that could facilitate relocation to better opportunity neighborhoods, especially in the face of strong constraints that may be race-specific (such as place stratification and preferences constrained by the realities of high segregation and poverty concentration). Other constraints they faced may have been functions of a tight housing market, in which MTO participants found themselves in the mid-nineties (in terms of limited supply of rental units in low-poverty neighborhoods, and rising rental costs). The MTO voucher experiment thus presented MTO families with a mechanism for overcoming such obstacles, providing them with an opportunity to improve their neighborhood contexts. Despite that, geographic variation in the above factors may further complicate residential mobility patterns across cities.
Place characteristics of the five MTO sites
Despite the same eligibility criteria across place, the 5 cities exhibited numerous differences that may have contributed to variation in neighborhood attainment of MTO families. The MTO experiment operated in cities with low vacancy rates, defined as the shares of available rental units at a particular time. However, four of the MTO cities had lower vacancy rates compared to the national average in 1990 (approximately 8%), and across the study period vacancy rates for all five cities dropped even lower (Briggs, Comey, and Weismann 2010). For instance, by the end of the decade in 2000, vacancy rates in greater Boston, New York, and LA were 3-4% (Briggs, Comey, and Weismann 2010). Concurrently, across all five cities, rents rose during this period. For example, from 1990 to 2005, inflation-adjusted rents rose in New York City by 23% (Briggs, Comey, and Weismann 2010). This suggests that in all five cities, the period in which MTO operated would have been a hard time for low-income families to find affordable units in low-poverty neighborhoods.
The five cities also differed in their neighborhood poverty distribution (Osypuk et al. 2009). There were proportionally fewer census tracts with poverty rates less than 20% in LA and New York (only 67% of neighborhoods in LA, and 63% of neighborhoods in New York, had poverty rates under 20%, respectively) than in the three other MTO cities (85-90% of tracts) (Briggs, Comey, and Weismann 2010). Additionally, the HOPE VI program was implemented in different magnitudes across the five cities. HOPE VI did not demolish public housing in New York as it did in the other cities (Orr et al. 2003), and there was large variation in the extent to which demolition of public housing affected the MTO control group across the other cities (e.g. 16% of controls in Los Angeles (L.A.), vs. 44% of controls in Baltimore) (Orr et al. 2003). Therefore, the public housing control group in New York and L.A. may not have improved their neighborhood context over time as much as it did in the other 3 cities, so the contrast between MTO treatment and controls may be larger there. Also in Baltimore, the MTO program was met with protests and unsubstantiated fears that blacks and other minorities would be coming from the inner-city and bring drugs and crime (Moberg 1995). This may have affected the quality of the voucher services provided.
Another factor influencing residential mobility of minority groups across cities is racial residential segregation, and its implications for not only separate actual neighborhoods by race, but also for separate distributions of neighborhood quality by race. For example, Osypuk and colleagues measured the overlap in neighborhood poverty distributions across the 100 largest metro areas, and found highly segregated metro areas displayed little overlap in the quality of neighborhoods inhabited by minorities versus whites; the correlation between residential segregation (black-white dissimilarity) and neighborhood quality overlap between black and white populations was -0.83 (Osypuk et al. 2009). Among MTO cites in year 2000, Chicago had the highest separation in neighborhood poverty between whites and blacks, followed by Boston, Baltimore, Los Angeles and New York at 18.8%, 22.4%, 26.9%, 27.0%, and 28.0% overlap respectively. So, L.A. and New York again emerge as the metro areas with lower structural constraints for neighborhood opportunity by race.
Implementation of MTO housing counseling also varied from site to site, as a result of variations in non-profit partners across sites, including different agency philosophy and organizational background, and resources of the partnering housing nonprofit. For example, in Baltimore, MTO clients received additional intensive non-housing counseling (i.e., workshops on budget management, household management, housing search, and landlord/tenant relations) before beginning their housing search. New York housing counseling agencies also directly recruited rental property brokers as part of landlord outreach, while the other cities did not (Feins, McInnis, and Popkin 1997).
Study aims and hypotheses
Most previous MTO studies have focused on individual outcomes such as mental health, physical health, or labor market outcomes (Ludwig et al. 2012, Clampet-Lundquist and Massey 2008, Fortson and Sanbonmatsu 2010, Kling, Liebman, and Katz 2007, Leventhal and Brooks-Gunn 2003, Nguyen et al. 2013, Osypuk, Schmidt, et al. 2012, Osypuk, Tchetgen, Acevedo-Garcia, Earls, et al. 2012, Schmidt, Lincoln, et al. 2014). From self-reports, previous research has found that MTO treatment decreased indoor and outdoor negative housing characteristics including the presence of broken plaster/peeling paint/peeling wallpaper, cracks/holes in windows/walls, vermin, broken windows, and problems with heating or plumbing (Orr et al. 2003, Fortson and Sanbonmatsu 2010). Less is known about how MTO affected other dimensions of neighborhood environment of participants, since the few available studies have relied mainly on U.S. Census data or MTO adult self-reports (Fortson and Sanbonmatsu 2010, Kling, Liebman, and Katz 2007, Orr et al. 2003, Feins 2003).
The primary aim of this paper is to document the effects of the MTO housing mobility experiment on a diverse array of neighborhood and housing outcomes. To accomplish this aim, we utilize a mosaic of restricted-access neighborhood surveys and publicly available administrative data sources, along with self-reported survey data of MTO participants and MTO interviewer reports. We hypothesize that (1) the MTO voucher treatment will be associated broadly with improvements in the neighborhood and housing unit conditions of participants compared to public housing controls; (2) compared to controls, the low-poverty MTO treatment group will generate larger treatment effects on neighborhood and housing unit environments than the Section 8 group; and (3) the magnitude of the MTO treatment effects on neighborhood environment will differ across the five different cities, signifying different structural constraints associated with housing markets, whether race-related (e.g. segregation, discrimination, constrained preferences) or not (housing counseling services; HOPE VI demolition; vacancy rates). Specifically, we hypothesize that MTO treatment effects on neighborhood quality will be smaller in magnitude in Boston (given the low vacancy rates, and high separation of whites and blacks in neighborhood poverty distributions). We anticipate that treatment effects in Baltimore and Chicago will fall in the middle, given that they achieve the middle position across the five cities in terms of vacancy rates and availability of low poverty census tracts. MTO may have been limited in Baltimore by political backlash and in Chicago by residential segregation. We anticipate that Los Angeles and New York have larger treatment effects among the cities, given they have relatively lower separation between whites and blacks in terms of neighborhood poverty distribution. Also, HOPE VI did not demolish much public housing in New York and L.A., and housing counselors coordinated with real estate brokers in New York. However, these cities also had low vacancy rates and availability of low poverty census tracts, which may be countervailing factors.
Neighborhood Effects and Moving to Opportunity
Neighborhoods matter in fundamental ways – for instance, by determining our exposure to crime, environmental hazards, and access to recreational facilities and community resources. Neighborhoods influence the composition of our social networks and provide economic and educational opportunities. They also differ with regard to their economic conditions and housing quality, social norms and values, and political organization and collective efficacy—all of which may impact individual- and family-level behaviors and outcomes, as well as the resources available to residents in pursuit of their life goals (Kawachi and Berkman 2003, Newburger, Birch, and Wachter 2011).
There is a growing literature documenting associations between neighborhood context and social, economic, and health outcomes(Galster 2002, Gary, Stark, and Laveist 2007, Ludwig et al. 2012, Ludwig et al. 2011, Mair, Diez Roux, and Galea 2008, Pickett and Pearl 2001, Waitzman and Smith 1998), and child well-being (Aneshensel and Sucoff 1996, Curtis, Dooley, and Phipps 2004, Leventhal, Dupéré, and Gunn 2009, DeLuca and Dayton 2009, Harding 2003, Santiago et al. 2014, Chetty, Hendren, and Katz 2015, Sharkey 2013). Therefore, to the extent that the HCV or housing mobility programs succeed in improving neighborhood context, and to the extent that neighborhoods cause (as opposed to just being associated with) other outcomes, HCV and housing mobility programs may have significant impacts on a variety of outcomes, potentially across sectors.
Previous research has documented that, as expected, MTO treatment families moved to neighborhoods with less economic disadvantage, indicated by improvements in a variety of economic measures from the U.S. Census, such as neighborhood poverty and family median income (Feins 2003). In line with that evidence, adult respondents in both voucher treatment groups (the low-poverty and Section 8 groups) reported lower levels of neighborhood disorder and higher levels of satisfaction with their current housing units. Field interviewers also observed better housing and neighborhood environments for members in the experimental treatment group versus control group members (Fortson and Sanbonmatsu 2010, Kling, Liebman, and Katz 2007, Orr et al. 2003). Furthermore, one study to date has merged external neighborhood-level data from sources other than the U.S. Census with MTO data and reported significant reductions in exposure to violent crime for movers in both treatment groups in three MTO cities (Kingsley and Pettit 2008). However, MTO had relatively small effects on school quality, with the low poverty treatment group attending schools with somewhat higher ranking on state exams (25th percentile versus 17th percentile for schools attended by control group members) 4-7 years after baseline (Orr et al. 2003). Two studies using data from the final MTO evaluation survey showed improved neighborhood environments for the two voucher groups. For example, families in the treatment group lived in lower poverty neighborhoods, were less likely to feel unsafe in their neighborhood, and reported fewer housing-related problems than the control group, even 10-15 years after baseline (Ludwig et al. 2012). The studies above suggest that housing mobility programs may improve certain aspects of neighborhood quality beyond neighborhood poverty. However, no previous study has used as comprehensive a set of neighborhood indicators as the one collected and used in the present analysis.
Geography of Opportunity
We use the geography of opportunity framework to guide organization of indicators of neighborhood quality (Galster and Killen 1995, de Souza Briggs 2006, Osypuk et al. 2009). The geography of opportunity posits that resources and risks are differentially distributed throughout the metropolitan region, and that they are starkly differential by race. Opportunity structures in neighborhoods encompass different domains such as housing markets, mortgage markets, criminal justice systems, local social networks, labor markets, social services delivery, political systems, and education systems that aid upward mobility. Neighborhood opportunity matters because it is considered an input for a vast array of outcomes in different areas, such as education, work, and well-being (Galster and Killen 1995).
In this study, we present neighborhood data organized in four domains, roughly corresponding to economic conditions, physical environment, social systems, and health outcomes. To operationalize economic conditions, we relied upon census tract indicators of economic disadvantage (e.g., unemployment rate) and affluence (e.g., median house value). Economic conditions are important neighborhood indicators of opportunity structure because they can influence individual-level income generation and education attainment. Physical features of the environment include land use, cleanliness of streets, and dilapidation of buildings and housing units. Physical features are important components of the opportunity structure because they can represent resources (e.g., recreational areas) or hazards (e.g., exposure to vermin). To operationalize the physical environment, we utilized MTO survey responses from participants and field interviewers, and external administrative data on land use, public works, and resident complaints.
To operationalize social systems, we rely upon census data on compositional characteristics of residents, MTO self-reports on neighborhood-level social interactions, indicators of neighborhood collective efficacy obtained via population-based surveys, and external administrative data on crime, disorder, and social norms. Collective efficacy, defined as mutual trust and a willingness to intervene for the common good (Sampson, Raudenbush, and Earls 1997b), is an oft-studied feature of the neighborhood social environment that is hypothesized to improve community functioning. For instance, it may help prevent juvenile delinquency by strengthening social control of youth in a neighborhood, and may advance economic development through neighbors' concerted action (Kawachi 1999). Finally, differences in opportunity structures can contribute to spatial differentiation in health outcomes. We examine community-level health outcomes with data from departments of health on prevalent health conditions, mortality, and birth outcomes.
Policy Implications
Findings from this study of how the MTO program causes improvements in neighborhood environment have important implications for housing policy. Given the size of the HCV program, an important policy question is to what extent does the program allow families to achieve better neighborhood environments, not only regarding neighborhood poverty but other neighborhood attributes. An additional policy relevant question is how locational attainment through the HCV/regular Section 8program compares with attainment via housing vouchers that have geographic stipulations for use in low poverty neighborhoods (since such rules are often embedded within Housing Mobility programs). This analysis allows us to examine these policy questions.
If the HCV/regular Section 8 program allows families to move into better neighborhood environments, expanding the policy could help improve the locational outcomes for more families. On the other hand, if geographic restrictions effectively incentivize families to move into better neighborhoods, and if improved locational outcomes are an important goal, it would be helpful to know that the program needs to be supplemented with incentives for families to move to higher opportunity are as, as well as with housing search counseling. Furthermore, to the extent that neighborhood environment is at the root of other outcomes, including education, employment or health, improving neighborhood environment may be a lever for improving other outcomes relevant to other policy sectors outside housing.
Methods
MTO was a $70 million housing mobility experiment carried out by the U.S. Department of Housing and Urban Development (U.S. Department of Housing and Urban Development 1996) in five cities: Baltimore, Boston, Chicago, Los Angeles, and New York. Eligible low-income families had children under age 18, qualified for rental assistance, and lived in public housing or project-based assisted housing in high-poverty neighborhoods (poverty rate ≥ 40%);5,301 families volunteered, and 4,610 families were eligible and randomized (Orr et al. 2003).
Moving to Opportunity (MTO) study is an experimental design – the gold standard for drawing causal inferences (Rothman and Greenland 1998) – and vastly improves on other studies by randomly assigning residence to a low-poverty neighborhood by virtue of a housing voucher. As a result, investigators using the MTO study can make strong statements about how the housing mobility program caused changes in neighborhood context, including as a strong base to inform policy.
MTO participant assessments
MTO household heads and their children completed surveys at baseline (1994-1998) (reported in Table 1) and at the interim follow-up 4-7 years after randomization (2001-2002). Up to two children were also randomly selected from each household. Interviews were conducted in person via computer-assisted interviewing technology. Adults provided informed written consent for themselves and their children (Orr et al. 2003, Goering et al. 1999). We focused on families (n=4,248) randomized through December 31, 1997 in MTO Tier 1 Restricted Access Data. The effective response was 90% for household heads and 89% for adolescents.
Table 1.
Baseline parent and family characteristics, Moving to Opportunity Program.
| Treatment Group (%) | ||||
|---|---|---|---|---|
|
|
||||
| Low poverty Group (N=1729) | Section 8 Group (N=1209) | Controls (N=1310) | ||
|
|
||||
| Parent Age (years) | 17-24 | 15.8 | 14.7 | 15.9 |
| 25-34 | 44.4 | 45.6 | 46.6 | |
| 34-44 | 28.3 | 27.3 | 26.7 | |
| 45+ | 11.4 | 12.4 | 10.8 | |
| Parent Female | 98.6 | 97.8 | 97.9 | |
| Parent Race/ethnicity | Black, non-Hispanic | 62.2 | 61.8 | 63.0 |
| Hispanic | 30.0 | 30.8 | 29.7 | |
| White/Other, Non-Hispanic | 7.8 | 7.4 | 7.3 | |
| Parent Education | < High school | 40.0 | 39.9 | 39.9 |
| GED | 18.0 | 20.2 | 21.9 | |
| High school diploma | 42.0 | 39.9 | 38.2 | |
| In School | 15.4 | 16.3 | 15.5 | |
| Family Structure | Never married | 59.7 | 60.1 | 61.2 |
| Teen parent | 23.6 | 24.9 | 23.6 | |
| Parent SES | Employed | 26.3 | 24.4 | 24.1 |
| On AFDC (welfare) | 74.0 | 75.0 | 74.0 | |
| Parent owns car | 17.5 | 16.8 | 15.4 | |
| No teens in household | No children ages 13-17 in core household | 59.7 | 60.6 | 62.8 |
| Household size | 2 | 22.2 | 21 | 20.4 |
| 3 | 30.4 | 29.8 | 31.9 | |
| 4 | 23.4 | 23.3 | 22.4 | |
| 5+ | 24.0 | 25.9 | 25.4 | |
| Health | HH member had a disability | 16.2 | 15.1 | 15.9 |
| Victimization | HH member victimized by crime past 6 months | 42.4 | 42.0 | 41 |
| Site | Baltimore | 15.0 | 15.0 | 15.0 |
| Boston | 22.6 | 22.6 | 22.6 | |
| Chicago | 21.1 | 21.1 | 21.1 | |
| Los Angeles | 16.0 | 16.0 | 16.0 | |
| New York | 25.5 | 25.5 | 25.5 | |
All variables range between 0 & 1 except baseline age. Analysis weighted for varying treatment random assignment ratios across time, and for attrition. Test of treatment group differences calculated from Wald chi-square tests outputted from logistic regression for dichotomous baseline characteristics and multinomial logistic regression for categorical characteristics. The null hypothesis was that none of the 3 treatment group proportions or means differed. We did not find statistically significant differences in baseline characteristics across treatment groups at p<0.001. Abbreviations: HH=household. SES=socioeconomic status. AFDC=Aid to Families with Dependent Children.
Treatment assignment
The explanatory variable of interest was the randomly-assigned type of housing assistance participants received. All families were originally living in distressed public housing in very-high poverty neighborhoods (poverty rate ≥ 40%). After families volunteered for the MTO program and answered the baseline assessment, they were randomized to one of three types of housing assistance or treatment groups in 1994-1998. The “low-poverty-neighborhood” treatment group was offered a Section 8 housing voucher that they could use to rent an apartment in the private market, with the restriction that these vouchers were redeemable only in neighborhoods where <10% of households in the census tract were poor. Local nonprofits provided housing counseling to this group to assist in relocation. The low poverty neighborhood restriction expired one year after relocating, after which families in this treatment group could make a second or subsequent move to another apartment using their housing voucher, regardless of the neighborhood poverty level, as long as they remained compliant with program rules, such as income eligibility and finding a unit that met the housing quality standards established for the program.
The “regular Section 8” treatment group was offered a traditional Section 8 housing voucher with no constraints on the neighborhood in which the housing unit was located, and they did not receive any housing counseling. Finally, the control group was given no further assistance, but could remain in public housing (Goering et al. 1999). As both voucher treatments built on the existing Section 8 program, they included a housing quality inspection as part of the Section 8 lease up process to ensure adequate Housing Quality Standards, which involves meeting the mandatory minimum of 13 requirements, such as having sanitary facilities, smoke detectors, and proper heating, electricity, and water (Quadel Consulting Corporation 2001).
Outcomes: Neighborhood characteristics
MTO program data
MTO data include participant self-reports on housing and neighborhood quality from the 2002 MTO interim survey, reported by both household heads and adolescent youth, as well as observations by MTO interviewers at the 2002 interim survey. Specific items are listed in Table 2; most are dichotomous. (Note: MTO did continue to follow families 10-15 years after randomization. However, at the time of analysis, the 2008-2010 MTO final evaluation data had not yet been made available to external investigators and thus could not be incorporated).
Table 2. Effects of the Moving to Opportunity Program on Self-Reported Neighborhood and Housing Characteristics at the Interim Survey, 2002.
| Treatment minus control differences | |||||||
|---|---|---|---|---|---|---|---|
|
| |||||||
| N | Low poverty (Exp) Group | Section 8 Group | Effect size: Exp. vs. Section 8c | Site hetero-geneityd | Adherence-adjusted site hetero-geneitye | ||
|
| |||||||
| Mean (SE) | Mean (SE) | P-value | P-value | P-value | |||
|
|
|||||||
| Adult self-report | |||||||
| Disorder | Problem with public drinking or people hanging out in neighborhood | 3489 | -0.35 (0.04)† | -0.21 (0.05)† | 0.004 | 0.02 | 0.03 |
| Seen people using drugs during past 30 days | 3480 | -0.25 (0.05)† | -0.22 (0.05)† | 0.55 | 0.20 | 0.53 | |
| Problem with police not coming when called | 3286 | -0.28 (0.05)† | -0.21 (0.05)† | 0.08 | 0.22 | 0.63 | |
| Problem with trash in neighborhood | 3523 | -0.20 (0.05)† | -0.14 (0.05) | 0.14 | 0.18 | 0.36 | |
| Problem with graffiti in neighborhood | 3521 | -0.27 (0.04)† | -0.19 (0.05)† | 0.10 | 0.14 | 0.48 | |
| Problem with abandoned buildings in neighborhood | 3506 | -0.14 (0.04)† | -0.14 (0.05) | 0.93 | 0.59 | 0.89 | |
| Sum of above-listed social disorder items | 3524 | -0.35 (0.05)† | -0.26 (0.05)† | 0.06 | 0.02 | 0.43 | |
| Individual Level Collective Efficacy | Neighbors would do something about children spray-painting graffiti | 3349 | 0.22 (0.04)† | 0.12 (0.05) | 0.02 | 0.18 | 0.41 |
| Neighbors would do something about children skipping school or hanging out on corner | 3270 | 0.21 (0.05)† | 0.14 (0.05) | 0.12 | 0.18 | 0.72 | |
| Social Trust & Connectedness | Most people can be trusted | 3486 | 0.03 (0.05) | 0.04 (0.05) | 0.96 | 0.15 | 0.16 |
| Stops to chat with neighbor in street or hallway at least once a week | 3510 | 0.03 (0.05) | 0.03 (0.05) | 0.95 | 0.55 | 0.53 | |
| Has no friend who lives in his/her neighborhood | 3517 | 0.05 (0.04) | 0.08 (0.05) | 0.46 | 0.95 | 0.92 | |
| Safety & Crime Victimization | Household member had their purse, wallet or jewelry snatched from them in the past 6 months | 3519 | -0.05 (0.04) | -0.13 (0.04) | 0.07 | 0.13 | 0.22 |
| Household member been stabbed or shot in past 6 months | 3519 | -0.03 (0.04) | -0.09 (0.04) | 0.17 | 0.60 | 0.67 | |
| Household member beaten or assaulted in past 6 months | 3518 | -0.11 (0.04) | -0.10 (0.05) | 0.93 | 0.07 | 0.08 | |
| Household member threatened with knife or gun in past 6 months | 3516 | -0.10 (0.04) | -0.11 (0.05) | 0.84 | 0.11 | 0.13 | |
| Anyone tried to break into home in past 6 months | 3515 | -0.01 (0.04) | -0.05 (0.04) | 0.31 | 0.07 | 0.06 | |
| Any of the above-listed victimization (yes/no) | 3499 | -0.10 (0.04) | -0.13 (0.05) | 0.47 | 0.60 | 0.67 | |
| Feel safe in current neighborhood during the day | 3514 | 0.25 (0.05)† | 0.25 (0.05)† | 0.92 | 0.16 | 0.11 | |
| Feel safe in current neighborhood at night | 3482 | 0.30 (0.05)† | 0.19 (0.05)† | 0.03 | 0.30 | 0.18 | |
| Current housing unit quality | Problem with broken windows | 3526 | -0.13 (0.04) | -0.06 (0.05) | 0.12 | 0.22 | 0.14 |
| Problem with broken locks on door | 3526 | -0.10 (0.04) | -0.05 (0.05) | 0.27 | 0.21 | 0.17 | |
| Problem with heating | 3511 | -0.07 (0.04) | -0.04 (0.05) | 0.41 | 0.34 | 0.38 | |
| Problem with plumbing | 3525 | -0.08 (0.04) | -0.03 (0.05) | 0.26 | 0.05 | 0.11 | |
| Problem with rats or mice in current unit | 3522 | -0.10 (0.04) | 0.01 (0.05) | 0.02 | 0.46 | 0.37 | |
| Problem with roaches in current unit | 3525 | -0.10 (0.04) | -0.08 (0.05) | 0.62 | 0.00 | 0.01 | |
| Problem with peeling paint or wallpaper in current unit | 3525 | -0.18 (0.05)† | -0.14 (0.05) | 0.36 | 0.69 | 0.83 | |
| Count of housing problems in current unit (7 items) | 3526 | -0.18 (0.04)† | -0.09 (0.05) | 0.05 | 0.07 | 0.08 | |
| Interviewer-Observed Housing Quality | |||||||
| Housing has wall-to-wall carpeting | 3321 | 0.18 (0.04)† | 0.18 (0.05)† | 0.97 | 0.07 | 0.25 | |
| Problem with broken plaster or peeling paint | 3325 | 0.01 (0.04) | -0.04 (0.05) | 0.26 | 0.77 | 0.82 | |
| Observed windows or walls with open cracks or holes | 3370 | -0.02 (0.05) | -0.02 (0.05) | 0.98 | 0.76 | 0.75 | |
| (Negative) exterior of home index, range [0,1]a | 3370 | -0.17 (0.04)† | -0.14 (0.05) | 0.44 | 0.27 | 0.25 | |
| (Negative) interior of home index, range [0,1]b | 3330 | -0.07 (0.04) | -0.06 (0.05) | 0.86 | 0.66 | 0.53 | |
| Youth self-report of Neighborhood/School Quality | |||||||
| Reports existence of gangs in neighborhood or school | 4259 | -0.13 (0.04) | -0.06 (0.05) | 0.16 | 0.25 | 0.36 | |
| Heard gunshots in neighborhood at least once a week in the past 30 day | 4414 | -0.10 (0.05) | -0.12 (0.05) | 0.66 | 0.00 | 0.001 | |
| Saw people selling or using illegal drugs in neighborhood at least once a week during past 30 days | 4405 | -0.09 (0.05) | -0.10 (0.05) | 0.77 | 0.05 | 0.39 | |
Neighborhood characteristics were standardized with a mean of 0 and standard deviation of 1
Linear regression model controls for age, sex, race/ethnicity, parental education, family structure, parent's marital status, parent's employment status, parent's receipt of AFDC/TANF, parent's teen parent status, no teens in household, sibling combination, household size, presence of family health vulnerability/disability, family disability, and family experience of victimization.
p<.001 Statistically different from controls. Test of treatment group differences were calculated from Wald chi-square tests outputted from logistic regression for dichotomous outcomes. F-tests were used with linear regression for continuous outcomes. For youth outcomes, all tests adjusted for family-level clustering.
Sum of seven negative, interviewer-observed items including: housing unit was noisy from inside or outside, visible rooms were cluttered, open cracks/holes in ceilings/walls, broken plaster or peeling paint, dampness or mold on walls, evidence of cigarette smoking
Sum of seven negative, interviewer-observed items including: general condition of housing unit/building is poor, general condition of housing units/buildings on the block is poor, building has broken windows, building has metal bars on any of its windows above basement level, one or more buildings within half a block have metal bars on any of its windows above basement level, condition of the street in this block is poor, major accumulation of trash within half a block.
Effect estimates for experimental group vs. control group and section 8 group vs. control group are different from each other
Treatment*site interactions jointly equal 0
Adherence-adjusted analyses implemented via two-stage least squares (2SLS) regression. Treatment*site interactions jointly equal 0
Census data
In addition to program data, we linked the census tract of the MTO family address (in 1997 and 2002) to administrative neighborhood data including that from the 2000 Census on economic disadvantage (e.g., unemployment rate, poverty rate), affluence (e.g., percent of people with college degrees), and compositional characteristics (e.g., percent Hispanic) (Table 3).
Table 3. Census tract characteristics of the 1997 locations of MTO adults (n=4240).
| Treatment minus control differences | ||||||
|---|---|---|---|---|---|---|
|
| ||||||
| Low poverty (Exp) group | Section 8 group | Exp vs. Sec 8 | Site hetero-geneitya | Adherence-adjusted site hetero-geneityb | ||
|
| ||||||
| Mean (SE) | Mean (SE) | P-value | P-value | P-value | ||
|
|
||||||
| 2000 Census data | ||||||
| Economic disadvantage | Percent persons in poverty | -0.74 (0.03)† | -0.55 (0.03)† | <0.001 | <0.001 | <0.001 |
| Percent of households receiving public assistance income | -0.55 (0.03)† | -0.45 (0.03)† | <0.001 | <0.001 | <0.001 | |
| Percent female-headed families with own children 0-17 years | -0.52 (0.03)† | -0.43 (0.04)† | 0.01 | <0.001 | <0.001 | |
| Percent persons 25+ with less than high school degree | -0.67 (0.03)† | -0.39 (0.03)† | <0.001 | <0.001 | <0.001 | |
| Unemployment (16+ civilian labor force) | -0.51 (0.03)† | -0.42 (0.03)† | 0.003 | <0.001 | <0.001 | |
| Percent vacant housing units | -0.26 (0.03)† | -0.28 (0.04)† | 0.39 | <0.001 | <0.001 | |
| Affluence | Percent of people (25+) with college degrees | 0.47 (0.03)† | 0.21 (0.04)† | <0.001 | <0.001 | <0.001 |
| Percent 16-19-year-olds in school | 0.19 (0.04)† | 0.14 (0.04)† | 0.14 | <0.001 | <0.001 | |
| Percent of population minority males 16 + civilian employed | 0.34 (0.04)† | 0.43 (0.04)† | 0.02 | <0.001 | <0.001 | |
| Median family income | 0.76 (0.03)† | 0.44 (0.03)† | <0.001 | <0.001 | 0.001 | |
| Median house value | 0.20 (0.04)† | 0.20 (0.04)† | 0.97 | <0.001 | <0.001 | |
| Percent owner-occupied housing units | 0.68 (0.03)† | 0.42 (0.03)† | <0.001 | <0.001 | <0.001 | |
| Total number of businesses | 0.09 (0.05) | 0.05 (0.05) | 0.39 | <0.001 | <0.001 | |
| Composition | Percent of population 5+ living in same house since 1995 | 0.04 (0.03) | -0.09 (0.04) | <0.001 | <0.001 | <0.001 |
| Census tract participation rate | 0.27 (0.04)† | 0.17 (0.03)† | 0.005 | <0.001 | <0.001 | |
| Percent black, non-Hispanic | -0.06 (0.03) | -0.05 (0.03) | 0.80 | <0.001 | <0.001 | |
| Percent Hispanic | -0.26 (0.02)† | -0.06 (0.02) | <0.001 | <0.001 | <0.001 | |
| Percent foreign-born | 0.08 (0.02)† | 0.11 (0.02)† | 0.34 | <0.001 | <0.001 | |
| Percent minority males 10-19 years | -0.39 (0.04)† | -0.21 (0.04)† | <0.001 | <0.001 | <0.001 | |
| Ratio of minority males to white, non-Hispanic males aged 10-19 years | -0.14 (0.04)† | -0.03 (0.04) | <0.001 | 0.0043 | 0.005 | |
| Percent minority adults 25+ | -0.09 (0.04) | 0.11 (0.04)† | <0.001 | <0.001 | <0.001 | |
| Ratio of adult minority males 25+ years to minority youth 10-19 years | 0.15 (0.04)† | 0.10 (0.04) | 0.23 | 0.03 | 0.05 | |
All neighborhood and housing characteristics were standardized with a mean of zero and standard deviation of 1
p<.001 Statistically different from controls Linear regression model controls for age, sex, race/ethnicity, parental education, family structure, parent's marital status, parent's employment status, parent's receipt of AFDC/TANF, parent's teen parent status, no teens in household, sibling combination, household size, presence of family health vulnerability/disability, family disability, and family experience of victimization. Test of treatment group differences calculated from F-tests
Treatment*site interactions jointly equal 0
Adherence-adjusted analyses implemented via two-stage least squares (2SLS) regression. Treatment*site interactions jointly equal 0
City-specific external data
We merged in data from local police, planning, and health departments (See Appendix Table 1A for detailed description of neighborhood data sources and neighborhood indicators across the five MTO cities). Additionally, we obtained a multidimensional set of neighborhood quality indicators for Baltimore from the Baltimore Neighborhood Indicators Alliance, and a range of neighborhood data for New York City (NYC) from Infoshare, Department of City Planning, the Mayor's Office of Operations, Department of Parks and Recreation; NYC Police Department; and NYC Housing and Vacancy Survey. When gathering data on neighborhood characteristics from external datasets, we attempted to obtain data as close to the 1997-2002 time frame as possible. In the MTO dataset, the only geographic information we had on MTO participants was their census tract location at several points in time (to which the original program staff geocoded their residential addresses). Thus, when gathering external neighborhood data, we focused on obtaining tract-level characteristics. To link the external neighborhood-level data to MTO participants, we utilized MTO participant tract locations from their 1997 residential address (the first time point after randomization when we have full data on the location of MTO families), as well as from their 2002 address (the latest available address in the interim survey data). In the case where neighborhood datasets were linked to larger geographies than tracts, we utilized crosswalks provided by the dataset to map these geographies onto 2000 census tract boundaries.
Population based neighborhood surveys to measure social processes
In addition to administrative and program data, we utilized population-based neighborhood surveys in three of the MTO cities: the Boston Neighborhood Survey (BNS 2006), the Project on Human Development in Chicago Neighborhoods (PHDCN 1994-1995), and the New York Social Environment Survey (NYSES 2005). The neighborhood surveys used random sampling/random digit dialing (BNS, NYSES) or stratified probability sampling (PHDCN) of multiple residents per neighborhood, covering and representing the entire sampling frame of the universe of neighborhoods in the city (Azrael et al. 2009, Ahern and Galea 2011, Sampson, Raudenbush, and Earls 1997a). We utilized these neighborhood surveys in Boston, Chicago, and New York City to estimate neighborhood-level measures of social processes, including informal social control (5 items), social cohesion (5 items), collective efficacy (10 items), and intergenerational closure (4 items)(Sampson, Raudenbush, and Earls 1997b, Cleveland and Crosnoe 2004). Informal social control assesses the abilities of a neighborhood's residents to regulate behavior, achieve public order, and respond to cuts in public services. Social cohesion assesses mutual trust and reciprocity among residents. Collective efficacy combines the informal social control and social cohesion measures (Sampson, Raudenbush, and Earls 1997b). Intergenerational closure measures the degree to which adults and children are connected to one another in a community (i.e., youths have adult role models, parents can count on adults in the community to watch over their children, parents know each other and their children's friends) (Sampson, Morenoff, and Earls 1999). Internal consistency for these measures have been documented as excellent with Cronbach alphas ranging from 0.77-0.91 across measures (Ahern and Galea 2011, Rothman et al. 2011, Sampson, Raudenbush, and Earls 1997b).
To construct the neighborhood-level measures of social processes, we applied3-level hierarchical linear models implemented via HLM software (version 7, Scientific Software International, Inc.), using a data structure of scale items nested within respondents nested within neighborhoods. We created unconditional Empirical Bayes estimates by outputting neighborhood-level predicted values from a null model (no covariates) separately for each scale (Mujahid et al. 2007). We utilized null models because we wanted to use the actual neighborhood values, unadjusted for population composition, which is in alignment with our treatment of other neighborhood characteristics such as violent crime rates. We confirmed that each scale had adequate internal consistency reliability and econometric properties, consistent with other published neighborhood studies (Mujahid et al. 2007).
Violent crime rates
Violent crime consists of four offenses reported by city police departments: murder and non-negligent manslaughter, forcible rape, robbery, and aggravated assault. Census tract violent crime rates for Boston and Los Angeles were three year (1999-2001) averages drawn from the National Neighborhood Crime Study (NNCS). For Baltimore, we obtained 2001 violent crime rates for community statistical areas from the Baltimore Neighborhood Indicator Alliance. For Chicago, we obtained data on average (1998-2002) violent crime rates from the Chicago Police Department for 77 community areas. For New York, 1997 violent crime data was obtained from InfoShare and the New York City Police Department for the 55 community districts.
Analytic Approach
With the exception of census data which had close to 100% coverage of MTO participant residences, the city-specific neighborhood datasets (for which we have indicators unique to each city) had sampling frames and/or data confined to the boundaries of the city. However, some MTO participants moved outside the city to suburban locations. Therefore, we used multiple imputation by chained equations (MICE) (Royston and White 2011) with the set of census variables in Table 2 as predictors to extrapolate neighborhood values for suburban neighborhoods, within our analyses. The MICE analysis produced qualitatively very similar results and led to similar conclusions, compared with analyses omitting the imputation (available from authors upon request).
In order to ease interpretability and to allow comparisons of effect estimates across different neighborhood and housing characteristics, variables were standardized to a mean of zero and a standard deviation of one (Coley and Chase-Lansdale 1998). The interpretation of the direction of the treatment effect depends on the directionality of the variable tested. For example, if an indicator measured a negative neighborhood attribute (e.g., presence of drug users), the hypothesized MTO program effect would be negative, indicating the treatment group was less likely to be exposed to it than the control group. Conversely, if an indicator measured a positive neighborhood attribute, the hypothesized program effect would be positive, indicating the treatment group was more exposed to it than the control group.
To assess how the MTO program changed participants' neighborhood and housing conditions, we estimated intention-to-treat (ITT) treatment effects (Orr et al. 2003) derived from linear regression models, comparing the low-poverty or regular Section 8 groups to the public housing control group. Test of treatment group differences were calculated from Wald chi-square tests outputted from logistic regression for dichotomous characteristics. F-tests were used with linear regression for continuous variables. In total, we used 151 statistical tests to evaluate whether the low-poverty treatment group effect (vs. controls) differed from the Section 8 treatment group effect (vs. controls). Statistical significance was assessed at p<0.001 in all models, to account for multiple comparisons. We estimated models adjusted for baseline covariates to increase precision, although unadjusted models generated very similar results. We also present average effect sizes for the low-poverty group and Section 8 group, both compared to controls. In calculating this average, we assigned a negative value for neighborhood indicators that got worse and took the absolute value of other treatment effects—thus creating a summary measure in which higher values indicate better neighborhood conditions.
To test city heterogeneity for the Census and MTO Interim Survey outcomes, we assessed whether treatment-by-city interactions were jointly equal to zero using the F-test. A significant F-test indicates that treatment effects on outcomes differed by city, for at least one city versus the rest. For results utilizing youth self-reports, we adjusted the standard errors for family-level clustering given that up to two children per family were sampled for follow up. All results applied sample weights to account for changing random assignment ratios over time among treatment groups, for sample attrition, and for probability of selection of children within households. Our study was approved by our university's Institutional Review Board.
Results
MTO Baseline Adult and Family Characteristics
Table 1 lists baseline adult and family characteristics across the three treatment groups. No statistically significant (p<.001) differences in baseline characteristics among treatment groups were observed, as expected with an experimental design. At baseline, about 45% of adults were aged 25-34 years. Over 60% were African American, 30% were Hispanic and the remainder were white or other racial groups. About 40%of household heads had less than a high school education, 25% were employed, and 25% had been teen parents. Over half (57%) of households contained at least four members, 75% were receiving governmental financial assistance (AFDC/TANF), and almost all MTO households were female-headed. Fewer than 20% owned a car. Close to one in six reported that they had a household member with a physical or mental health condition that limited normal daily activities (i.e., disability). Lastly, violent crime victimization was high with over 40%reporting that a household member had been recently victimized (Table 1).
2002 MTO Interim Survey Self-Reported Neighborhood Assessments
Self-reports from the MTO adult heads-of-household suggest dramatically better neighborhood conditions for the voucher treatment groups, with significantly and substantially fewer signs of physical and social disorder (e.g., public drinking, trash, graffiti), greater adult self-reported collective efficacy (e.g., believed neighbors would do something if saw children skipping school), and better safety (e.g., feeling safe during the day and at night; lower violent crime victimization), compared to control group participants, 4-7 years after entering the MTO program (Table 2). For instance, seeing people using drugs over the past 30 days was approximately one-fourth of a standard deviation (SD)lower in both treatment groups compared to controls (standardized treatment effect (B) was -0.25 SD for the low-poverty and -0.22 SD for the Section 8 treatment groups). Significantly fewer youths in the low-poverty group reported the existence of gangs (B= -0.13 SD) in their neighborhood or school, or hearing gunshots (B= -0.10 SD) compared to controls (Table 2). Notably, however, MTO treatment did not change adult self-reported indicators of social trust and social connectedness (i.e., belief that most people can be trusted, stops to chat with neighbors weekly, and has no friends in neighborhood), as evidenced by small and statistically non-significant treatment effects.
The MTO intervention also caused modest improvements in housing quality. Adults in the low-poverty treatment group reported fewer problems with the housing unit (e.g., broken windows, rat/roaches, peeling paint); effect sizes on housing unit quality outcomes ranged from B=0.07 to 0.18 SD for the low-poverty treatment group vs. controls. However, housing quality for the regular Section 8 group was not statistically better than that of controls. Interviewer ratings of the exterior of the home were better for the low poverty treatment group versus controls, as indicated by negative scores on the index measuring poor quality of the exterior of the home (B= -0.17 SD; p<0.001).
Across all perceived neighborhood and housing indicators tested, effect estimates for the two voucher treatment groups were generally in the predicted direction (i.e., suggesting improvements in residential conditions). The only exceptions were effect estimates indicating non-statistically significant and very small increases in problems with plaster/peeling paint for the low poverty treatment group (B=+.01) and problems with rats or mice in current housing unit for the section 8 treatment group (B=+.01). After reverse coding these two indicators(i.e., assigning a negative value) and taking the absolute value of other effect estimates, average effect sizes were larger for the low-poverty group (0.14 SD) compared to the Section 8 group (0.11SD). However, individual effect estimates for the low-poverty group were not significantly different than for the Section 8 group at p<0.001, suggesting that the two treatment arms usually resulted in similar neighborhood environments by the interim follow up, when perceived neighborhood conditions were self-reported. Additionally, there was limited evidence for significant variation in treatment effects on subjective neighborhood context across the five cities; we found significant treatment-by-city interactions (p<0.001) for only 1 of the 36 outcomes. Treatment-by-city interactions for MTO self-reports remained statistically insignificant in adherence-adjusted models (implemented via two-stage linear regression) (Table 2).
Neighborhood Characteristics from U.S. Census Data
Utilizing MTO 1997 locations, the low-poverty group (relative to controls) experienced dramatic neighborhood improvements with respect to the socioeconomic composition of the neighborhood, including substantially lower poverty rates (B= -.74 SD),percentage of persons 25+ years of age with less than a high school degree (B= -.67SD), higher median family income (B= +.76 SD) and proportion of owner-occupied housing units (homeownership) (B= +.68 SD) (Table 3). All of these effects had absolute values exceeding two-thirds of an effect size, which was twice the largest single effect size from the models testing changes in MTO self-reported survey-based measures. Although the Section 8 treatment group also exhibited substantial improvements in socioeconomic environment, effect sizes for Section 8 vs. controls were statistically smaller than for the low-poverty group (vs. controls) for half (11) of the 22 indicators (p<0.001). Therefore, the low poverty treatment group experienced significantly better socioeconomic neighborhood contexts than the Section 8 group, on average. Lastly, we observed statistically significant differences in treatment effects for census tract characteristics across the 5 cities (indicated by significant treatment-by-city interactions), that were robust in adherence-adjusted analyses. For MTO treatment effects on census tract economic disadvantage, were generally larger for Chicago and Los Angeles larger than for other cities (Figure 1).
Figure 1. City-specific treatment effects on census tract economic disadvantage.
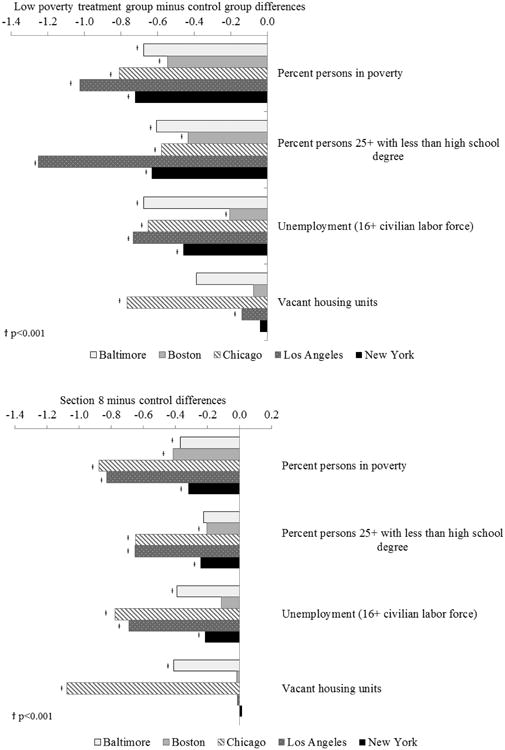
Neighborhood characteristics were standardized with a mean of 0 and standard deviation of 1. Linear regression models adjusted for baseline age, sex, race/ethnicity, parental education, family structure, parent's marital status, parent's employment status, parent's receipt of AFDC/TANF, parent's teen parent status, no teens in household, sibling combination, household size, presence of family health vulnerability/disability, family disability, and family experience of victimization. †p<.001
After comparing addresses of MTO participants in 1997 and 2002, we found that treatment effects on census-based socioeconomic characteristics were attenuated over time. For example, average treatment effect sizes for census tract economic disadvantage for the low-poverty and Section 8 groups compared to controls were 0.60 and 0.45 SD in 1997 compared to 0.39 and 0.31 SD in 2002 (Appendix 2A), representing reductions of 35% and 31% respectively over 5 years. This trend was partially attributable to the increasing poverty rates of chosen locations of the low-poverty group from 1990-2000, to some families in the low-poverty group moving back to higher poverty neighborhoods over time, and to some families in the control group moving to lower poverty neighborhoods (Orr et al. 2003).
City-specific data from neighborhood surveys and administrative data
Violent Crime
As shown in Figure 2, the low-poverty group in all cities except Boston experienced statistically significant (p<0.001) reductions in the neighborhood violent crime rate compared to controls (Figure 2). Violent crime rate reductions were largest for MTO low-poverty treatment participants (vs. controls) in Los Angeles and New York. The Section 8 treatment group also saw reductions in the violent crime rate, and these were statistically significantly different from controls for Los Angeles and New York.
Figure 2. City-specific treatment effects on violent crime.

Neighborhood characteristics were standardized with a mean of 0 and standard deviation of 1. Linear regression models adjusted for baseline age, sex, race/ethnicity, parental education, family structure, parent's marital status, parent's employment status, parent's receipt of AFDC/TANF, parent's teen parent status, no teens in household, sibling combination, household size, presence of family health vulnerability/disability, family disability, and family experience of victimization. †p<.001
Community Social Processes
In the three cities with collective efficacy data derived from community surveys, the low-poverty group was exposed to higher neighborhood collective efficacy vs. controls, although effect sizes only reached statistical significance in New York and Chicago (New York: 0.77 SD; Chicago: 0.46 SD; Boston: 0.25 SD; Figure 3). The Section 8 group was also exposed to statistically higher collective efficacy in New York, compared to controls. Results for social cohesion and informal social control were aligned with those for collective efficacy, as we would expect since they are both component scales of collective efficacy. Chicago's low-poverty group also saw increases in intergenerational closure (Figure 3).
Figure 3. City-specific treatment effects on collective efficacy.

Neighborhood characteristics were standardized with a mean of 0 and standard deviation of 1. Linear regression models adjusted for baseline age, sex, race/ethnicity, parental education, family structure, parent's marital status, parent's employment status, parent's receipt of AFDC/TANF, parent's teen parent status, no teens in household, sibling combination, household size, presence of family health vulnerability/disability, family disability, and family experience of victimization. †p<.001
City-specific External Data
MTO treatment effect sizes for measures obtained from city-specific administrative (objective) datasets are displayed graphically in Figure 4, separately for each of the 5 sites, arranged in descending order of the effect size magnitude for the low-poverty treatment group vs. controls. In the Appendix, we display effect estimates, from which the figure is derived, in city-specific tables. We discuss the findings for each city below, given that each city used a different administrative dataset with variations in outcome measures.
Figure 4. MTO treatment effects on 5 city-specific neighborhood characteristics.


Neighborhood characteristics were standardized with a mean of 0 and standard deviation of 1. Linear regression models adjusted for baseline age, sex, race/ethnicity, parental education, family structure, parent's marital status, parent's employment status, parent's receipt of AFDC/TANF, parent's teen parent status, no teens in household, sibling combination, household size, presence of family health vulnerability/disability, family disability, and family experience of victimization. Statistical significance at p<.001 denotated by: (b) if treatment effects effects are signficant for both treatment groups vs. controls, exp if treatment effects are significant only for the low poverty treatment group vs. controls, (s8) if treatment effects are significant only for the section 8 treatment group vs. controls, and (ns) if treatment effects are non-significant for both treatment groups vs. controls.
NOTE: indicators are ranked in the order of effect size for the low-poverty treatment group vs. controls, from most positive to most negative
In Baltimore (Panel A, Figure 4), the two voucher treatment groups saw improvements in neighborhood quality across a range of indicators, and estimates were generally larger for the low-poverty group than the Section 8 group. The voucher treatment groups had lower exposure to residential properties with housing violations, and were more likely to live in areas with greater economic diversity, compared to controls. Regarding indicators of health and well-being, the low poverty treatment group lived in neighborhoods with higher proportions of babies born of normal weight (rather than low birth weight), greater life expectancy at birth, lower teen birth rates, and lower drug poisoning death rates. The low poverty group also had higher exposure to tree canopy. Nonetheless, some results were unexpected. The Section 8 treatment group in Baltimore was more likely to live in areas with dirtier streets and more rats per capita than controls. Both the low-poverty and the Section 8 group were associated with greater numbers of abandoned vehicles per capita compared to the control group (Table 3A). Average effect sizes for the low-poverty and Section 8 group across all neighborhood indicators were 0.27 and 0.10 SD respectively.
In Boston, the low-poverty and Section 8 groups experienced higher exposure to tree canopy, and lower exposure to alcohol mortality; the low poverty group was additionally exposed to more open space. However, the treatment groups also lived in neighborhoods with higher proportions of children under the age of six with elevated lead levels. Average effect sizes for the low-poverty treatment and Section 8 groups in Boston were both 0.08 (Table 4A).
Table 4. Average treatment estimates across sites for 1997 MTO locations, by neighborhood characteristics.
| City-specific external dataa | Economic disadvantageb | Violent crime rates | Collective efficacy | All indicatorsc | |||||||
|---|---|---|---|---|---|---|---|---|---|---|---|
|
| |||||||||||
| Exp vs. control | Sec8 vs. control | Exp vs. control | Sec8 vs. control | Exp vs. control | Sec8 vs. control | Exp vs. control | Sec8 vs. control | Treatment groups combined | Exp vs. control | Sec8 vs. control | |
|
|
|||||||||||
| Baltimore | 0.27 | 0.10 | -0.66 | -0.37 | -0.40 | -0.11 | 0.32 | 0.44 | 0.19 | ||
| Boston | 0.08 | 0.08 | -0.39 | -0.25 | -0.18 | -0.21 | 0.25 | 0.20 | 0.20 | 0.22 | 0.18 |
| Chicago | 0.14 | 0.01 | -0.64 | -0.74 | -0.30 | -0.13 | 0.46 | 0.05 | 0.31 | 0.36 | 0.29 |
| Los Angeles | 0.49 | 0.38 | -0.96 | -0.74 | -0.68 | -0.74 | 0.67 | 0.71 | 0.62 | ||
| New York | 0.39 | 0.18 | -0.58 | -0.26 | -0.70 | -0.46 | 0.77 | 0.34 | 0.46 | 0.56 | 0.30 |
To calculate average treatment effects for city-specific external data, we assigned a negative value for neighborhood indicators that got worse (e.g., dirty streets) and took the absolute value of other treatment effects—thus creating a summary measure in which higher values indicate better neighborhood conditions
Economic disadvantage: poverty, % persons 25 years+ with less than high school degree, unemployment
Absolute value of all of the listed indicators combined, average of averages
In Chicago, the low poverty treatment group was exposed to lower violent crime and rape rates versus controls, as well as higher levels of collective efficacy, social cohesion, informal social control, and intergenerational closure. Both treatment groups experienced lower exposure to HIV-specific mortality rates. Surprisingly, compared to controls, the low-poverty treatment group was exposed to higher suicide rates than controls, and the Section 8 group lived in neighborhoods with higher rates of domestic violence calls for service, as well as higher proportions of children under the age of six with elevated lead levels, and lower values of building permits, compared with controls (Table 5A). Average effect sizes for the two treatment groups in Chicago were larger for the low-poverty group (0.14 SD) than the Section 8 group (0.01 SD).
In Los Angeles, the two treatment groups lived in neighborhoods with statistically significantly higher exposure to new building permits and recreational space, as well as greatly reduced violent crime rates, lower police costs, fewer police units dispatched, and fewer adult arrests, compared to controls (Table 6A). The low poverty treatment group was additionally exposed to fewer juvenile arrests, and fewer police units dispatched. The two treatment groups exhibited similar effect sizes; average effect sizes for the low-poverty and Section 8 group were 0.49 SD and 0.38 SD, respectively.
In New York City, treatment groups lived in neighborhoods with cleaner streets and sidewalks, lower violent crime rates, lower violence victimization rates, and higher collective efficacy, social cohesion, informal social control, and higher proportions of residents reporting that they like the neighborhood, compared to the public housing control group. Neighborhood smoking prevalence was lower, as were neighborhood-level depressive symptoms in the two treatment groups versus controls. The low-poverty group additionally lived in neighborhoods with fewer dilapidated housing units and with a lower proportion of mixed land use (i.e., commercial and residential), lower rape rates, better gender norms, and lower rates of depression diagnosis (Table 7A). Average effect sizes were twice as large for the low-poverty group (0.39 SD) compared to the Section 8 (0.18 SD) group, with 12 tests showing different effects for the low poverty versus the Section 8 treatment group.
In sensitivity analyses, we implemented instrumental variables analyses via two-stage least squares (2SLS) regression (Kling et al., 2007) to estimate adherence-adjusted treatment-on-treated (TOT) estimates; these TOT effects were approximately twice as large for subjective neighborhood reports and census compositional characteristics as the ITT estimates. Additionally, patterns observed for statistical significance tests of treatment heterogeneity remained largely the same in analyses adjusted for adherence as in the ITT models. Also, we examined whether duration of residence (≤ 1 year vs. > 1 year) impacted estimates of MTO treatment effects on self-reported neighborhood assessments. However, adjusting for duration of residence produced MTO treatment effect estimates that were qualitatively very similar (eTable 8A), and thus duration of residence does not explain the effect size differences between structural and subjective neighborhood reports.
Summary of city comparisons
Table 4 summarizes mean treatment effects across the different sources of neighborhood characteristics for MTO 1997 locations. Los Angeles consistently had the largest treatment effect estimates, followed by New York, Baltimore, Chicago, and Boston. Los Angeles and New York had generally the largest treatment effects, despite low vacancy rates. Low poverty treatment effects were larger than Section 8 treatment effects. (Note: we did not include perceived MTO self-reports in this table because statistical tests reveals similar treatment effects across sites and self-reports pertain to MTO 2002locations).
Discussion
In this study, we find that the Moving to Opportunity program produced positive changes in housing and neighborhood conditions—particularly improvements in housing unit quality, as well as on neighborhood economic conditions, collective efficacy and its related scales, perceived safety, violent crime, and signs of neighborhood disorder. Improvements in neighborhood environment are most evident when measuring neighborhood environment from administrative data compared to self-reports, which suggests there were larger improvements in objective neighborhood conditions than in those perceived by the MTO families.
Compared to controls, the low-poverty group experienced larger neighborhood improvements than the Section 8 group, as measured by external administrative, census data, as well as by neighborhood surveys on collective efficacy in Chicago and New York. However, the two voucher groups did not differ in terms of most neighborhood characteristics measured via MTO participant self-reports.
Randomization was implemented separately at each MTO site, and this allowed the examination of experimental treatment effects at each MTO site (i.e., internally valid effect estimates free from the bias of confounding). However, randomization does not eliminate concerns of external validity—namely variation in effect estimates by person, place, and time (Shadish, Cook, & Campbell, 2002). Thus, even though MTO was a randomized controlled trial, experimental treatment effects could vary across sites given heterogeneity in participant and place characteristics across sites. In this study we found the differences in gains in neighborhood quality between the low-poverty and Section 8 groups differed across cities; they were most pronounced in Los Angeles and New York City compared to the other cities, which suggests that differences across cities in housing markets, or in barriers such as housing discrimination, may moderate the effect of mobility programs on neighborhood quality. Los Angeles and New York achieved larger MTO treatment effects despite the low vacancy and lower availability of low poverty census tracts. However, these two cities also had lower separation between whites and blacks in the neighborhood poverty distribution, and the control group in these two cities was least affected by HOPE VI demolition of public housing.
Study findings in context
Our results suggest that both the regular Section 8 program and housing mobility programs (i.e., which often restrict voucher users to higher opportunity neighborhoods and provide housing search counseling) can have positive and wide-ranging impacts on the residential environments of low-income families. A neighborhood with less than 10% of families in poverty was the locational metric used to improve neighborhood quality in MTO, and neighborhood poverty is positively correlated with other indicators of neighborhood quality, such as recreational facilities and health care access, and negatively correlated with indicators of neighborhood problems, such as disorder and violent crime (Durant et al. 2012, Yen and Kaplan 1998, Ross 2000). However the strength of these associations varies across indicators, and likely varies across different metro areas as well (Acevedo-Garcia et al. 2016).
Yet even though both the low poverty and Section 8 groups saw gains in neighborhood quality vs. controls, the low-poverty target helped achieve a variety of other positive locational outcomes to a larger extent than the regular Section 8 program. This has direct policy relevance for two reasons. First, compared to the regular section 8 program, housing mobility appears to promote better locational outcomes in terms of both a larger number of markers of neighborhood quality, as well as larger improvements in neighborhood environment (effect sizes). Second, as mobility and other housing assistance programs grapple with defining neighborhood opportunity for program implementation, it is important to recognize that the relatively narrow target of low-poverty helps achieve broader neighborhood quality, across many different metrics.
Observed effect sizes on neighborhood environment for the low-poverty group were larger than those of the Section 8 group, although a large proportion of the low-poverty group did not lease up (Shroder 2001); the low poverty treatment group had a lease-up rate of 48%, while the Section 8 treatment group had a lease-up rate of 59%, for a 52% lease-up rate overall. The lower lease-up rates in the low-poverty group compared to the Section 8 group indicate housing counseling was not enough to offset the locational restrictions of the program rules, and facilitate successful moves for families to low poverty neighborhoods. Mobility programs could potentially have larger positive effects on neighborhood outcomes, if barriers to leasing up in low-poverty neighborhoods were removed. Such barriers include poor access to updated information on available rental units, housing discrimination against voucher holders, limited portability of housing vouchers across different housing agencies' service areas, and transportation issues including lack of an automobile (Galvez 2010, Shroder 2002, Sard and Rice 2015).
Across the range of data sources we examined, self-reports on neighborhood conditions displayed substantially smaller treatment effects and also less site variation than administrative data. One possible reason is that self-reported neighborhood assessments may tap into different aspects of the residential environment (e.g., interpersonal relations and personal experiences) rather than structural attributes (e.g., poverty rate). Importantly, both subjective and objective neighborhood assessments have been shown to affect individual outcomes (Burdette and Hill 2008, Hill and Angel 2005, Cubbin et al. 2006). Therefore, it is not appropriate to conclude that improvements in objective indicators of neighborhood environment are better than improvements in subjective assessments, or the other way around. Data on structural attributes can help inform us about neighborhood resources, opportunity structures, and stressors. Alternatively, subjective assessments may reflect social interaction among residents, usage of community facilities, and perceived problems.
Similarities and differences among the five MTO sites
Across the five MTO sites, the majority of those who leased up in the voucher treatment groups moved to the outer ring of the central city (over two-thirds) or inner suburbs (Briggs, Comey, and Weismann 2010). Counterintuitively, in our study, average effects on violent crime rates and other objective neighborhood quality indicators for the low-poverty group were larger in LA and New York, despite a tighter housing market, i.e., a backdrop of possibly more limited housing options, than in the other sites. But it could be that the control group was even more constrained in their housing choices, than the voucher groups. For example, since the HOPE VI program did not demolish public housing in New York as it did in the other cities (Orr et al. 2003), the public housing control group may not have improved their neighborhood context over time as much as it did in the other cities, so the contrast between treatment and controls was larger.
Our city-specific analyses with external data demonstrated that on most indicators, the low poverty treatment groups achieved higher quality neighborhoods than the control group for Los Angeles, New York, and Baltimore. Yet our analyses also yielded some unanticipated results. For instance, in Baltimore, the low-poverty group lived in neighborhoods with more reports of abandoned vehicles. However, given that much of the administrative data is generated by incident reports of residents, these reverse findings may be due to residents in lower poverty areas being more aggressive about reporting neighborhood issues to authorities than residents in higher poverty areas (Sampson, Morenoff, and Gannon-Rowley 2002, Kawachi 1999). When incidents are serious and against the law, incident-based measures are less likely to exhibit this sort of reporting bias, e.g., violent crime rates, as opposed to reporting of nuisance incidents (e.g., noise). Similarly, in Boston, the low-poverty group lived in neighborhoods with fewer youth programs/facilities and a higher proportion of children with elevated lead levels than the control group. However, this is not unexpected as youth programs and other services for low-income families are more likely to be located in the most disadvantaged neighborhoods, in order to target services to clients in need. Previous research has found that low-income neighborhoods have more social service capacity compared to higher income neighborhoods—particularly in cities with strong economic conditions (Macintyre, Macdonald, and Ellaway 2008). Additionally, administrators of public housing, which is more prevalent in high-poverty are as, may be more vigilant about removing lead from their buildings than landlords in the private housing market (Clark et al. 1985).
Policy Considerations
Policymakers and researchers are increasingly recognizing that improving the neighborhood outcomes of recipients of rental housing subsidies should be a central goal of housing assistance for low-income households. However, while the research evidence on neighborhood effects has grown stronger, including the studies based on MTO, funding for specific program components to enhance neighborhood outcomes under Section 8/HCV remains limited. There are many suggestions to improve the Section 8/HCV program to allow families to move to better neighborhoods, including lengthening the amount of time families are given to find a housing unit, providing families with information about housing units located in high opportunity neighborhoods or about neighborhood features of potential units, allowing for small area rent payment standards (instead of the average for the metropolitan area) to improve the affordability of units in better quality neighborhoods, increasing the portability of housing vouchers across jurisdictions, expanding recruitment of landlords in higher opportunity areas, strengthening private market incentives for the construction of affordable rental units in high opportunity neighborhoods, offering community orientations and tours, and, lastly, providing wrap around support services to encourage and sustain moves to high opportunity neighborhoods(Scott et al. 2013). In reality, though, there are only a limited number of housing mobility programs in the country, and local housing authorities are not accountable or rewarded for improving neighborhood outcomes for families in the regular Housing Choice Voucher program (DeLuca, Garboden, and Rosenblatt 2012). Although HUD is experimenting with approaches such as small area payment standards, these demonstrations remain small and inadequately funded (Kahn and Newton 2013). Similarly, HUD has recently improved its data systems to include a large database of neighborhood and regional indicators for use by its grantees to promote fair housing opportunities (U.S. Department of Housing and Urban Development 2013). However, performance evaluation of housing authorities around the HCV program is not tied to these neighborhood indicators (DeLuca, Garboden, and Rosenblatt 2012).
The MTO study shows encouraging results as families in both the low-poverty group and the regular Section 8 group were able to move to better neighborhoods, not only in terms of the neighborhood poverty rate, but for a wide range of neighborhood indicators. This study also highlights the importance of data and population-based estimates at small geographical units. Increased availability, data sharing, and promoting the use of these datasets will both enable greater understanding of the impacts of place on other quality of life outcomes, such as health, and facilitate implementation of housing mobility programs.
However, our study also shows that families faced significant barriers in making moves to better neighborhoods. Some of these barriers have to do with the vulnerability of some low-income families living in severely distressed housing and neighborhoods at baseline. For example, at baseline 72% of MTO adults were not working, 42% of MTO households reported that a household member had been a victim of violent crime in the preceding 6 months, and 16% reported that a household member had a physical or mental health problem that kept them from doing normal daily activities (Orr et al. 2003). These vulnerable families may need support and wrap-around services to be able to use a housing voucher to lease up in a low-poverty neighborhood (Osypuk, Schmidt, et al. 2012, Osypuk, Tchetgen, Acevedo-Garcia, and et al. 2012). In addition to family level barriers to mobility, there were housing market barriers. The severe lack of affordable rental housing, particularly in low-poverty neighborhoods, limits housing choices of low-income families. Nationally, between 1993 and 2003, there was a 1.2 million decrease in the number of low-rent housing units costing about $400 a month (Joint Center for Housing Studies 2006), and as noted, some MTO cities had extremely tight housing markets with low vacancy rates. In such cities, there may be greater need for housing agencies to conduct housing searches for families, and to work with landlords to ensure that housing units remain affordable and in compliant with program regulations (Briggs, Comey, and Weismann 2010).
Continuing housing counseling and search services beyond the first move can help ensure that families who move again have assistance in locating, and remaining in, high quality housing units and neighborhoods (The Urban Institute and Poverty & Race Research Action Council 2013). Our results also suggest that post-move services may be needed to assist families with social integration into their new neighborhoods, given that we did not find treatment effects among MTO families for better social integration with new neighbors as hypothesized. That is, although MTO participants in the treatment group appeared to move to neighborhoods with substantially higher levels of collective efficacy than control members (as operationalized in population-based neighborhood surveys), MTO treatment members themselves did not self-report higher levels of social trust and social connectedness with their neighbors. Increasing social integration could be accomplished through supporting community events, education opportunities, career development, and life skills training (Gibson et al. 2011) for new arrivals that promote economic integration and community interaction. For instance, Chicago's Housing Choice Partners program provides post-move support services for voucher users via workshops on a variety of topics, including on locating quality schools and actively engaging with their new communities (Berdahl-Baldwin 2015). Moreover, partnering with community service organizations will increase local capacity for multisector networks and the implementation of integration plans (The White House Task Force on New Americans 2015). Housing mobility staff may also assist with introductions between new residents and neighborhood associations, school and church groups to help build a peer support group and increase knowledge of resources (Scott et al. 2013).
Structural constraints faced by Section 8 voucher holders
In MTO, while the intervention reduced exposure to neighborhood poverty, most families in the treatment group still lived in predominantly minority neighborhoods (Orr et al. 2003, Clampet-Lundquist and Massey 2008). Race/ethnicity has been found to impact locational outcomes, with Black or Hispanic Section 8/HCVfamilies being more likely to reside in areas of concentrated poverty compared to their white counterparts (Devine et al. 2003). Therefore, addressing structural constraints faced by low-income families, including discrimination based upon race, income source (e.g., use of housing vouchers), and presence of children (Briggs, Comey, and Weismann 2010) continues to be of critical importance. Although we did not explicitly test racial differences in families' locational attainment in this study, such analysis is important to evaluate equity and fair housing goals of the Section 8 program (Joshi et al. 2014).
Study strengths and limitations
This study utilized an unprecedented multitude of data sources to comprehensively assess changes in neighborhood and housing characteristics that MTO participants experienced. Data were gathered from local and national sources, as well as from public-use and restricted-access datasets. The types of neighborhood data available for each city differed, although we attempted to gather information on four domains: economic conditions, physical environment, social systems, and health outcomes. The result was a rich patchwork of data that allowed for the investigation of how a large-scale mobility program across five metropolitan cities affected the residential environment of participants. We leveraged the MTO's experimental design, which is the gold standard for understanding whether a policy or program, in this case Section 8/Housing Choice Vouchers, can cause an improvement in an outcome of interest, in this case neighborhood environment. We were able to unpack the “opportunity bundle” associated with residence in low-poverty neighborhoods and thus better understand the dimensions of neighborhood environment that can be improved through the regular Section 8 program compared to a housing mobility program. We showed that both Section 8 and constrained choice to a low-poverty neighborhood often embedded within mobility programs caused an improvement in multiple dimensions of the neighborhood environment and housing quality compared to remaining in public housing, and that, in general, the low-poverty mobility program had stronger effects than Section 8.
Despite the strong experimental design of MTO, this study has some limitations. With the exception of census data, neighborhood boundaries for the different MTO cities differed in size which can impact conclusions drawn. As an example, neighborhood unit definitions differed across the three community surveys, with the city divided into 16 neighborhoods in Boston, 343in Chicago, and 59 in New York City. Therefore, some of the site differences (for the community survey data and city-specific analyses) may be due to the variation in neighborhood size and scale. Notably, each community survey derived its neighborhood units by combining contiguous areas similar in demographics and/or socioeconomic status, or through a resident consultative process such that defined neighborhood units have social and political relevance (Azrael et al. 2009, Molnar et al. 2003, Galea et al. 2005). Additionally, different neighborhood indicators could utilize different neighborhood boundaries. This reflects the multitude of neighborhood data sources from government, community organizations, and institutions that we leverage in our analysis.
An additional limitation is that not all neighborhood data were measured at the same time point, although they are typically from 1997-2002 time frame. Nonetheless, the relatively small time gap between different neighborhood data sources limits the degree of measurement error. Utilizing covariate-adjusted multilevel regression, Schmidt and colleagues found no statistical evidence of significant change in neighborhood-level collective efficacy for families across three time points measured from 2006-2010 (Schmidt, Tchetgen Tchetgen, et al. 2014). Using two waves of data (1995 and 2002), Sampson (2012) also found stability in not only collective efficacy, but also the structural factors that are thought to produce changes in social processes over time (Sampson 2012). These two studies were conducted in two of the MTO study sites (Boston and Chicago), giving us increased confidence that we are capturing relatively stable social processes.
Although comprehensive, this list does not, of course, encompass all possible features of neighborhoods that may be important for residents' quality of life; for example, we did not model data on school quality, political power of residents, public transportation, or air pollution. Also, with the exception of national data sources on census tract composition and business patterns, we utilized statistical techniques to extrapolate neighborhood data for MTO families who moved outside city boundaries, in order to preserve all observations in an intention to treat analysis, which is the gold standard analytic approach for internal validity within an experimental design.
Another limitation of the analyses is that we examined neighborhood changes induced by MTO only at 1997 and 2002 locations (4-7 years after random assignment) rather than implementing longitudinal analyses. We were largely constrained by data availability, to model longitudinal trajectories, including the availability of longitudinal neighborhood data for the five MTO cities and the lack of comparable measures across geographies. The only neighborhood variables that were available at multiple time points consistently across the five MTO cities were census tract characteristics; as such we linked the Census data to the earliest and latest post-random assignment addresses and found similar results, although the earlier 1997 addresses generated about 30% larger effect sizes than 2002 addresses. This aligns with previous research suggesting that the greater improvement in economic quality of neighborhoods occurred at the first move post-randomization for treatment versus control families (Orr et al. 2003, Turner et al. 2011). This treatment-control difference diminished across time, not only because some treatment group families moved to worse-quality neighborhoods, but also because control group families were displaced by HOPE VI demolition (Orr et al. 2003). Although the MTO long-term evaluation (10-15 years later) has been completed, its data has only recently been made available to external investigators. It will be important to evaluate whether the wider array of neighborhood improvements experienced by MTO families, as we present here, were sustained over the long-term.
Conclusion
Utilizing a myriad of rich and complementary data sources—including participants' self-reports, interviewer observations, publicly available administrative data from city agencies and national sources as well as restricted-access neighborhood surveys—this study documents that the Moving to Opportunity program produced beneficial and broad effects on the neighborhood environment for voucher group participants compared to controls. In particular, we find substantial improvements in economic conditions, collective efficacy, perceived safety, violent crime, and signs of neighborhood disorder for MTO treatment members. Our findings underscore that the Section 8/HCV program has the potential to improve neighborhood environment even further if it were supplemented by housing mobility components, reinforcing that improving neighborhood environment and access to high opportunity areas is an important policy goal of rental housing assistance policy.
Supplementary Material
Acknowledgments
This work was supported by NIH grants R01MD006064 and R21HD066312 (Dr. Osypuk, PI), and 5K01ES025433 (Dr. Nguyen, PI). Dr. Osypuk was additionally supported by NIH grant R24HD041023. We thank Dr. Joanna Almeida for her analytic work to construct some of the variables in this manuscript.
References
- Acevedo-Garcia Dolores, McArdle Nancy, Hardy Erin, Dillman Keri Nicole, Reece Jason, Crisan Unda Ioana, Norris David, Osypuk Theresa L. Neighborhood Opportunity and Location Affordability for Low-Income Renter Families. Housing Policy Debate. 2016;26(4-5):607–645. doi: 10.1080/10511482.2016.1198410. [DOI] [PMC free article] [PubMed] [Google Scholar]
- Ahern Jennifer, Galea Sandro. Collective Efficacy and Major Depression in Urban Neighborhoods. American Journal of Epidemiology. 2011;173(12):1453–1462. doi: 10.1093/aje/kwr030. [DOI] [PMC free article] [PubMed] [Google Scholar]
- Aneshensel CS, Sucoff CA. The neighborhood context of adolescent mental health. J Health Soc Behav. 1996;37:293–310. [PubMed] [Google Scholar]
- Azrael Deborah, Johnson Renee M, Molnar Beth E, Vriniotis Mary, Dunn Erin C, Duncan Dustin T, Hemenway David. Creating a Youth Violence Data System for Boston, Massachusetts. Australian & New Zealand Journal of Criminology. 2009;42(3):406–421. doi: 10.1375/acri.42.3.406. [DOI] [Google Scholar]
- Berdahl-Baldwin Audrey. Housing Mobility Programs in the US 2015. Sixth National Conference on Housing Mobility; Chicago. 2015. [Google Scholar]
- Briggs Xavier de Souza, Comey Jennifer, Weismann Gretchen. Struggling to stay out of high-poverty neighborhoods: housing choice and locations in moving to opportunity's first decade. Housing Policy Debate. 2010;20(3):383–427. doi: 10.1080/10511481003788745. [DOI] [Google Scholar]
- Burdette AM, Hill TD. An examination of processes linking perceived neighborhood disorder and obesity. Social Science & Medicine. 2008;67:38–46. doi: 10.1016/j.socscimed.2008.03.029. [DOI] [PubMed] [Google Scholar]
- Carrillo Laura, Pattillo Mary, Hardy Erin, Acevedo-Garcia Dolores. Housing Decisions Among Low-Income Hispanic Households in Chicago. Cityscape. 2016;18(2):109. [Google Scholar]
- Chetty Raj, Hendren Nathaniel, Katz Lawrence F. The Effects of Exposure to Better Neighborhoods on Children: New Evidence from the Moving to Opportunity Experiment. Cambridge, MA: Harvard University and NBER; 2015. [DOI] [PubMed] [Google Scholar]
- Clampet-Lundquist Susan, Massey Douglas S. Neighborhood Effects on Economic Self-Sufficiency: A Reconsideration of the Moving to Opportunity Experiment. American Journal of Sociology. 2008;114(1):107–143. [Google Scholar]
- Clark CS, Bornschein RL, Succop P, Que Hee SS, Hammond PB, Peace B. Condition and type of housing as an indicator of potential environmental lead exposure and pediatric blood lead levels. Environmental Research. 1985;38(1):46–53. doi: 10.1016/0013-9351(85)90071-4. doi: http://dx.doi.org/10.1016/0013-9351(85)90071-4. [DOI] [PubMed] [Google Scholar]
- Clark William AV. Residential preferences and neighborhood racial segregation: A test of the Schelling segregation model. Demography. 1991;28(1):1–19. [PubMed] [Google Scholar]
- Cleveland H Harrington, Crosnoe Robert. Individual Variation and Family-Community Ties: A Behavioral Genetic Analysis of the Intergenerational Closure in the Lives of Adolescents. Journal of Adolescent Research. 2004;19(2):174–191. doi: 10.1177/0743558403258268. [DOI] [Google Scholar]
- Coley Rebekah Levine, Lindsay Chase-Lansdale P. Adolescent pregnancy and parenthood: Recent evidence and future directions. American Psychologist. 1998;53(2):152–166. doi: 10.1037//0003-066x.53.2.152. [DOI] [PubMed] [Google Scholar]
- Cubbin Catherine, Sundquist Kristina, Ahlen Helena, Johansson Sven Erik, Winkleby Marilyn A, Sundquist Jan. Neighborhood deprivation and cardiovascular disease risk factors: protective and harmful effects. Scandinavian Journal of Public Health. 2006;34:228–37. doi: 10.1080/14034940500327935. [DOI] [PubMed] [Google Scholar]
- Curtis Lori J, Dooley Martin D, Phipps Shelley A. Child well-being and neighbourhood quality: evidence from the Canadian National Longitudinal Survey of Children and Youth. Social Science & Medicine. 2004;58(10):1917–1927. doi: 10.1016/j.socscimed.2003.08.007. doi: http://dx.doi.org/10.1016/j.socscimed.2003.08.007. [DOI] [PubMed] [Google Scholar]
- de Souza Briggs Xavier., editor. The Geography of Opportunity: Race and Housing Choice in Metropolitan America. Brookings Institution Press; 2006. [Google Scholar]
- DeLuca Stefanie, Dayton Elizabeth. Switching Social Contexts: The Effects of Housing Mobility and School Choice Programs on Youth Outcomes. Annual Review of Sociology. 2009;35:457–491. [Google Scholar]
- DeLuca Stefanie, Duncan Greg, Mendenhall Ruby, Keels Micere. The Notable and the Null: Using Mixed Methods to Understand the Diverse Impacts of Residential Mobility Programs. In: Van Ham Maarten, Manley David, Bailey Nick, Simpson Ludi, Maclennan Duncan., editors. Neighborhood Effects Research: New Perspectives. Dordrecht: Springer; 2012. pp. 195–223. [Google Scholar]
- DeLuca Stefanie, Garboden Philip ME, Rosenblatt Peter. Why Don't Vouchers Do a Better Job of Deconcentrating Poverty? Insights from Fieldwork with Poor Families. Poverty & Race. 2012 Sep-Oct; 2012. [Google Scholar]
- Devine Deborah J, Gray Robert W, Rubin Lester, Tahiti Lydia B. Housing Choice Voucher Location Patterns: Implications for Participant and Neighborhood Welfare. Washington, DC: Office of Policy Development and Research, U.S. Department of Housing and Urban Development; 2003. [Google Scholar]
- Durant RW, Parmar G, Shuaib F, Le A, Brown TM, Roth DL, Hovater M, Halanych JH, Shikany JM, Prineas RJ, Samdarshi TJ, Safford MM. Awareness and management of chronic disease, insurance status, and health professional shortage areas in the REasons for Geographic And Racial Differences in Stroke (REGARDS): a cross-sectional study. BMC Health Services Research. 2012;12(208) doi: 10.1186/1472-6963-12-208. [DOI] [PMC free article] [PubMed] [Google Scholar]
- Ellen Ingrid Gould. Sharing America's neighborhoods. Cambridge, MA: Harvard University Press; 2000. [Google Scholar]
- Feins Judith D. A Cross-Site Analysisof MTO's Locational Impacts. In: Goering John, Feins Judith D., editors. Choosing a Better Life? Evaluating the Moving to Opportunity Social Experiment. Washington, DC: The Urban Institute Press; 2003. [Google Scholar]
- Feins Judith D, McInnis Debra, Popkin Susan. Counseling in the Moving to Opportunity Demonstration Program: HC-5953 Task Order 3. Washington, DC: U.S. Department of Housing and Urban Development; 1997. [Google Scholar]
- Fortson Jane G, Sanbonmatsu Lisa. Child Health and Neighborhood Conditions: Results from a Randomized Housing Voucher Program. Journal of Human Resources. 2010;45(4):840–864. [Google Scholar]
- Galea Sandro, Ahern Jennifer, Rudenstine Sasha, Wallace Zachary, Vlahov David. Urban built environment and depression: a multilevel analysis. Journal of Epidemiology and Community Health. 2005;59(10):822–827. doi: 10.1136/jech.2005.033084. [DOI] [PMC free article] [PubMed] [Google Scholar]
- Galster George. An Economic Efficiency Analysis of Deconcentrating Poverty Populations. Journal of Housing Economics. 2002;11:303–29. [Google Scholar]
- Galster George C, Killen Sean P. The geography of metropolitan opportunity: A reconnaissance and conceptual framework. Housing Policy Debate. 1995;6(1):7–43. [Google Scholar]
- Galvez Martha M. A review of recent literature. Washington, DC: The Urban Institute; 2010. What do we know about housing choice voucher program location outcomes. [Google Scholar]
- Gary Tiffany L, Stark Sarah A, Laveist Thomas A. Neighborhood characteristics and mental health among African Americans and whites living in a racially integrated urban community. Health & Place. 2007;13(2):569–575. doi: 10.1016/j.healthplace.2006.06.001. [DOI] [PubMed] [Google Scholar]
- Gibson Robert W, D'Amico Mariana, Jaffe Lynn, Arbesman Marian. Occupational Therapy Interventions for Recovery in the Areas of Community Integration and Normative Life Roles for Adults With Serious Mental Illness: A Systematic Review. American Journal of Occupational Therapy. 2011;65(3):247–256. doi: 10.5014/ajot.2011.001297. [DOI] [PubMed] [Google Scholar]
- Goering John, Kraft Joan, Feins Judith, McInnis Debra, Holin Mary Joel, Elhassan Huda. Moving to Opportunity for Fair Housing Demonstration Program: Current Status and Initial Findings. Washington, DC: US Department of Housing & Urban Development, Office of Policy Development and Research; 1999. [Google Scholar]
- Harding David J. Counterfactual Models of Neighborhood Effects: The Effect of Neighborhood Poverty on Dropping Out and Teenage Pregnancy. American Journal of Sociology. 2003;109(3):676–719. [Google Scholar]
- Hill Terrence D, Angel Ronald J. Neighborhood disorder, psychological distress, and heavy drinking. Social Science & Medicine. 2005;61(5):965–975. doi: 10.1016/j.socscimed.2004.12.027. [DOI] [PubMed] [Google Scholar]
- Joint Center for Housing Studies. America's rental housing: Homes for a diverse nation. Cambridge, MA: Harvard University; 2006. [Google Scholar]
- Joshi Pamela K, Geronimo Kimberly, Romano Bethany, Earle Alison, Rosenfeld Lindsay, Hardy Erin F, Acevedo-Garcia Dolores. Integrating Racial/Ethnic Equity Into Policy Assessments To Improve Child Health. Health Affairs. 2014;33(12):2222–2229. doi: 10.1377/hlthaff.2014.1169. [DOI] [PubMed] [Google Scholar]
- Kahn Peter B, Newton Geoffrey B. Policy Brief: The Small Area FMR Demonstration. Cityscape: A Journal of Policy Development and Research. 2013;15(1):325–328. [Google Scholar]
- Kawachi Ichiro. Social Capital and Community Effects on Population and Individual Health. Annals of the New York Academy of Sciences. 1999;896(1):120–130. doi: 10.1111/j.1749-6632.1999.tb08110.x. [DOI] [PubMed] [Google Scholar]
- Kawachi Ichiro, Berkman Lisa F., editors. Neighborhoods and Health. New York: Oxford University Press; 2003. [Google Scholar]
- Kingsley G Thomas, Pettit Kathryn LS. Metropolitan Housing and Communities Center. Washington, DC: Urban Institute; 2008. Have MTO families lost access to opportunity neighborhoods over time? [Google Scholar]
- Kling Jeffrey R, Liebman Jeffrey B, Katz Lawrence F. Experimental analysis of neighborhood effects. Econometrica. 2007;75(1):83–119. [Google Scholar]
- Krysan Maria, Crowder Kyle, Bader Michael DM. Pathways to residential segregation. In: Lareau Annette, Goyette Kimberly., editors. Choosing homes, choosing schools. New York: Russell Sage Foundation Press; 2014. pp. 27–63. [Google Scholar]
- Leventhal Tama, Brooks-Gunn Jeanne. Moving to Opportunity: an Experimental Study of Neighborhood Effects on Mental Health. American Journal of Public Health. 2003;93(9):1576–1582. doi: 10.2105/ajph.93.9.1576. [DOI] [PMC free article] [PubMed] [Google Scholar]
- Leventhal Tama, Dupéré Véronique, Brooks - Gunn Jeanne. Chapter 12: Neighborhood Influences on Adolescent Development. In: Lerner Richard M, Steinberg Laurence., editors. Handbook of Adolescent Psychology, Volume 2, Contextual Influences on Adolescent Development. 3rd. Hoboken, NJ: Wiley; 2009. pp. 411–443. [Google Scholar]
- Logan John R, Molotch Harvey. Urban Fortunes: The Political Economy of Place. Univ of California Press; 2007. [Google Scholar]
- Ludwig Jens, Duncan Greg J, Gennetian Lisa A, Katz Lawrence F, Kessler Ronald C, Kling Jeffrey R, Sanbonmatsu Lisa. Neighborhood effects on the long-term well-being of low-income adults. Science. 2012;337(6101):1505–1510. doi: 10.1126/science.1224648. [DOI] [PMC free article] [PubMed] [Google Scholar]
- Ludwig Jens, Sanbonmatsu Lisa, Gennetian Lisa, Adam Emma, Duncan Greg J, Katz Lawrence F, Kessler Ronald C, Kling Jeffrey R, Lindau Stacy Tessler, Whitaker Robert C, McDade Thomas W. Neighborhoods, Obesity, and Diabetes--A Randomized Social Experiment. New England Journal of Medicine. 2011;365(16):1509–1519. doi: 10.1056/NEJMsa1103216. [DOI] [PMC free article] [PubMed] [Google Scholar]
- Macintyre Sally, Macdonald Laura, Ellaway Anne. Do poorer people have poorer access to local resources and facilities? The distribution of local resources by area deprivation in Glasgow, Scotland. Social Science & Medicine. 2008;67(6):900–914. doi: 10.1016/j.socscimed.2008.05.029. doi: http://dx.doi.org/10.1016/j.socscimed.2008.05.029. [DOI] [PMC free article] [PubMed] [Google Scholar]
- Mair C, Roux Ana V Diez, Galea S. Are neighbourhood characteristics associated with depressive symptoms? A review of evidence. Journal of Epidemiology and Community Health. 2008;62(11):940–946. doi: 10.1136/jech.2007.066605. [DOI] [PubMed] [Google Scholar]
- Massey Douglas S, Denton Nancy A. American Apartheid: Segregation and the Making of the Underclass. Cambridge, MA: Harvard University Press; 1993. [Google Scholar]
- Moberg David. No Vacancy! Denial, Fear and the Rumor Mill Waged a War Against Moving to Opportunity in Baltimore's Suburbs. Shelterforce Online. 1995;(79) [Google Scholar]
- Molnar Beth E, Buka Stephen L, Brennan Robert T, Holton John K, Earls Felton. A Multilevel Study of Neighborhoods and Parent-to-Child Physical Aggression: Results From the Project on Human Development in Chicago Neighborhoods. Child Maltreatment. 2003;8(2):84–97. doi: 10.1177/1077559502250822. [DOI] [PubMed] [Google Scholar]
- Mujahid Mahasin S, Diez Roux Ana V, Morenoff Jeffrey D, Raghunathan Trivellore. Assessing the Measurement Properties of Neighborhood Scales: From Psychometrics to Ecometrics. American Journal of Epidemiology. 2007;165(8):858–867. doi: 10.1093/aje/kwm040. [DOI] [PubMed] [Google Scholar]
- National Low Income Housing Coalition. Federal Budget & Approps, HUD Budget Charts, FY13 Budget Chart for Selected HUD and USDA Programs. [Accessed 2/2/13];2012 Updated February 16, 2012. https://www2398.ssldomain.com/nlihc/doc/FY13_Budget_Chart.pdf.
- Newburger Harriet, Birch Eugenie L, Wachter Susan M. Neighborhood and life chances: How place matters in modern America. Philadelphia: University of Pennsylvania Press; 2011. [Google Scholar]
- Nguyen Quynh C, Schmidt Nicole M, Glymour M Maria, Rehkopf David H, Osypuk Theresa L. Were the mental health benefits of a housing mobility intervention larger for adolescents in higher socioeconomic status families? Health & Place. 2013;23:79–88. doi: 10.1016/j.healthplace.2013.05.002. [DOI] [PMC free article] [PubMed] [Google Scholar]
- Orr Larry, Feins Judith D, Jacob Robin, Beecroft Erik, Sanbonmatsu Lisa, Katz Lawrence F, Liebman Jeffrey B, Kling Jeffrey R. Moving to Opportunity for Fair Housing Demonstration Program: Interim Impacts Evaluation. Washington, DC: U.S. Department of Housing and Urban Development; 2003. [Google Scholar]
- Osypuk Theresa L, Tchetgen Tchetgen Eric J, Acevedo-Garcia Dolores, Earls Felton J, Lincoln Alisa, Schmidt Nicole M, Glymour M Maria. Differential mental health effects of neighborhood relocation among youth in vulnerable families: results from a randomized trial. Archives of general psychiatry. 2012;69(12):1284–1294. doi: 10.1001/archgenpsychiatry.2012.449. [DOI] [PMC free article] [PubMed] [Google Scholar]
- Osypuk Theresa L, Galea Sandro, McArdle Nancy, Acevedo-Garcia Dolores. Quantifying Separate and Unequal: Racial-Ethnic Distributions of Neighborhood Poverty in Metropolitan America. Urban Affairs Review. 2009;45(1):25–65. doi: 10.1177/1078087408331119. [DOI] [PMC free article] [PubMed] [Google Scholar]
- Osypuk Theresa L, Schmidt Nicole M, Bates Lisa M, Tchetgen-Tchetgen Eric J, Earls Felton J, Glymour M Maria. Gender and crime victimization modify neighborhood effects on adolescent mental health. Pediatrics. 2012;130(3):472–481. doi: 10.1542/peds.2011-2535. [DOI] [PMC free article] [PubMed] [Google Scholar]
- Osypuk Theresa L, Tchetgen Eric Tchetgen, Acevedo-Garcia Dolores, et al. Differential mental health effects of neighborhood relocation among youth in vulnerable families: Results from a randomized trial. Archives of General Psychiatry. 2012;69(12):1284–1294. doi: 10.1001/archgenpsychiatry.2012.449. [DOI] [PMC free article] [PubMed] [Google Scholar]
- Pickett KE, Pearl M. Multilevel analyses of neighbourhood socioeconomic context and health outcomes: a critical review. Journal of Epidemiology and Community Health. 2001;55(2):111–122. doi: 10.1136/jech.55.2.111. [DOI] [PMC free article] [PubMed] [Google Scholar]
- Quadel Consulting Corporation. Housing Choice Voucher Program Guidebook. Washington DC: Produced for U.S. Department of Housing and Urban Development, Office of Public and Indian Housing; 2001. Chapter 10: Housing Quality Standards; pp. 1–48. [Google Scholar]
- Ross Catherine E. Walking, exercising, and smoking: Does neighborhood matter? Social Science and Medicine. 2000;51(2):265–274. doi: 10.1016/s0277-9536(99)00451-7. [DOI] [PubMed] [Google Scholar]
- Rothman Emily F, Johnson Renee M, Young Robin, Weinberg Janice, Azrael Deborah, Molnar Beth E. Neighborhood-level factors associated with physical dating violence perpetration: Results of a representative survey conducted in Boston, MA. Journal of Urban Health. 2011;88(2):201–213. doi: 10.1007/s11524-011-9543-z. [DOI] [PMC free article] [PubMed] [Google Scholar]
- Rothman Kenneth J, Greenland Sander. Modern epidemiology. 2nd. Philadelphia: Lippincott-Raven; 1998. [Google Scholar]
- Royston Patrick, White Ian R. Multiple Imputation by Chained Equations (MICE): Implementation in Stata. Journal of Statistical Software. 2011;45(4) [Google Scholar]
- Sampson, Raudenbush Stephen W, Earls Felton. Neighborhoods and Violent Crime: A Multilevel Study of Collective Efficacy. Science. 1997a;277(5328):918–924. doi: 10.1126/science.277.5328.918. [DOI] [PubMed] [Google Scholar]
- Sampson Robert J. Great American city: Chicago and the enduring neighborhood effect. Chicago, IL: The University of Chicago Press; 2012. [Google Scholar]
- Sampson Robert J, Raudenbush Stephen W, Earls Felton. Neighborhoods and violent crime: A multilevel study of collective efficacy. Science. 1997b;227(5328):918–923. doi: 10.1126/science.277.5328.918. [DOI] [PubMed] [Google Scholar]
- Sampson Robert J, Morenoff Jeffrey D, Earls Felton. Beyond social capital: spatial dynamics of collective efficacy for children. American Sociological Review. 1999;64(5):633–660. [Google Scholar]
- Sampson Robert J, Morenoff Jeffrey D, Gannon-Rowley Thomas. Assessing “Neighborhood Effects”: Social Processes and New Directions in Research. Annual Review of Sociology. 2002;28:443–478. [Google Scholar]
- Santiago Anna Maria, Galster George C, Lucero Jessica L, Ishler Karen J, Lee Eun Lye, Kypriotakis Georgios, Stack Lisa. Opportunity Neighborhoods for Latino and African-American Children: Final Report. Washington, DC: U.S. Department of Housing and Urban Development, Office of Police Development and Research; 2014. [Google Scholar]
- Sard Barbara, Rice Douglas. Policy Futures. Washington, DC: Center on Budget and Policy Priorities; 2015. Realizing the Housing Voucher Program's Potential to Enable Families to Move to Better Neighborhoods. [Google Scholar]
- Schmidt Nicole M, Lincoln Alisa K, Nguyen Quynh C, Acevedo-Garcia Dolores, Osypuk Theresa L. Examining mediators of housing mobility on adolescent asthma: Results from a Housing Voucher Experiment. Social Science & Medicine. 2014;107:136–144. doi: 10.1016/j.socscimed.2014.02.020. doi: http://dx.doi.org/10.1016/j.socscimed.2014.02.020. [DOI] [PMC free article] [PubMed] [Google Scholar]
- Schmidt Nicole M, Tchetgen Eric J, Ehntholt Amy, Almeida Joanna, Nguyen Quynh C, Molnar Beth E, Azrael Deborah, Osypuk Theresa L. Does neighborhood collective efficacy for families change over time? The Boston Neighborhood Survey. Journal of Community Psychology. 2014;42(1):61–79. doi: 10.1002/jcop.21594. [DOI] [PMC free article] [PubMed] [Google Scholar]
- Scott Molly M, Cunningham Mary, Biess Jennifer, O'Neil Jennifer Lee, Tegeler Phil, Gayles Ebony, Sard Barbara. Expanding Choice: Practical Strategies for Building a Successful Housing Mobility Program. The Urban Institute; Poverty & Race Research Action Council; 2013. [Google Scholar]
- Sharkey Patrick. Stuck in place: urban neighborhoods and the end of progress toward racial equality. Chicago: University of Chicago Press; 2013. [Google Scholar]
- Shlay Anne B. Not in that neighborhood: The effects of population and housing on the distribution of mortgage finance within the Chicago SMSA. Social Science Research. 1988;17(2):137–163. [Google Scholar]
- Shlay Anne B, Rossi Peter H. Keeping up the neighborhood: Estimating net effects of zoning. American Sociological Review. 1981:703–719. [Google Scholar]
- Shroder Mark. Moving to opportunity: An experiment in social and geographic mobility. Cityscape. 2001:57–67. [Google Scholar]
- Shroder Mark. Locational Constraint, Housing Counseling, and Successful Lease-up in a Randomized Housing Voucher Experiment. Journal of Urban Economics. 2002;51(2):315–338. doi: http://dx.doi.org/10.1006/juec.2001.2247. [Google Scholar]
- South Scott J, Crowder Kyle D. Escaping Distressed Neighborhoods: Individual, Community, and Metropolitan Influences. American Journal of Sociology. 1997;102(4):1040–1084. [Google Scholar]
- South Scott J, Deane Glenn D. Race and Residential Mobility: Individual Determinants and Structural Constraints. Social Forces. 1993;72(1):147–167. doi: 10.2307/2580163. [DOI] [Google Scholar]
- The Urban Institute, and Poverty & Race Research Action Council. Expanding Choice: Practical Strategies for Building a Successful Housing Mobility Program. Washington, DC: 2013. [Google Scholar]
- The White House Task Force on New Americans. Strengthening Communities by Welcoming All Residents: A Federal Strategic Action Plan on Immigrant & Refugee Integration. Washington, DC: 2015. [Google Scholar]
- Turner Margery Austin, Comey Jennifer, Kuehn Daniel, Nichols Austin. Helping Poor Families Gain and Sustain Access to High-Opportunity Neighborhoods. Washington, DC: Urban Institute; 2011. [Google Scholar]
- U.S. Department of Housing and Urban Development. Expanding Housing Choices For HUD-Assisted Families: Moving to Opportunity. First Biennial Report to Congress, Moving to Opportunity for Fair Housing Demonstration Program 1996 [Google Scholar]
- U.S. Department of Housing and Urban Development. Affirmatively Furthering Fair Housing Data Documentation 2013 [Google Scholar]
- Vartanian Thomas P, Buck Page Walker, Gleason Philip. Intergenerational Neighborhood-Type Mobility: Examining Differences between Blacks and Whites. Housing Studies. 2007;22(5):833–856. doi: 10.1080/02673030701474792. [DOI] [Google Scholar]
- Verma Nandita. Staying or Leaving: Lessons from Jobs-Plus About the Mobility of Public Housing Residents and Implications for Place-Based Initiatives. Working paper, MDRC 2003 [Google Scholar]
- Waitzman Norman J, Smith Ken R. Phantom of the area: poverty-area residence and mortality in the United States. American Journal of Public Health. 1998;88(6):973–976. doi: 10.2105/ajph.88.6.973. [DOI] [PMC free article] [PubMed] [Google Scholar]
- Yen Irene H, Kaplan George A. Poverty area residence and changes in physical activity level: Evidence from the Alameda County Study. American Journal of Public Health. 1998;88(11):1709–1712. doi: 10.2105/ajph.88.11.1709. [DOI] [PMC free article] [PubMed] [Google Scholar]
- Yinger John. Closed Doors, Opportunities Lost: The Continuing Costs of Housing Discrimination. New York: Russell Sage Foundation; 1995. [Google Scholar]
Associated Data
This section collects any data citations, data availability statements, or supplementary materials included in this article.