Abstract
Purpose
A barrier to acceptance of active surveillance (AS) for men with prostate cancer (PCa) is the risk of underestimating the cancer burden upon initial biopsy. We assessed the value of endorectal magnetic resonance imaging (eMRI) in predicting upgrading on confirmatory biopsy in men with low-risk PCa.
Methods
388 consecutive men (mean age,60.6, range 33–89 years) with clinically low-risk PCa (initial biopsy Gleason score≤6, PSA<10 ng/mL, clinical stage≤T2a) underwent eMRI before confirmatory biopsy. Three radiologists independently, retrospectively scored tumor visibility on eMRI using a five-point scale (1-definitely no tumor—5-definitely tumor). Inter-reader agreement was assessed with weighted kappa statistics. Associations between MRI scores and confirmatory biopsy findings were evaluated using measures of diagnostic performance and multivariate logistic regression.
Results
On confirmatory biopsy, Gleason score was upgraded in 79/388 (20%) of patients. MRI scores ≤2 had high negative predictive value (0.96–1.0) and specificity (0.95–1.0) for upgrading on confirmatory biopsy. An MRI score of 5 was highly sensitive for upgrading on confirmatory biopsy (0.87–0.98). At multivariate analysis, patients with higher MRI scores were more likely to be upgraded on confirmatory biopsy (odds-ratios=2.16–3.97). Inter-reader agreement and diagnostic performance were higher for the more experienced readers (kappa=0.41–0.61; area under the curve [AUC]=0.76–0.79) than for the least experienced reader (kappa=0.15–0.39; AUC=0.61–0.69). MRI performed similarly in predicting low-risk and very low-risk (Gleason score 6, <3 positive cores, <50% involvement in all cores) PCa.
Conclusion
Adding eMRI to the initial clinical evaluation in men with clinically low-risk PCa helps predict findings on confirmatory biopsy and assess eligibility for AS.
Keywords: MRI, prostate cancer, active surveillance, low risk, early stage
INTRODUCTION
Early diagnosis of prostate cancer during the prostate-specific antigen (PSA) era has resulted in a downward trend in cancer stage at presentation and improved overall survival.1, 2 Nevertheless, the high rate of diagnosis of clinically low-risk, localized prostate cancer, coupled with the minimal incidence of deaths from such disease, has raised concerns about overtreatment.3, 4 In the quest to prevent overtreatment, active surveillance (AS) has emerged as a plausible option. AS has proven extremely effective, with disease-specific survival rates reported at 97–100% after 3–10 years.5–9 However, appropriate criteria for selecting patients for AS are continuously debated. In 2010, the National Comprehensive Cancer Network (NCCN) recommended the use of AS as the sole initial management strategy—not just an option—for patients with “low-risk” prostate cancer and a life expectancy <10 years, as well as for patients with “very-low-risk” prostate cancer and a life expectancy <20 years.10,11
A potential pitfall of basing AS decisions on biopsy findings lies in the fact that high-grade or large-volume tumors may be “missed” by the biopsy needle, and the resulting delays in treatment may negatively affect outcomes. Even the most stringent criteria misclassify 16–42% of patients, who, despite low-risk features on initial biopsy, have unfavorable pathologic features at radical prostatectomy.12 To improve the detection of large or high-grade cancers, some centers recommend a second (“confirmatory”) prostate biopsy before the start of AS. Berglund et al. found that up to 27% of patients with very-low-risk features on initial biopsy had their disease upgraded or upstaged at confirmatory biopsy, and that patients who had upgraded and/or upstaged disease on confirmatory biopsy were more likely to show an increase in stage and grade at radical prostatectomy than those whose did not.13
MRI, either alone or in combination with clinical parameters, may be useful for predicting insignificant prostate cancer, particularly in the context of clinically non-palpable tumors.14–16 Furthermore, on MRI, less aggressive tumor foci (i.e., those with Gleason score≤6) are more difficult to detect than are more aggressive tumors.17, 18 However, the capacity of T2-weighted MRI to predict confirmatory prostate biopsy findings has not been explored. The purpose of our study was to evaluate T2-weighted MRI as a tool for predicting pathologic upgrade on confirmatory prostate biopsy in men with clinically low-risk PCa being considered for AS.
MATERIALS AND METHODS
The institutional review board (IRB) approved our retrospective study and waived the informed consent requirement. Our study was compliant with the Health Insurance Portability and Accountability Act.
Eligibility Criteria and Patient Characteristics
Through computerized searches of our institutional database, we identified 573 patients satisfying the following inclusion criteria: (i) Gleason score ≤ 6 prostate cancer on initial transrectal prostate biopsy performed between 1 January 1999 and 30 September 2010; (ii) PSA <10 ng/mL; (iii) clinical stage ≤T2a and (iv) confirmatory prostate biopsy performed within 6 months of the initial prostate biopsy. We excluded patients with (i) no prostate MRI performed in the interval between the initial and confirmatory biopsies (173 patients); (ii) prostate MRI performed without an endorectal coil (11 patients); and (iii) MRI performed at an outside institution (1 patient). Thus, our final study population consisted of 388 patients.
MRI Acquisition
All MRI studies were performed using whole-body units (GE Medical Systems, USA). A body coil was used for excitation; a pelvic phased-array coil and an expandable endorectal coil were used for signal reception. Owing to the length of the study period (10 years), the MRI parameters varied slightly as per the standard clinical protocols in place at our institution at the time of each examination. However, all MRI studies involved the following sequences and acquisition parameters: transverse T1-weighted images (repetition time/echo time, 400–750/10 – 14 ms; section thickness, 5 mm; intersection gap, 1 mm; field of view, 28–36 cm; matrix, 256×192); transverse, coronal, and sagittal T2-weighted fast spin-echo images (repetition time/effective echo time, 3500–6000/120 ms; section thickness, 3 mm; no intersection gap; field of view, 12– 14 cm; and matrix, 256×192). MRI studies were performed at 1.5 Tesla (312 patients) and 3 Telsa (76 patients).
MRI Interpretation
Three radiologists retrospectively and independently interpreted the MRI studies, which were archived in a Picture Archiving and Communication System (Centricity; GE Medical Systems, USA). Reader 1 was a fellowship-trained body radiologist who had read only about 50 prostate MRI examinations before this study; reader 2 was a body imaging fellow with a special interest and dedicated training in prostate imaging, who had read approximately 500 prostate MRI examinations; and reader 3 was a fellowship-trained genitourinary radiologist who had interpreted more than 5000 prostate MRI examinations. Readers were aware that the patients had low-risk features on initial clinical evaluation and biopsy but were unaware of patients’ PSA levels, the number(s) or location(s) of initial positive biopsies and confirmatory biopsy findings. For each patient, each reader independently assigned a score for the presence of tumor on MRI on a 1–5 index scale (1-definitely no tumor, 2-probably no tumor, 3-indeterminate, 4-probably tumor,5-definitely tumor) using previously published criteria (Figs. 1–3).19 If a score ≥4 was assigned, the reader also recorded the number of lesions per patient, maximum diameter of the largest lesion and lesion laterality (unilateral or bilateral), as well as the likelihoods of extracapsular extension and seminal vesicle invasion (using the same 5-point scale).
Figure 1.
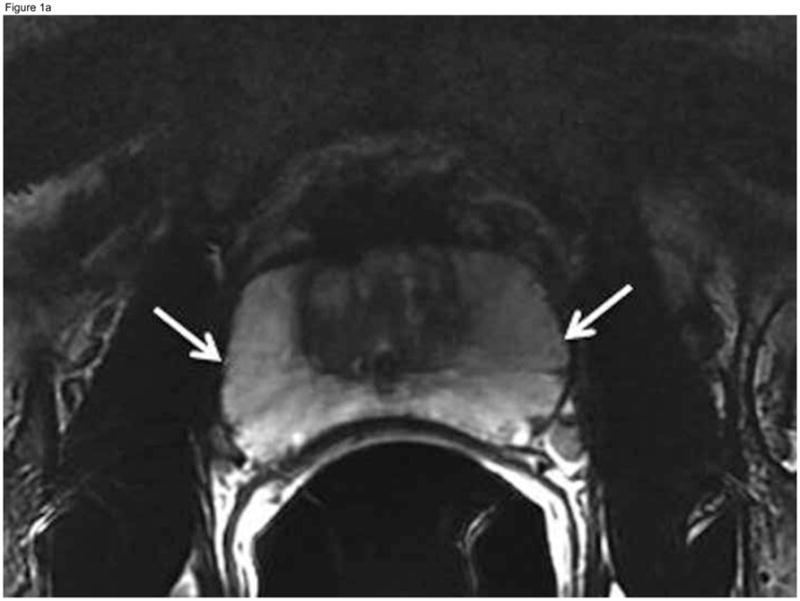
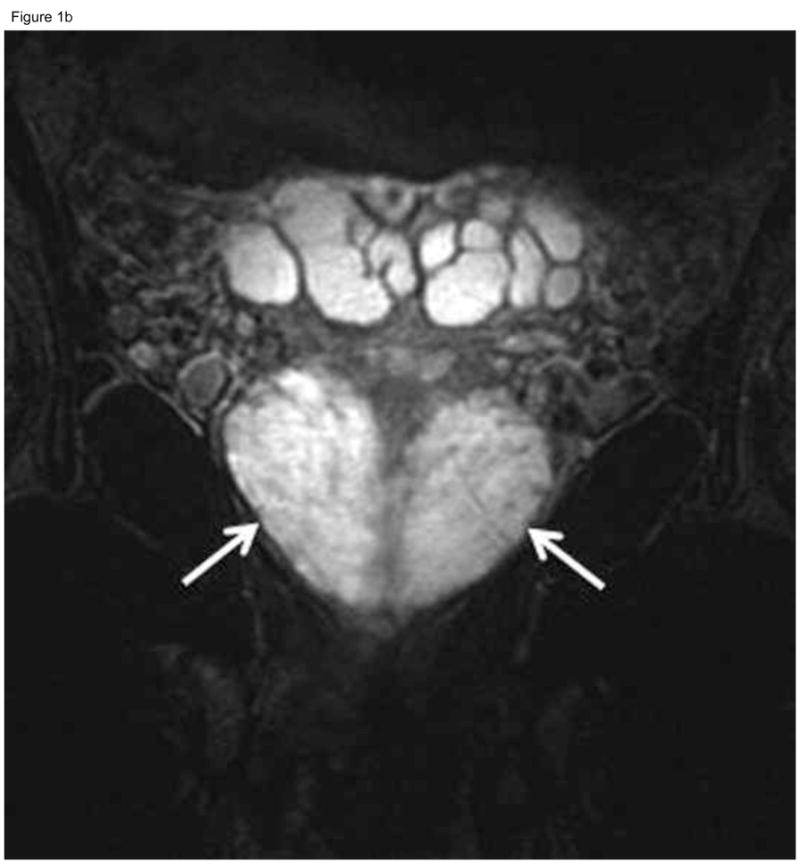
Fifty-year-old patient with prostate cancer, clinical stage T1c, PSA 4.5 ng/ml. Axial (A) and coronal (B) T2-weighted MR images demonstrate the normal high signal intensity of the peripheral zone (arrows). The study was interpreted as “probably no tumor” (MRI suspicion score=2) by all three readers. Confirmatory prostate biopsy demonstrated 2 out of 12 cores positive for cancer, 2–12% cancer involvement in each core, and Gleason score 3+3, thus fulfilling the NCCN criteria for very low-risk disease.
Figure 3.
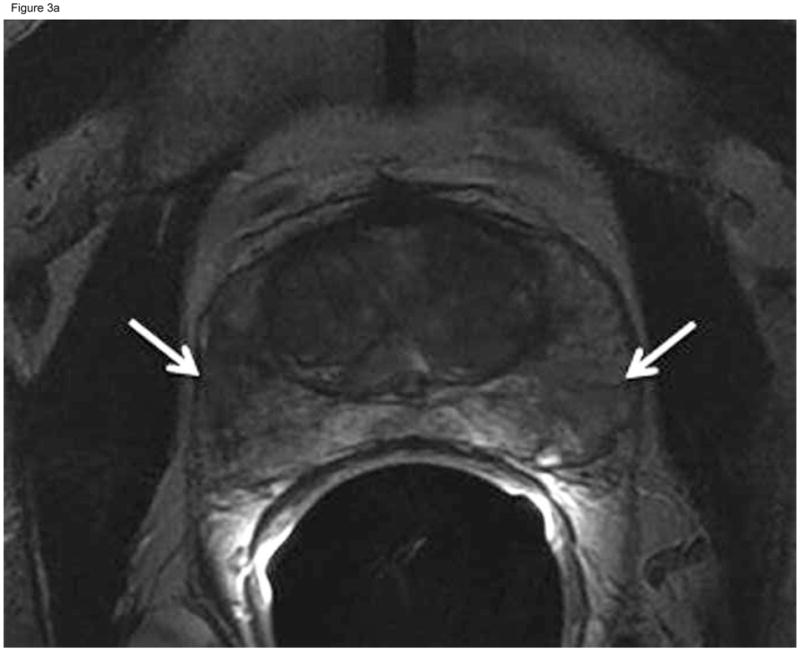
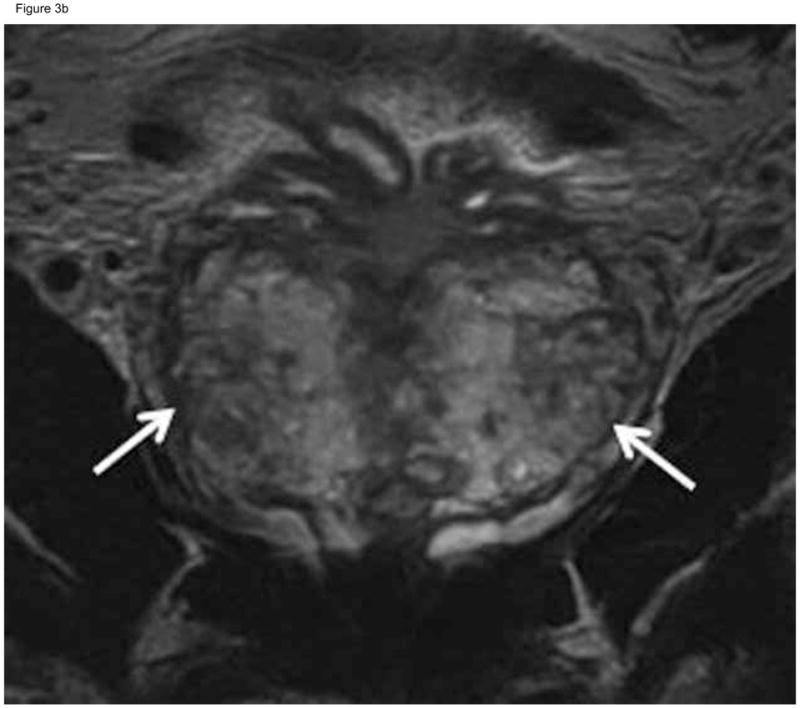
Sixty-two-year-old patient with prostate cancer, clinical stage T1c, PSA 5.8 ng/ml. Axial (A) and coronal (B) T2-weighted MRI demonstrated heterogeneous appearance of the peripheral zone with areas of decreased signal intensity interspersed amongst areas of normal high signal intensity (arrows). This was interpreted as “indeterminate” (MRI suspicion score= 3) by the two more experienced readers and “probably tumor” (MRI suspicion score=4) by the least experienced reader. Confirmatory prostate biopsy demonstrated 4 out of 12 cores positive for cancer, 10–20%cancer involvement in each core, and Gleason score 3+3.
Histopathologic Analysis and Image Correlation
For all patients, initial biopsy was performed at a referring institution, and confirmatory biopsy was performed at our institution within the following 6 months. Fifty-five patients (14%) had more than 1 prostate biopsy before confirmatory biopsy; 3/55 had >1 positive biopsy before confirmatory biopsy. The confirmatory biopsy included standard 12-core biopsy, in which samples were obtained from the medial and lateral aspects of the base, middle and apical portions of the prostate bilaterally; in addition, two biopsy samples were obtained from the transition zone, for a total of 14 cores. At the discretion of the urologist performing the procedure, samples were also obtained from suspicious lesions identified on digital rectal examination, TRUS or MRI. All biopsy specimens were reviewed at our institution by a dedicated genitourinary pathologist. In the patients who underwent radical prostatectomy within 6 months of prostate MRI, pathology findings were compared with those from confirmatory biopsy.
Reference Standards
Confirmatory prostate biopsy was used as the reference standard to identify patients for whom the National Comprehensive Cancer Network (NCCN) Prostate Cancer Guidelines recommended AS.11 The “NCCN low-risk” category included patients with no cores showing Gleason score ≥7 cancer in the confirmatory biopsy (regardless of the number of positive cores), and the “NCCN very-low risk” category included patients with no Gleason score ≥7 cancer in the confirmatory biopsy, no more than 3 cores involved by cancer, and no single core with ≥50% involvement by cancer.
Statistical Analysis
Clinical and demographic data were summarized using descriptive statistics. Inter-reader agreement was assessed using weighted-kappa statistics with Fleiss-Cohen (quadratic) weights and interpreted based on the table provided by Landis and Koch.19, 20 Measures of diagnostic accuracy for predicting confirmatory biopsy findings, including sensitivity, specificity, positive predictive value (PPV) and negative predictive value (NPV), were estimated at a per-patient level at every possible cutoff point of the 1–5 suspicion scale. Performance was also evaluated using the empirical receiver operating characteristic (ROC) and the area under the curve (AUC).
AUCs for reader performance were calculated separately for 1.5-Tesla and 3-Tesla MRI studies and for MRI studies obtained before 1 January 2007 and on or after that date (which coincided with the last major software upgrade at our institution).
Multivariate logistic regression was used to evaluate associations between MRI features and confirmatory biopsy findings using odds-ratios (OR). P values ≤0.05 were considered significant. All statistical analyses were performed with SAS 9.2 software (SAS Institute Inc., USA).
RESULTS
Pathological findings
Confirmatory biopsy findings fit the NCCN criteria for low-risk disease in 309/388 patients (80%) and the NCCN criteria for very low-risk disease in 239/388 patients (62%). In 124/388 patients (32%), no cancer was identified on confirmatory biopsy. Seventy-nine patients had their disease upgraded on confirmatory biopsy (i.e., had at least 1 core with Gleason score ≥7 cancer). Confirmatory biopsy included targeted cores of lesions detected by transrectal ultrasound, MRI or digital rectal examination in 70/388 patients (18%). Prostatectomy was done within 6 months of MRI in 129 patients (33%). In 84/129 patients (65%), prostatectomy showed higher-grade disease than did initial biopsy; for 51/84 (61%), confirmatory biopsy also showed higher-grade disease than did initial biopsy.
MRI Score
An MRI score ≤2 was associated with high NPV (0.96–1.0) for upgrading on confirmatory biopsy and high NPV (0.77–0.98) for non-very-low-risk features on confirmatory biopsy. For all readers, an MRI score of 5 was associated with high sensitivity (0.87–0.98) for upgrading on confirmatory biopsy and high sensitivity (0.88–0.99) for non-very-low-risk features on confirmatory biopsy. Table 1 summarizes measurements of diagnostic accuracy for predicting confirmatory biopsy findings at different cutoff points. AUCs did not differ significantly between 1.5-Tesla and 3-Tesla MRI studies (p=0.16–0.30) or between MRI studies obtained before 1 January 2007 and those obtained on or after that date (p=0.26–0.73).
Table 1.
Measurements of accuracy of MRI for predicting confirmatory biopsy features consistent with NCCN risk categories
| Prediction of NCCN Low-risk features on Confirmatory Biopsy* | ||||||||||
|---|---|---|---|---|---|---|---|---|---|---|
|
| ||||||||||
| Cutoff Point | Specificity | Sensitivity | PPV | NPV | AUC | |||||
|
| ||||||||||
| Value | 95%CI | Value | 95%CI | Value | 95%CI | Value | 95%CI | Value | 95%CI | |
| Reader 1 | 0.69 | 0.63, 0.75 | ||||||||
| ≤2 | 1.00 | 0.95, 1.00 | 0.06 | 0.03, 0.09 | 0.21 | 0.17, 0.26 | 1.00 | 0.81, 1.00 | ||
| ≤3 | 0.65 | 0.53, 0.75 | 0.67 | 0.61, 0.72 | 0.33 | 0.26, 0.41 | 0.88 | 0.83, 0.92 | ||
| ≤4 | 0.37 | 0.26, 0.48 | 0.87 | 0.83, 0.91 | 0.43 | 0.31, 0.55 | 0.84 | 0.80, 0.88 | ||
|
| ||||||||||
| Reader 2 | 0.79 | 0.74, 0.84 | ||||||||
| ≤2 | 1.00 | 0.95, 1.00 | 0.20 | 0.16, 0.25 | 0.24 | 0.20, 0.29 | 1.00 | 0.94, 1.00 | ||
| ≤3 | 0.89 | 0.80, 0.95 | 0.56 | 0.51, 0.62 | 0.34 | 0.28, 0.41 | 0.95 | 0.91, 0.98 | ||
| ≤4 | 0.44 | 0.33, 0.56 | 0.90 | 0.86, 0.93 | 0.54 | 0.41, 0.66 | 0.86 | 0.82, 0.90 | ||
|
| ||||||||||
| Reader 3 | 0.76 | 0.70, 0.81 | ||||||||
| ≤2 | 0.95 | 0.88, 0.99 | 0.32 | 0.27, 0.37 | 0.26 | 0.21, 0.32 | 0.96 | 0.90, 0.99 | ||
| ≤3 | 0.57 | 0.45, 0.68 | 0.82 | 0.77, 0.86 | 0.44 | 0.34, 0.54 | 0.88 | 0.84, 0.92 | ||
| ≤4 | 0.22 | 0.13, 0.32 | 0.98 | 0.96, 0.99 | 0.74 | 0.52, 0.90 | 0.83 | 0.79, 0.87 | ||
|
| ||||||||||
| Prediction of NCCN very-low risk features on Confirmatory Biopsy** | ||||||||||
|
| ||||||||||
| Cutoff Point | Specificity | Sensitivity | PPV | NPV | AUC | |||||
|
| ||||||||||
| Value | 95%CI | Value | 95%CI | Value | 95%CI | Value | 95%CI | Value | 95%CI | |
|
| ||||||||||
| Reader 1 | 0.61 | 0.56, 0.67 | ||||||||
| ≤2 | 0.97 | 0.93, 0.99 | 0.05 | 0.03, 0.09 | 0.37 | 0.32, 0.42 | 0.77 | 0.50, 0.93 | ||
| ≤3 | 0.52 | 0.43, 0.60 | 0.68 | 0.61, 0.73 | 0.48 | 0.40, 0.56 | 0.71 | 0.65, 0.77 | ||
| ≤4 | 0.28 | 0.21, 0.36 | 0.88 | 0.84, 0.92 | 0.57 | 0.45, 0.69 | 0.68 | 0.63, 0.73 | ||
|
| ||||||||||
| Reader 2 | 0.79 | 0.75, 0.83 | ||||||||
| ≤2 | 0.99 | 0.96, 1.00 | 0.25 | 0.19, 0.31 | 0.43 | 0.38, 0.49 | 0.98 | 0.91, 1.00 | ||
| ≤3 | 0.81 | 0.73, 0.87 | 0.63 | 0.57, 0.69 | 0.56 | 0.49, 0.63 | 0.85 | 0.79, 0.90 | ||
| ≤4 | 0.37 | 0.29, 0.45 | 0.95 | 0.91, 0.97 | 0.80 | 0.68, 0.89 | 0.72 | 0.67, 0.77 | ||
|
| ||||||||||
| Reader 3 | 0.76 | 0.71, 0.80 | ||||||||
| ≤2 | 0.94 | 0.89, 0.98 | 0.38 | 0.32, 0.44 | 0.47 | 0.41, 0.53 | 0.92 | 0.85, 0.97 | ||
| ≤3 | 0.49 | 0.40, 0.56 | 0.87 | 0.82, 0.91 | 0.68 | 0.58, 0.77 | 0.75 | 0.69, 0.80 | ||
| ≤4 | 0.15 | 0.10, 0.22 | 0.99 | 0.97, 1.00 | 0.91 | 0.72, 0.99 | 0.67 | 0.62, 0.72 | ||
NCCN low-risk features: no cores showing Gleason score ≥7 cancer
NCCN very low-risk features: no Gleason score ≥7 cancer in the confirmatory biopsy, no more than 3 cores involved by cancer, and no single core with 50% or greater involvement by cancer
95% CI=95% confidence interval; PPV=positive predictive value; NPV=negative predictive value; AUC=area under the curve
Other MRI findings
The readers detected at least 1 lesion in 27%–52% of patients. In the majority of cases, the lesions were unilateral according to readers 1 and 3 and bilateral according to reader 2. All readers suspected extracapsular extension in around 4% of patients and seminal vesicle invasion in <1% of patients.
Multivariable Analysis
Multivariable logistic regressions showed that for all readers, MRI scores were significantly associated with confirmatory biopsy findings (Table 2). For reader 1, lesion size was associated with the NCCN low-risk category (OR= 0.92, 95%CI: 0.85–0.99, p= 0.03). No other MRI features were associated with confirmatory biopsy findings for any readers.
Table 2.
Multivariable analysis
| Confirmatory Biopsy Findings Consistent with NCCN Low-Risk Criteria | |||||||||
|---|---|---|---|---|---|---|---|---|---|
| Reader 1 | Reader 2 | Reader 3 | |||||||
| OR | 95%CI | p-value | OR | 95%CI | p-value | OR | 95%CI | p-value | |
| MRI Score | 3.97 | 2.11, 7.46 | <.001 | 2.16 | 1.15, 4.06 | 0.017 | 3.22 | 2.06, 5.05 | <.001 |
| Number of Lesions | 1.18 | 0.64, 2.16 | 0.603 | 1.30 | 0.80, 2.10 | 0.287 | 1.38 | 0.81, 2.37 | 0.237 |
| Size of Lesions | 0.92 | 0.85, 0.99 | 0.030 | 1.07 | 0.97, 1.19 | 0.161 | 1.01 | 0.93, 1.09 | 0.850 |
| SVI* | 1.35 | 0.44, 4.12 | 0.596 | 0.62 | 0.26, 1.50 | 0.291 | |||
| ECE | 0.97 | 0.69, 1.38 | 0.869 | 1.06 | 0.79, 1.43 | 0.687 | 0.81 | 0.49, 1.35 | 0.421 |
| Confirmatory Biopsy Findings Consistent with NCCN Very Low-Risk Criteria | |||||||||
| Reader 1 | Reader 2 | Reader 3 | |||||||
| OR | 95%CI | p-value | OR | 95%CI | p-value | OR | 95%CI | p-value | |
| MRI Score | 1.92 | 1.13, 3.27 | 0.016 | 3.71 | 2.02, 6.79 | <.001 | 3.49 | 2.40, 5.07 | <.001 |
| Number of Lesions | 1.32 | 0.75, 2.32 | 0.343 | 1.32 | 0.83, 2.10 | 0.243 | 1.22 | 0.68, 2.18 | 0.510 |
| Size of Lesions | 0.95 | 0.89, 1.01 | 0.105 | 0.96 | 0.87, 1.06 | 0.397 | 1.03 | 0.95, 1.11 | 0.489 |
| SVI* | 1.33 | 0.50, 3.55 | 0.565 | 0.61 | 0.27, 1.35 | 0.221 | |||
| ECE | 1.29 | 0.95, 1.76 | 0.102 | 1.19 | 0.88, 1.63 | 0.262 | 0.74 | 0.44, 1.26 | 0.265 |
AS= active surveillance, SVI= seminal vesicle invasion; ECE= extracapsular extension;
Reader 3 did not identify seminal vesicle invasion in any of the patients
Inter-reader Agreement
Agreement on MRI score was fair between reader 1 (least experienced) and reader 2 (intermediate experience) (weighted kappa=0.31) and between reader 1 and reader 3 (most experienced) (weighted kappa=0.38); agreement was substantial between readers 2 and 3 (weighted kappa=0.61).
DISCUSSION
We found that amongst patients initially diagnosed with clinically low-risk prostate cancer, those with tumors not clearly visualized on MRI were significantly more likely to demonstrate low-risk features on confirmatory biopsy, while patients with tumors clearly visualized on MRI were significantly more likely to have their disease upgraded on confirmatory biopsy. In addition, our results confirm the importance of confirmatory biopsy in patients being evaluated for AS. Amongst patients who underwent prostatectomy within 6 months of MRI, the surgico-pathologic Gleason score was higher than that of initial biopsy in 65% but was higher than that of confirmatory biopsy in only 26%, suggesting that confirmatory biopsy provided a better estimate of the total tumor burden than did initial biopsy. The clinical and demographic characteristics of our study population are similar to those of patients undergoing AS in all the largest published series.5–7, 9, 21, 22 This suggests that by predicting the findings of confirmatory biopsy, MRI could aid the identification of suitable candidates for AS. Our results also confirm prior reports on the importance of training and experience for accurate interpretation of prostate MRI.23 Measurements of diagnostic performance were consistently lowest for the least experienced reader, while agreement was moderate to substantial between the two more experienced readers though only slight to fair between the least experienced reader and either of others. These results suggest that, if read by radiologists with appropriate training and experience, MRI of the prostate could help determine AS eligibility and obviate the need for confirmatory biopsy in substantial numbers of patients.
In the only published study we found that evaluated the use of T2-weighted MRI to select patients for AS, Ploussard et al24 reported on 96 patients who decided to pursue definitive treatment even though they were deemed eligible for AS based on stringent criteria from a single 21-core biopsy scheme (Gleason score≤6, fewer than 3 cores involved by cancer and tumor length per core < 3 mm); the authors concluded that MRI findings (dichotomized as organ-confined vs. non-organ-confined disease) did not improve the prediction of unfavorable features at prostatectomy in the population studied. Our results are concordant with theirs, as we did not find an association between extracapsular extension or seminal vesicle invasion (i.e., non-organ-confined disease) on MRI and upgrading from the NCCN low- and very low-risk categories at confirmatory biopsy. However, we did find an association between tumor visibility on MRI and confirmatory biopsy findings, meaning that in this clinical setting, the most important MRI finding is not whether the cancer appears organ-confined, but whether it is clearly visualized.
Our study has several limitations. First, it is retrospective, and second, we chose confirmatory biopsy as our reference standard rather than long-term outcomes; however, our results could provide the foundation for a prospective study incorporating outcome data. Third, NCCN classifications and all other predictive tools intended to define “clinically significant” prostate cancer are controversial. Nevertheless, many of these tools are routinely used in clinical practice (examples include the D’Amico risk stratification system 25 and the Epstein criteria26). Despite subtle differences between the tools and guidelines used to classify risk level and select patients for AS, no substantial differences in AS outcomes associated with their use have been reported. Furthermore, the NCCN risk assessment criteria used herein, which are the only ones that include specific recommendations about suitability for AS, are part of established management guidelines.11 Fourth, it should be noted that 18% of confirmatory biopsies in our study included samples from lesions targeted based on clinical or imaging findings; theoretically this could have improved tumor burden detection on confirmatory biopsies, though whether the initial biopsies also included targeted samples is unknown.
Another limitation of our study was the inclusion of both 1.5- and 3-Tesla MRI examinations performed over a period of 10 years; this allowed us to maximize the number of eligible patients but also introduced potential diagnostic heterogeneity. However, we found no differences in diagnostic performance between 1.5- and 3-Tesla MRI studies or between MRI studies obtained before or following the last major software upgrade at our institution. This suggests that technological improvements in the last decade may not have significantly affected conventional sequences such as T2-weighted imaging, which still represents the mainstay of prostate MRI. To date, the theoretical advantages of 3-Tesla MRI for prostate cancer diagnosis have not been comprehensively validated.27 While there is currently great interest in the use of multiparametric MRI (MP-MRI) sequences such as diffusion-weighted imaging and dynamic contrast-enhanced MRI, such sequences have only been clinically available for a few years; thus, the largest published study of MP-MRI in patients considering AS includes only 60 patients.28 We hope our study of T2-weighted MRI will serve as a basis for future studies assessing the incremental value of MP-MRI in larger cohorts.
In summary, the success of AS as a management strategy for prostate cancer relies primarily on the accurate identification of patients with low-risk disease unlikely to progress; the fact that clear tumor visualization on MRI was predictive of upgrading on confirmatory prostate biopsy suggests that prostate MRI may contribute to the complex process of assessing patients’ eligibility for AS.
Figure 2.
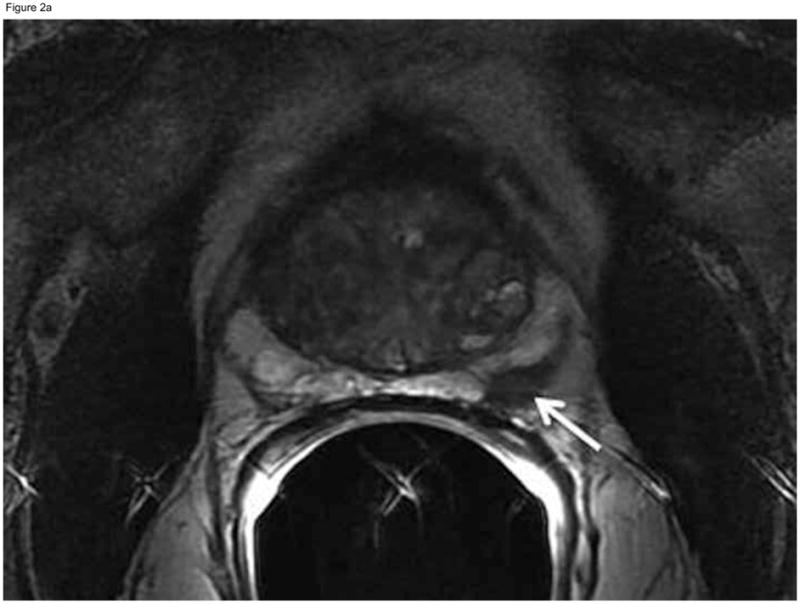
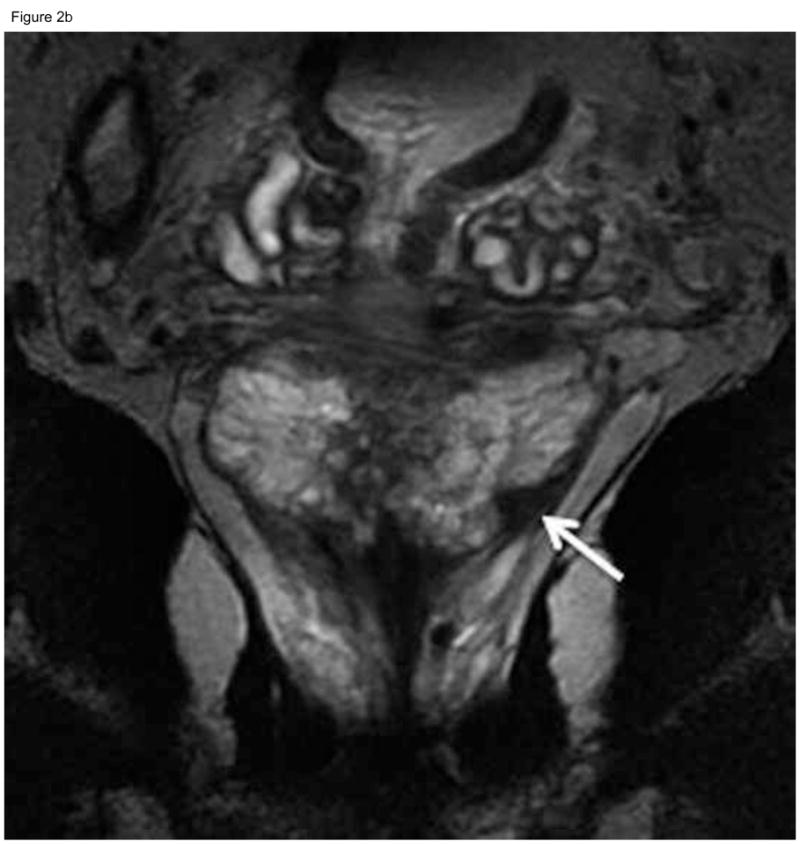
Sixty-nine-year old patient with prostate cancer, clinical stage T1c, PSA 5.1 ng/ml. Axial (A) and coronal (B) T2-weighted MRI demonstrated a nodular area of decreased signal intensity in the left posterolateral peripheral zone suspicious for tumor (arrows), which was interpreted as “definitely tumor” (MRI suspicion score=5) by all three readers. Confirmatory prostate biopsy demonstrated 4 out of 12 cores positive for cancer, 20–50% cancer involvement in each core, and Gleason score 3+4. Based on this, the patient did not fulfill the NCCN “low risk” or “very low-risk” criteria and was therefore deemed ineligible for active surveillance. Radical prostatectomy specimen revealed Gleason 3+4 prostate cancer, dominant tumor in the left peripheral zone (concordant with MRI finding), invading into, but not beyond, the prostatic capsule.
Acknowledgments
We are grateful to Ms. Ada Muellner for editing this manuscript
Definitions of Abbreviations used >3 times in the manuscript
- AS
active surveillance
- MRI
magnetic resonance imaging
- PSA
prostate-specific antigen
- NCCN
National Comprehensive Cancer Network
Footnotes
Disclosures: This study was funded by National Institutes of Health grant R01 CA076423. Dr Vargas receives funding from the Peter Michael Foundation
Publisher's Disclaimer: This is a PDF file of an unedited manuscript that has been accepted for publication. As a service to our customers we are providing this early version of the manuscript. The manuscript will undergo copyediting, typesetting, and review of the resulting proof before it is published in its final citable form. Please note that during the production process errors may be discovered which could affect the content, and all legal disclaimers that apply to the journal pertain.
References
- 1.Siegel R, Ward E, Brawley O, et al. Cancer statistics, 2011: The impact of eliminating socioeconomic and racial disparities on premature cancer deaths. CA Cancer J Clin. 2011;61:212. doi: 10.3322/caac.20121. [DOI] [PubMed] [Google Scholar]
- 2.Jemal A, Ward E, Thun M. Declining Death Rates Reflect Progress against Cancer. PLoS ONE. 2010;5:e9584. doi: 10.1371/journal.pone.0009584. [DOI] [PMC free article] [PubMed] [Google Scholar]
- 3.Draisma G, Etzioni R, Tsodikov A, et al. Lead Time and Overdiagnosis in Prostate-Specific Antigen Screening: Importance of Methods and Context. Journal of the National Cancer Institute. 2009;101:374. doi: 10.1093/jnci/djp001. [DOI] [PMC free article] [PubMed] [Google Scholar]
- 4.Thompson IM, Klotz L. Active surveillance for prostate cancer. JAMA. 2010;304:2411. doi: 10.1001/jama.2010.1761. [DOI] [PMC free article] [PubMed] [Google Scholar]
- 5.Klotz L, Zhang L, Lam A, et al. Clinical results of long-term follow-up of a large, active surveillance cohort with localized prostate cancer. J Clin Oncol. 2010;28:126. doi: 10.1200/JCO.2009.24.2180. [DOI] [PubMed] [Google Scholar]
- 6.van den Bergh RC, Roemeling S, Roobol MJ, et al. Outcomes of men with screen-detected prostate cancer eligible for active surveillance who were managed expectantly. Eur Urol. 2009;55:1. doi: 10.1016/j.eururo.2008.09.007. [DOI] [PubMed] [Google Scholar]
- 7.Dall’Era MA, Konety BR, Cowan JE, et al. Active surveillance for the management of prostate cancer in a contemporary cohort. Cancer. 2008;112:2664. doi: 10.1002/cncr.23502. [DOI] [PubMed] [Google Scholar]
- 8.Roemeling S, Roobol MJ, de Vries SH, et al. Active surveillance for prostate cancers detected in three subsequent rounds of a screening trial: characteristics, PSA doubling times, and outcome. Eur Urol. 2007;51:1244. doi: 10.1016/j.eururo.2006.11.053. [DOI] [PubMed] [Google Scholar]
- 9.Soloway MS, Soloway CT, Eldefrawy A, et al. Careful selection and close monitoring of low-risk prostate cancer patients on active surveillance minimizes the need for treatment. Eur Urol. 2010;58:831. doi: 10.1016/j.eururo.2010.08.027. [DOI] [PubMed] [Google Scholar]
- 10.Mohler JL, Armstrong AJ, Bahnson RR, et al. [Accessed 6 June 2010];NCCN Clinical Practice Guidelines in Oncology for Prostate Cancer, v2.2010. 2010 Available at http://www.nccn.org/professionals/physician_gls/pdf/prostate.pdf.
- 11.Mohler JL, Armstrong AJ, Bahnson RR, et al. [Accessed 25 May 2011];NCCN Clinical Practice Guidelines in Oncology for Prostate Cancer, v3.2011. 2011 Available at http://www.nccn.org/professionals/physician_gls/pdf/prostate.pdf.
- 12.Ploussard G, Epstein JI, Montironi R, et al. The contemporary concept of significant versus insignificant prostate cancer. Eur Urol. 2011;60:291. doi: 10.1016/j.eururo.2011.05.006. [DOI] [PubMed] [Google Scholar]
- 13.Berglund RK, Masterson TA, Vora KC, et al. Pathological upgrading and up staging with immediate repeat biopsy in patients eligible for active surveillance. J Urol. 2008;180:1964. doi: 10.1016/j.juro.2008.07.051. [DOI] [PMC free article] [PubMed] [Google Scholar]
- 14.Zhang J, Hricak H, Shukla-Dave A, et al. Clinical stage T1c prostate cancer: evaluation with endorectal MR imaging and MR spectroscopic imaging. Radiology. 2009;253:425. doi: 10.1148/radiol.2532081390. [DOI] [PMC free article] [PubMed] [Google Scholar]
- 15.Shukla-Dave A, Hricak H, Kattan MW, et al. The utility of magnetic resonance imaging and spectroscopy for predicting insignificant prostate cancer: an initial analysis. BJU International. 2007;99:786. doi: 10.1111/j.1464-410X.2007.06689.x. [DOI] [PubMed] [Google Scholar]
- 16.Delongchamps NB, Beuvon F, Eiss D, et al. Multiparametric MRI is helpful to predict tumor focality, stage, and size in patients diagnosed with unilateral low-risk prostate cancer. Prostate Cancer Prostatic Dis. 2011 doi: 10.1038/pcan.2011.9. [DOI] [PubMed] [Google Scholar]
- 17.Vargas HA, Akin O, Franiel T, et al. Diffusion-weighted Endorectal MR Imaging at 3 T for Prostate Cancer: Tumor Detection and Assessment of Aggressiveness. Radiology. 2011 doi: 10.1148/radiol.11102066. [DOI] [PMC free article] [PubMed] [Google Scholar]
- 18.Langer DL, van der Kwast TH, Evans AJ, et al. Intermixed normal tissue within prostate cancer: effect on MR imaging measurements of apparent diffusion coefficient and T2--sparse versus dense cancers. Radiology. 2008;249:900. doi: 10.1148/radiol.2493080236. [DOI] [PubMed] [Google Scholar]
- 19.Fleiss JL, Cohen J, Everitt BS. Large-sample standard errors of kappa and weighted kappa. Psychological Bulletin. 1969;72:323. [Google Scholar]
- 20.Landis JR, Koch GG. The measurement of observer agreement for categorical data. Biometrics. 1977;33:159. [PubMed] [Google Scholar]
- 21.Carter HB, Kettermann A, Warlick C, et al. Expectant management of prostate cancer with curative intent: an update of the Johns Hopkins experience. J Urol. 2007;178:2359. doi: 10.1016/j.juro.2007.08.039. [DOI] [PMC free article] [PubMed] [Google Scholar]
- 22.Kakehi Y, Kamoto T, Shiraishi T, et al. Prospective evaluation of selection criteria for active surveillance in Japanese patients with stage T1cN0M0 prostate cancer. Jpn J Clin Oncol. 2008;38:122. doi: 10.1093/jjco/hym161. [DOI] [PubMed] [Google Scholar]
- 23.Mullerad M, Hricak H, Wang L, et al. Prostate cancer: detection of extracapsular extension by genitourinary and general body radiologists at MR imaging. Radiology. 2004;232:140. doi: 10.1148/radiol.2321031254. [DOI] [PubMed] [Google Scholar]
- 24.Ploussard G, Xylinas E, Durand X, et al. Magnetic resonance imaging does not improve the prediction of misclassification of prostate cancer patients eligible for active surveillance when the most stringent selection criteria are based on the saturation biopsy scheme. BJU Int. 2010 doi: 10.1111/j.1464-410X.2010.09974.x. [DOI] [PubMed] [Google Scholar]
- 25.D’Amico AV, Whittington R, Malkowicz SB, et al. Biochemical outcome after radical prostatectomy, external beam radiation therapy, or interstitial radiation therapy for clinically localized prostate cancer. JAMA (Chicago, Ill) 1998;280:969. doi: 10.1001/jama.280.11.969. [DOI] [PubMed] [Google Scholar]
- 26.Epstein JI, Walsh PC, Carmichael M, et al. Pathologic and clinical findings to predict tumor extent of nonpalpable (stage T1c) prostate cancer. JAMA. 1994;271:368. [PubMed] [Google Scholar]
- 27.Park BK, Kim B, Kim CK, et al. Comparison of phased-array 3.0-T and endorectal 1.5-T magnetic resonance imaging in the evaluation of local staging accuracy for prostate cancer. J Comput Assist Tomogr. 2007;31:534. doi: 10.1097/01.rct.0000250108.85799.e1. [DOI] [PubMed] [Google Scholar]
- 28.Margel D, Yap SA, Lawrentschuk N, et al. Impact of multiparametric endorectal coil prostate magnetic resonance imaging on disease reclassification among active surveillance candidates: a prospective cohort study. J Urol. 2012;187:1247. doi: 10.1016/j.juro.2011.11.112. [DOI] [PubMed] [Google Scholar]


