

Abstract
Modularity has emerged as a central concept for evolutionary biology, providing the field with a theory of organismal structure and variation. This theory has reframed long standing questions and serves as a unified conceptual framework for genetics, developmental biology and multivariate evolution. Research programs in systems biology and quantitative genetics are bridging the gap between these fields. While this synthesis is ongoing, some major themes have emerged and empirical evidence for modularity has become abundant. In this review, we look at modularity from an historical perspective, highlighting its meaning at different levels of biological organization and the different methods that can be used to detect it. We then explore the relationship between quantitative genetic approaches to modularity and developmental genetic studies. We conclude by investigating the dynamic relationship between modularity and the adaptive landscape and how this potentially shapes evolution and can help bridge the gap between micro- and macroevolution.
Keywords: macroevolution, genotype-phenotype map, G-matrix, adaptive landscape, morphological integration
Introduction
Modularity has become a central concept in evolutionary biology (Wagner et al. 2007). A system is modular if it can be divided into multiple sets of strongly interacting parts that are relatively autonomous with respect to each other. This concept has been applied in developmental biology, where modules are either different parts of the embryo which interact with each other, as with induction and morphogenesis, or they are sets of interacting molecules that act independently in the patterning of multiple tissues. This concept can be extended to adult functional relationships, where modules consist of parts that act together in the performance of some physiological function, Here, we will focus on the role of variational modules in evolutionary processes. Variational modules are sets of traits that vary together and somewhat independently from other modules.
Modular concepts emerged early in evolutionary thinking with Darwin’s consideration of the “Correlations of Growth” where he noted that slight evolutionary variations in one part of an organism would result in other parts also being modified. Later, Weldon (1893, p. 329) noted that “…before we can properly estimate the changes at present going on in a race or species we must know (….) the degree of abnormality of other organs which accompanies a given abnormality of one…”. For abnormality read variations. Pearson (1896) then derived the parameter for describing the degree of relationship between two characters that we use today, the Pearson Product Moment correlation.
Despite this very early interest, a multivariate understanding and consideration of evolving characters was not common (Simpson 1958). Certainly before the development of digital computers, the amount of computational work involved in even a small multivariate study on a small sample required the calculation of enormous numbers of variances, covariances, and correlations. These herculean efforts were often not deemed worth the value derived from the research (Simpson 1958). Olson & Miller (1958) stood out by considering the variational relationships between traits as a central feature of evolution, incorporating a more holistic, systems view of the phenotype and evolution. Olson & Miller (1958) hypothesized that the degree of interdependence in development and function among morphological characters is directly related to their degree of morphological integration as measured by the statistical correlation between trait distributions. Hence, they predicted that developmentally and functionally related traits will be relatively highly intercorrelated. Further theoretical and empirical work on this concept (Cheverud 1982, 1984; Lande 1979) showed that developmental and functional integration results in correlational selection that leads to genetic integration (genetic correlations). This, in turn leads to evolutionary integration, the correlated evolution of traits. The concept of morphological integration maintained some currency in evolution and systematics from the 1960s through the 1990s. However, interest greatly increased in the new millennium. Much of this increased attention occurred after the publication of several papers on the role of modularity in evolution, especially that of Wagner & Altenberg (1996) and the 1999 University of Chicago Press reissue of Olson and Miller’s book, Morphological Integration. Wagner & Altenberg (1996) argued that modularity was important in facilitating the evolution of morphological diversity. If all features of an organism are completely integrated, the parts will be prevented from evolving independent adaptations. A modular variational structure permits the evolution of complexity and diversity as observed in the natural world.
Concurrently, important developments were taking place in evolutionary quantitative genetics. In the late 1970s and early 1980s, Lande and colleagues (Lande 1979, Lande & Arnold 1983) reintroduced models of multivariate evolution that had been ignored in evolutionary biology and systematics since Pearson’s time (Pearson 1896), although they were better known in agricultural genetics (e.g., (Hazel 1943)). Lande (1979) also showed how quantitative genetic evolutionary models could be used in systematics to investigate the evolutionary causes of diversification on a macroevolutionary scale by providing expectations for the diversification of species under genetic drift and under directional selection. Here we review the genetics of variational modularity, its relationship with development, how it can evolve, and its consequences for evolution and systematics.
Methodological considerations
Representations of morphology
While most of what is said in this review can be applied to any continuous traits, much of the work related to modularity is concerned with morphological traits. The traditional way of representing morphological structures is to use a suite of linear distances (Olson & Miller 1958), preferably taken within a single homologous structure such as a bone, to represent a given morphological structure in a specimen. This representation captures local developmental and functional factors in a single homologous trait. The last 20 years, however, saw a shift in methodology in favor of using landmark based methods, especially Generalized Procrustes Analysis (GPA, Kendall 1984). GPA takes a set of 2D or 3D landmarks measured in a group of specimens, scales all specimens to a common size, and then uses an interactive procedure to superimpose the scaled configurations by minimizing the squared distance between the landmarks in all specimens and a mean shape. From this superimposed set we can calculate the distance between each specimen and the mean shape, and this is used to represent them. While this procedure has many desirable mathematical properties (Bookstein 1997) and is a powerful way of describing a morphological structure, its appropriateness for the study of variation and covariation has never been fully established. In particular, since changes in a single landmark will cause changes in the whole configuration, locality of variation is not necessarily preserved in the GPA covariance matrix. This problem has long been recognized in the morphometrics community (Adams et al. 2013), but it’s consequences for the study of modularity and evolution have only recently become apparent (Márquez et al. 2012, van der Linde & Houle 2009). Since local variation is not preserved, it is hard to detect local associations and covariation in populations using GPA, limiting its use for the study of modularity. This is also a problem when relating genetic variation to morphological variation, since again variation will be spread out over the whole morphological structure, and local genetic factors will appear to have widespread effect (Berner et al. 2011). There have been promising efforts to reconcile landmark based methods and local variation, such as the local shape variables described in Márquez et al. (2012), finite element scaling analysis (FESA, Cheverud & Richtsmeier 1986), and euclidean distance matrix analysis (EDMA, Lele & Richtsmeier 1991), but these have not yet been widely adopted. With this in mind, we will not discuss approaches that make use of GPA to study covariation and modularity. Instead, we will focus on representations of morphology that preserve local variation, like linear distances and local shape variables.
Detecting variational modularity
Variational modularity has been used in several different contexts and, therefore, a wide range of methods for detecting and quantifying variational modularity in multivariate data are available. At their core, most methods are based on some measure of association among traits (e.g., covariances or correlations); and modularity has often been inferred through the analysis of patterns and magnitudes of association (e.g., Armbruster et al. 2004, Porto et al. 2009). Given a set of traits in a population and a correlation (or covariance) matrix between them, we might ask which sets of traits are grouped in modules, or if a particular partition of traits is supported by the observed statistical inter-trait association. We discuss methods for the detection of modules in these two situations: (i) extracting putative groupings of traits without a prior hypothesis and (ii) testing if a particular partition established on different grounds is supported by the observed correlation matrix.
Detecting putative modules is very common in systems biology (Ayroles et al. 2009, Ihmels et al. 2002), where traits are frequently expression data for thousands of genes and a priori hypotheses are impractical or impossible. Methods for partitioning traits into modules usually derive from network and graph theory, treating the correlation matrix as a fully connected weighted graph and using algorithms designed for community detection in graphs (Langfelder & Horvath 2008, Reichardt & Bornholdt 2006), or clustering algorithms coming from other contexts (like Potts model clustering or neighbor joining). Network based models search for partitions where members in the same partition share more connections than expected in a random network. Currently, these methods work well in high dimensional problems, where misclassification of some individual traits is not a serious problem. While these methods have been used in much lower dimensional problems (Magwene 2001), results are not always easy to interpret and partitions can group seemingly unrelated traits together. This can be partially explained by the origin of the methods: since these methods are borrowed from graph theory, most of the methods and definitions relate to properties of random graphs, and it is not obvious how to translate these assumptions to correlation matrices. For example, few methods consider the possibility of a trait belonging to two modules, or that modules might have a nested or hierarchical organization. Recently some effort has been made in producing module detection algorithms that are tailored for correlation matrices (MacMahon & Garlaschelli 2015), but these have not been applied to biological systems, and more work developing tools that can deal with complex modularity structures is needed.
In morphological systems with lower dimensionality, and where information on development or function of the measured traits is available, we may be interested in testing particular modularity hypotheses and assigning some degree of support to each hypothesis given the observed correlation matrix, or simply validating a given modularity hypothesis. One approach to this problem is to compare the proposed partition to random partitions, using some statistic dependent on the partitions and the correlation matrix. The correlation test proposed by Cheverud (1989) compares the within module correlations to between module correlations. If the observed difference in within and between module correlations is higher than the difference for random partitions, the modular structure is considered valid. The RV coefficients (Klingenberg 2009) is a generalization of the squared Pearson correlation coefficient to multiple dimensions, and can be used to quantify the degree of independence between two groups of traits. The RV statistic is calculated for a proposed partition and compared to random partitions via permutations. While this statistic was proposed in the context of landmark data, it can be used with linear distances or local shape variables. Márquez (2008) presents a framework that allows the simultaneous testing of many competing modularity hypotheses, including overlapping and hierarchical modules. The main idea is to use a modularity hypothesis to generate a modeled covariance matrix, where within module covariances are set to the observed values and the between module covariances are set to zero. This modeled matrix is compared to the original covariance matrix with a multivariate measure of similarity.
Both module detection and module validation using correlations, are made difficult by the presence of global integrating factors that increase between module correlations (Mitteroecker & Bookstein 2007, Porto et al. 2013). These will be discussed below.
Genetics of modularity
Genetic associations among traits can be explained by two different phenomena: pleiotropy and linkage disequilibrium. Linkage disequilibrium (LD) refers to the non-random association of alleles at different loci. In large populations, LD will be eliminated after several generations of random mating. For that reason, LD is considered a transient source of genetic association (Cheverud 1996), except in species with only a few segregating chromosomes. Pleiotropy, in our context, refers to the manifold phenotypic effects of a single unit of inheritance (Stearns 2010). The word ‘context’ is used here to emphasize the difficulties in finding a universal definition for the term (see Paaby & Rockman 2013). Pleiotropy, when defined in this way, is considered an important source of genetic association, since it causes traits to be inherited together and, therefore, to vary together within populations.
Given the importance of pleiotropy as a source of association among traits, one might be interested in the structure of pleiotropic effects of loci underlying modular trait variation (Figure 1, Wagner & Altenberg 1996). Two prominent questions are whether pleiotropic effects are also modular and whether modular pleiotropy facilitates evolvability. From the theoretical standpoint, several models for the structure of the genotype-phenotype (G-P) map have been put forward (Hansen 2003, Mitteroecker 2009, Pavlicev & Hansen 2011). The general consensus is that, given certain assumptions, multiple different models are equally capable of explaining observed genetic associations among traits (Mitteroecker 2009). Similarly, while modular G-P maps can maximize evolvability in stochastic environments, they do not necessarily maximize it under more stable conditions (e.g., Hansen 2003).
Figure 1.

(A) Typical representation of modularity in the genotype-phenotype map. Yellow and orange circles represent modular genetic factors, and blue circles represent global ones. The circle in green represents a genetic locus capable preventing the global factor from affecting module 2 (rQTL). Squares represent phenotypic traits, and the arrows represent the relationship between genotype and phenotype (pleiotropy). (B) Trait correlations as a function of the underlying genetic variation. In case 1, genetic variation is only present for local factors. As a consequence, modular patterns of covariation emerge in the phenotype. In the second case, there is genetic variation in both global and local genetic factors. As a consequence, covariation patterns are less modular. Finally, in the third case, modular covariation patterns emerge again, as a consequence of the rQTL preventing the global genetic factor from affecting module 2. (C) The nature of gene effects across the different levels of the biological hierarchy. Here we are representing a case in which a certain mutation, represented at the level of the genotype, causes changes in the developmental parameter space (e.g., rate of cell division), which in turn, leads to changes in the selected phenotype.
A clearer picture of whether G-P maps are modular and whether they promote the evolvability of organisms came with the collection of large empirical datasets in mice, yeast and nematodes (see Wang et al. 2010). These large datasets allowed for a systematic investigation of the pleiotropic effects of genes on the phenotype, across a variety of approaches including quantitative trait loci (QTL) mapping and gene knockout studies. The picture emerging from these large datasets is that most mutational effects are modular, with genes affecting different sets of functionally and developmentally-related traits (Wang et al. 2010). In other words, the variational modularity observed in the phenotype can be explained by modularity in the G-P map (sensu Wagner and Altenberg, 1996). A minority of mutations affect large groups of traits as they are are associated with global genetic factors (Figure 1). More importantly, in these same studies, modular pleiotropy was shown to maximize the rate of adaptation and promote the evolution of complexity, due to the observed pleiotropic scaling of gene effects (Wang et al. 2010).
Evolution of modularity
Genetic variation in pleiotropy
Modularity can evolve through changes in the pleiotropic effects of alleles on traits themselves. Genetic variation in pleiotropy has long been recognized as playing an important role in evolutionary processes. Mayr (1963) noted the importance of epistatic interactions in ameliorating the deleterious pleiotropic effects of alleles on fitness and enhancing their positive fitness effects. Variation in allelic effects at a target locus is produced by differential epistasis, where epistatic interactions between the target and modifier loci on multiple traits differ in their effects from one trait to the next (Cheverud 1996, Pavlicev et al. 2008, 2011b). Several examples of differential epistasis have been recognized over the last 30 years. The abnormal abdomen (aa) locus in Drosophila mercatorum is a classic example of this phenomenon. In laboratory experiments, the aa locus was found to have a wide variety of pleiotropic effects on morphological and life history traits (Templeton et al. 1985), but these were not manifested in wild populations due to modifier loci. Differential epistasis has also been described in several other systems, including coronary artery disease (Maxwell et al. 2013) and viral reproductive success (Pepin et al. 2006).
While the importance of epistasis has long been appreciated in evolution, only recently has the major part that epistatic pleiotropy plays in shaping covariation become apparent. Wolf et al. (2005) used QTL mapping in experimental crosses of inbred Large (LG/J) and Small (SM/J) mice strains to investigate the genetic architecture in several late and early skull traits. Covariation between traits was strongly affected by epistatic variation in pleiotropy, and the genetic architecture determining the pattern of association between traits can be attributed to a complex pattern of genetic interactions. In these mice, most epistatic effects on pleiotropy reduced covariation, leading to a more modular genetic organization. Pavlicev et al. (2008) investigated the allometric relation between body weight and long bone length in mice, and the authors identified several relationship QTLs (rQTLs). These are QTLs that do not necessarily affect the mean value of traits, but the relationships between traits (Wagner et al. 2007). This widespread evidence of genetic variation in the covariation between traits due to epistatic interactions provides ample scope for natural selection to change associations between traits and, hence, modularity patterns.
Modeling changes in covariation
The availability of variation in the associations between traits led Pavlicev et al. (2011a) to develop a deterministic model for the evolution of pleiotropic gene effects under directional selection. In this model, there is genetic variation in the strength of correlation between two continuous traits in the form of a polymorphic rQTL with no effect on the trait mean. Traits that are selected in the same direction tend to become more strongly correlated, even if selection is fluctuating. Conversely, if the two traits are under corridor selection, where one of the traits is selected to either increase or decrease and the other is kept constant, the rQTL allele representing low correlation is positively selected and the traits become independent. The main conclusion of their model is that the nature of pleiotropic allelic effects is expected to evolve to match adaptive patterns of selection.
Using the existence of variation in pleiotropic relations, Melo & Marroig (2015) developed an explicit individual based stochastic model for the evolution of continuous traits in finite populations, where pleiotropic associations between genetic loci and phenotypic traits are free to change under mutation. This model has the advantage of being able to include a number of complications, such as a large number of traits, drift, different patterns of selection, recombination and mutation. The possibility of simulating several traits is especially interesting since it permits the investigation of complex modular patterns. The authors evaluated the evolution of modularity under a series of evolutionary scenarios. Drift and stabilizing selection were not capable of creating lasting modular patterns of covariation, while divergent directional selection (where one group of traits is selected in one direction while another group is selected in the opposite direction) creates modularity; traits selected in the same direction become more strongly correlated and form clear variational modules. Under corridor selection, the group of traits under directional selection becomes more correlated, while the group of traits under stabilizing selection maintains intermediate levels of correlation, and the correlations between these two groups become very low. This suggests corridor selection is a powerful mechanism for creating complex modular patterns.
Epistasis has also been implicated in the evolution of the mutation matrix for continuous traits. In Jones et al. (2014) the authors develop a model for the evolution of two continuous traits under genetic control of several pleiotropic loci, including a stable patterns of epistatic interaction between the loci affecting the quantitative traits. The traits were then subjected to correlated and independent stabilizing selection. Under uncorrelated selection the traits presented correlations near zero, and the mutation matrix also had zero correlations between traits. Under correlated stabilizing selection, however, the traits’ genetic correlations changed, coming to mirror the pattern of stabilizing selection. The mutation matrix also aligned with the selection surface, leading to a situation in which the effects of new mutations are biased by previous selective history.
These different models allow us to draw general conclusions regarding the expected evolution of covariation between quantitative traits, regardless of the specific model used. First, variation in pleiotropic relations is essential to the evolution of modularity, and this variation can be attained through epistatic interactions. Second, under directional selection, traits that are jointly selected in the same direction tend to become more strongly correlated. Third, since selection can change the pleiotropic and developmental relations between traits, future evolutionary changes can be biased by previous selective history.
Empirical evidence for changes in covariation
There are several instances where evolution, and presumably selection, has broken down patterns of association among traits to produce major adaptive shifts. Hallgrímsson et al. (2012) have classified these changes in the patterns of modularity between traits as a form of evolutionary novelty, as there is “a breakdown of ancestral developmental constraints such that variation is generated in a new direction or dimension”. Indeed, this type of novel variation has been documented in several systems. Young & Hallgrímsson (2005) found a common pattern of strong covariation between the fore- and hindlimb elements in quadrupedal mammals, constraining the independent evolution of the limbs. However, two mammals with highly derived limb morphologies, the brachiating gibbons and flying bats, show a reduction in the cross-limb correlation, accompanying their extreme limb individuation.
There are also examples of the initial pattern of genetic associations being overcome by artificial selection. Beldade et al. (2002) used the eyespots in butterfly wings as a target of selection. Initially, the anterior and posterior eyespots are correlated, and selection for coordinated change of both eyespots produces a rapid and linear response; while selection in the uncoupling direction, for increase in one eyespot and decrease of the other, leads to a response that is much less linear and more irregular. This illustrates that there are preferential directions for evolution produced by the pattern of modularity, and evolution is faster in these directions, but these are not absolute restrictions. Recently, artificial selection experiments using Drosophila melanogaster revealed yet another important role for selection in influencing patterns of association among traits. By selecting on allometric relationships in drosophilid wing shape, Bolstad et al. (2015) produced laboratory lineages presenting larger differences in allometric slopes than the ones observed across a large clade of drosophilids. This evolutionary response to selection in the allometric slopes was, however, quickly lost after selection pressures were suspended, indicating that internal selection might be responsible for maintaining conserved allometric slopes on a macroevolutionary timescale.
These results illustrate the complexity of the interaction between modularity and selection. Evolutionary restrictions imposed by genetic associations are rarely absolute, and selection that privileges uncoupling of associated traits can lead to a reorganization of variational patterns. At the same time, covariation patterns can also be largely maintained, due to internal selective pressures (as in the allometric relations in drosophila) or due to differences in the availability of rQTL variation to change pleiotropy.
Development as the link between genes and phenotype
Biology has largely abandoned the notion that genes cause traits, so understanding the mechanics and regulation of development is becoming increasingly essential to elucidating the relationship between modularity and trait evolution (e.g., Salazar-Ciudad & Jernvall 2010). Development occurs not only through the molecular interaction among many gene products but also through the mechanical interactions between the developing cells and tissues, all of which can create significant non-linearities in the G-P map (Alberch 1991, Polly 2008, Watson et al. 2014). In this section, we review recent literature that explicitly addresses the connection between quantitative approaches to modularity and the underlying developmental genetics. We were particularly interested in studies that explicitly incorporate the mechanics of development into an evolutionary framework or that identify genes that contribute to change in canalization. We also highlight the emergence of the new field of systems genetics.
Causes of a phenotype vs. Causes of phenotypic variation
In a developmental context, it is particularly important to distinguish between the causes of a phenotype and causes of phenotypic variation A developmental process might be essential for a trait to emerge (cause of a phenotype), but, as long as it is conserved across individuals, it will not be a cause of phenotypic variation in a population. Empirical evidence overwhelmingly suggests that causes of a phenotype are modular in nature. The whole concept of character relies on it (Wagner 2007). Character identity networks imply that we can only truly recognize something as a distinct character if it shows some degree of modularity at the developmental genetic level.
Modularity in the causes of variation of a phenotype is another matter altogether. The notion that causes of phenotypic variation might also be modular stems from the concept of morphological integration, as seen above, and from the imitatory epigenotype hypothesis (Riedl 1978), which predicts that the pattern of developmental constraints “imitates” the pattern of functional constraints, leading to covariation among functionally related traits within populations. Empirical evidence suggests that there can be a correspondence between variational and developmental modularity, but this correspondence is by no means guaranteed, as seen in previous sections.
Incorporating development into evolutionary studies
While variational modularity is often assumed to be a consequence of variation in the underlying developmental mechanisms, explicitly modeling developmental systems or even inferring developmental processes from variational modules are not simple tasks (Hallgrímsson et al. 2009, Pavličev & Cheverud 2015). Interactions among tissues, as well as local and global genetic factors acting at different time points, will all be superimposed during development and contribute to the final phenotype (Hallgrímsson et al. 2009, Mitteroecker & Bookstein 2007). Similarly, a single modular pattern can emerge through multiple independent developmental pathways (Mitteroecker 2009), making the prediction across levels of the hierarchy difficult. To our knowledge, the most successful empirical case of incorporating developmental parameters in evolutionary models is Salazar-Ciudad & Jernvall (2002, 2010)’s model of tooth development. Tooth development is a relatively well understood process, since several of the genetic interactions and cellular processes that lead to tooth formation are known. As a consequence, Salazar-Ciudad & Jernvall (2010) created mathematical models describing tooth morphology as a consequence of perturbations in the underlying genetic and developmental parameters, such as the rate of cell proliferation or cell adhesion. This model was successful at producing accurate predictions of tooth morphology for several mammalian groups (Salazar-Ciudad & Jernvall 2010). Other successful cases of the use of developmental mechanisms to explain phenotypic variation comes from Drosophila wing venation patterns (Matamoro-Vidal et al. 2015) and butterfly wing spots (Beldade & Brakefield 2002), both of which involve changes in several key developmental processes, such as the distribution of morphogens in the wing disc or the establishment of planar cell polarity.
A theoretical approach that has also undertaken a more explicit incorporation of developmental information into the evolution of the G-P map was developed by Watson et al. (2014). In their model, multivariate traits are produced by a G-P map with multiple independent developmental steps connecting the phenotype to the genotype. This conceptualization produces a nonlinear ontogeny and allows the model to capture interesting behaviors of these G-P maps, such as the ability to recall multiple phenotypes that were selected in the past or the ability to produce new combinations of features from modular developmental processes. Traits in this model tend to become more associated throughout development when they are selected in the same direction and become independent when they are selected in different directions, reinforcing the role of directional selection in shaping modularity.
In conclusion, while approaches relating variational modularity to the mechanics of development are relatively rare, these different empirical studies and theoretical models clearly show that incorporating the more complex developmental interactions into studies of morphological variation and evolution greatly increases our ability to understand and even predict the evolutionary dynamics of complex systems. The main challenges going forward are going to be creating models capable of describing more complex structures, such as the skull, and incorporating the possibility of changes in the topology of genetic and developmental networks.
System Genetics - A systematic approach
A promising way to integrate modularity with the underlying developmental genetics in a systematic way is currently gaining traction under the “system genetics” approach (Ayroles et al. 2009, Mackay et al. 2009). The idea behind system genetics is simple. It interrogates the relationship between genome and phenome under different contexts (e.g., environments or conditions). As a consequence, it attempts to hit at the core of the context dependency of gene effects, which is not only fundamental for the evolution of modularity (Pavličev & Cheverud 2015), as seen in previous sections, but also emphasizes its developmental basis by potentially uncovering important modular signaling cascades.
System genetic approaches have been applied to several different model organisms (Ihmels et al. 2002, Juenger et al. 2005, Wang et al. 2010). In Drosophila (Ayroles et al. 2009), it led to the identification of several transcriptional modules that are not only connected to genomic variation but also underlie variation in ecologically relevant traits, such as fecundity and metabolism. Those transcriptional modules are strongly influenced by environmental, developmental and genetic background effects, highlighting the fact that context-dependent effects are the norm and are, therefore, responsible for most phenotypic variation. System genetic approaches have also recently been used to map changes in the amount of variation for a given phenotype (Ayroles et al. 2015). Genetic variation in phenotypic variance represents genetic variation in developmental canalization, a topic that is especially relevant to studies of threshold characters or threshold selection (Ayroles et al. 2015). Among the challenges faced by system genetics, two should be highlighted. Due to its ambitious nature of scoring multivariate traits and entire transcriptomes/genomes, they are inherently expensive studies. Also, multivariate statistics are often dependent on large samples, and are often estimated with considerable error, an aspect that needs to be taken into account.
Modularity and the adaptive landscape
Is modularity and integration relevant for phenotypic evolution? Having discussed and characterized modularity and the possibility of its evolution, we will now address its evolutionary consequences. There are short- and potentially long-term consequences of modularity for evolutionary change. We will start by introducing the quantitative theory dealing with the short-term consequences and identifying under which circumstances this theory can be extended to the macroevolutionary level. Since modularity in patterns of genetic associations between continuous traits is captured by the additive genetic variance/covariance matrix, the G-matrix (Lande 1979), this section will focus in the relationship between the G-matrix and the adaptive landscape.
Why so much interest in the G-matrix?
Evolution, regardless of which evolutionary process is involved, depends on genetic variation. The G-matrix summarizes the amount and pattern of additive genetic variation and covariation among traits and is, therefore, essential to our understanding of the connection between genetics and evolution (Lande 1979). Genetic covariation among traits is particularly important because of its potential to affect the course of phenotypic evolution (Figure 2). Unlike the univariate view of evolution, in which a single trait’ s value can be optimized without constraint from selection on other traits, genetic covariation among traits causes correlated responses to selection. In this situation traits will change and evolve together, often in a direction that is different from the one favored by selection (Figure 2, Grant & Grant 1995, Lande 1979). Thus, the pattern and magnitude of the G-matrix elements can deflect the path of evolution from its optimal trajectory. Whether or not this short-term effect on the evolutionary responses has enduring consequences depends on the degree of stability of the G-matrix and on its relationship with the adaptive landscape (Steppan et al. 2002, and see below). Long term stability of the G-matrix is one of the most fundamental assumptions of the research program we are describing here, and questions related to the long term stability and estimation of G-matrices are still open (Houle & Meyer 2015, Jones et al. 2012). Many feel uncomfortable with this assumption of stability (Björklund et al. 2013). This discomfort stems in part from empirical evidence that suggests that no two populations have identical G-matrices, and that G-matrices can fluctuate over short time periods (Björklund et al. 2013, Eroukhmanoff & Svensson 2011). Biological populations are finite and almost surely differ in their gene frequencies, especially considering the potentially large number of genes affecting complex traits and the correlations between them (Phillips et al. 2001, Whitlock et al. 2002). We suggest that in many instances the assumption that population covariance matrices are identical be rejected out of hand. But the mere presence of a statistically significant difference is not the critical issue. Instead, the more interesting and relevant questions are: How similar are two covariance patterns with respect to their predicted evolutionary responses? Do some quantitative traits have more stable G-matrices than others? Fortunately, these are questions that can be examined empirically (Calsbeek & Goodnight 2009, Cheverud & Marroig 2007) and are a critical first step for the use of the G-matrix in multivariate evolution and systematics.
Figure 2.
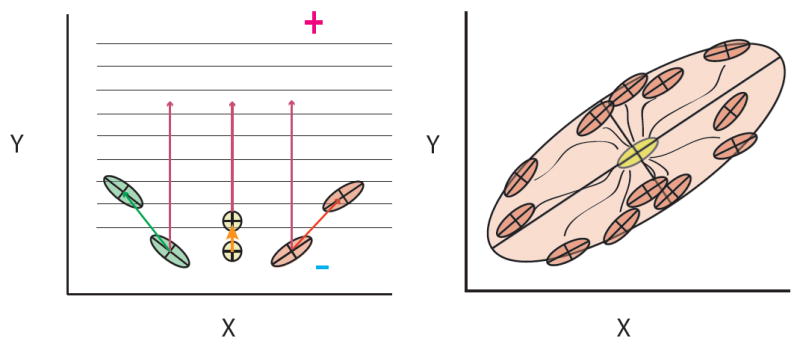
To illustrate the interaction of modularity (captured in the G-matrix) and evolutionary processes (selection and drift), we display two panels illustrating population averages, G-matrices, adaptive peak(s) and selection gradients (β). G-matrices are represented by ellipses of different colors and with the axes of major genetic variation embedded. The major axis corresponds to the line of least resistance (Schluter 1996), that is, the direction which holds most of the genetic variation in the trait space. Selection gradients are represented by straight arrows and measure the relationship between fitness and individual traits, while holding the other traits constant. Responses to selection (Δz) are also shown as arrows and indicate changes in the trait averages across time. The multivariate response to selection equation (Δz=Gβ) captures the relationship between the response to selection (Δz), inheritance (G-matrix) and selection (β). The direction of increase in average fitness is indicated by + and decrease in fitness is indicated by -. First panel (upper left) shows 3 populations (green, yellow and red) under the same adaptive landscape, where an increase in trait Y is favored and trait X does not affect fitness. Notice that the response of each population to the same selection gradient differs (dark green, orange and red arrows). Population Green increases Y but decreases X values, population Red increases Y and X values, and population Yellow only increases Y although with a smaller displacement of Y than the other 2 populations. These different responses under the same selection gradient are due to differences in the G-matrices. Populations Green and Red have their responses deflected from the optimal path, due to the covariation between Y and X (negative in Green, and positive in Red). Thus, traits that are not under direct selection will contribute to the response due to their shared inheritance. If traits are independent (population yellow), each can be optimized separately. But note that the displacement in the Y average is smaller than in the other populations, because the genetic variation available in that direction is smaller. Upper right panel show the consequence of a flat adaptive landscape (random genetic drift) on the averages of descendent populations (red ellipses) of an ancestral population (yellow ellipse). The arrows in this case point to each population’s trajectory. At the end of the drift process, 95% of all evolution (divergence among means) is captured by the larger ellipse (light pink). Notice that there is substantial more divergence along the axis holding most of the within-population genetic variation.
So, what do empirical studies tell us about the relative stability of the G-matrix over macroevolutionary timescales? Empirical evidence varies greatly depending on the study system in question. One of the most thoroughly explored cases is the mammalian skull, where empirical evidence strongly suggests that G-matrices are stable across mammalian taxa (Garcia et al. 2014, Marroig & Cheverud 2001, Porto et al. 2009). By stable we do not mean that heritable variation patterns are identical across species, but that they will deflect the phenotypic response to selection in a similar way.
While it is possible that extant species variation patterns are fairly similar, it is possible that stochastic fluctuations in the G-matrix over generations are large enough to render the inferences we might make from extant patterns useless. These fluctuations are possible for many reasons, like segregating alleles with large effects or linkage disequilibrium caused by periods of strong fluctuating selection (Bulmer 1971, Turelli 1988). While this is certainly a theoretical possibility, the critical question is whether or not changes in G-matrix structure based on theoretical considerations are of sufficient magnitude to affect evolutionary inferences (Arnold et al. 2008). Fortunately, simulations quantifying these problems suggest that their effect can be small (Jones et al. 2004, 2012).
The missing link: Adaptive landscapes and the G-matrix
We have discussed genetic associations, the genetic and developmental origins of modularity and their influence in evolutionary response. One missing, and arguably the most important link, is the relation between covariation and the adaptive landscape. By examining the relationship between modularity and adaptive landscapes, we can put micro- and macroevolution into a common unifying theory (Arnold 2014, Arnold et al. 2001). This theory not only explains the relationship between development, function and inheritance in shaping modularity patterns, but also will allow us to explore the evolution of multivariate phenotypes in deep-time and suggest future research directions.
While there are many studies at a local scale (within-population), we have precious little information about adaptive landscapes between species (Pfaender et al. 2016). One of the most important developments in the past 30 years of evolutionary theory was the multivariate regression methods for inferring individual selection surfaces from multivariate data (Lande & Arnold 1983). Although not without critics (Shaw & Geyer 2010), these methods have allowed researchers to directly investigate adaptive landscapes and to empirically measure selection on multivariate trait sets. In this approach, the adaptive landscape is described by two main terms: a linear term related to directional selection and a quadratic term related to stabilizing/disruptive selection (Lande & Arnold 1983). The quadratic component affects the variances and covariances among traits and, along with directional selection, is thought to be the major evolutionary process shaping modularity (Melo & Marroig 2015). The selection gradient (linear term) is the direction of maximum increase in fitness and is the vector of partial regression coefficients of fitness on traits. This framework can also be used to study directional selection retrospectively, by measuring extant species means and covariance matrices we can estimate ancestral states and, by solving the Lande equation, the selection gradient that would have resulted in the observed diversification (Lande 1979 equation 9, Figure 2).
Even though this toolkit for explicitly characterizing selection has now been available for decades, empirical characterizations of multivariate selection are still rare, despite their acknowledged importance. Yet in the past 20 years of reconstructing selection gradients from extant diversity has given us two fundamental insights into the nature of multivariate evolution. First, estimates of the strength of both stabilizing and directional selection are usually weaker than we previously assumed (Kingsolver et al. 2001, 2012). But, more importantly, the empirical evidence suggests that the direction of evolutionary divergence and the direction of selection are rarely the same and, often times, present little resemblance. An important work illustrating this notion comes from studies of D. serrata (Chenoweth et al. 2010). In a study of sexual selection, the authors note that even though local processes of sexual selection varied considerably across their nine populations, evolutionary divergence occurred primarily along a single trait combination. Variation in sexual selection had little influence on evolutionary divergence. Instead, genetic covariation among traits caused the evolutionary response to be significantly deflected from its optimal path. Studies on Dalechampia blossom morphology have also emphasized that only a portion of evolutionary divergence patterns can be accounted by models of external selective factors, such as community composition and availability of resources. Rather, constraints imposed by covariation patterns seem to be essential for our understanding of the evolution of blossom traits (Bolstad et al. 2014, Hansen et al. 2003).
We should point out that selection gradients reported in these retrospective works are net gradients, that is, an estimate of the cumulative sum of all selection gradients acting over the generations of divergence. If the G-matrix is stable, this net selection should be a reasonably accurate estimate of the sum of individual gradients (Jones et al. 2004). Another issue with reconstructing selection is that G- and P-matrices are often estimated with substantial error, with frequent poorly conditioned or negative semi-definite matrices. This means that the inversion step in the reconstruction analysis can lead to very large errors (Marroig et al. 2012). Fortunately, there are matrix estimation or regularization methods that can vastly improve the selection gradient estimates, and these should be used whenever we estimate them (Marroig et al. 2012, Schäfer & Strimmer 2005).
Evolutionary change in simple landscapes
Most of our knowledge of the relationship between modularity and the adaptive landscape comes from simulation studies. In simulations carried out on simple landscapes, patterns and magnitudes of association among traits affect the direction, magnitude and rate of evolutionary change under selection (e.g., Marroig & Cheverud 2010). The effect of the G-matrix on evolutionary change depends critically on in its structure in relation to the adaptive landscape (Conner 2012, Laughlin & Messier 2015), and can either augment or slow the evolutionary response relative to a situation with fully independent traits. If selection is along dimensions unaligned with modularity/integration patterns, the response is deflected towards the lines of least resistance (Schluter 1996). If selection is aligned with modularity, however, the evolutionary response is greatly facilitated (Beldade et al. 2002, Bolstad et al. 2014). The closer the alignment with the major line of least resistance, the quicker and more direct the evolutionary response. However, simulations are highly concordant in showing that these effects are restricted to the microevolutionary scale, and, given sufficient time and a simple adaptive landscape, the population will eventually reach the selective peak, unless there is no genetic variation at all in that direction (an absolute constraint, Blows & Hoffmann 2005). But theoretical work suggests that even if there is an apparent lack of genetic variation along some dimension, there is frequently hidden genetic variation in the form of epistasis that can fuel evolutionary change in subsequent generations (Hansen 2013, Hansen et al. 2006). So, given the possibility of adaptive changes in the G-matrix through time, and that the constraints imposed by G-matrices are usually microevolutionary, the emerging picture would be one where G-matrices should not have any enduring macro-evolutionary consequences (“transient constraints model”, from now on). But what happens when we consider complex adaptive landscapes?
Evolutionary change in rugged landscapes
While single peaked adaptive landscapes are convenient for model building purposes, adaptive landscapes are thought to be very rugged, that is, they have many adaptive peaks and valleys (Kauffman & Levin 1987, Martin & Wainwright 2013, Wright 1932). When the adaptive landscape is rugged and when genetic associations are stable through time, macroevolutionary dynamics will be shaped by the interaction between the G-matrix and the adaptive landscape (Figure 3). This implies that, in rugged and multiple peaked adaptive landscapes, the G-matrix can have a major influence in determining which peak will be reached by a given population, even if in theory the effect of the G-matrix is microevolutionary (Steppan et al. 2002). This argument was already present in Lande (1979), but in a somewhat obscure formulation: “However, the adaptive topography for each population or species generally has multiple peaks (Simpson, 1953, Ch. 7; Lande, 1976a; Wright, 1977 and previous papers). Genetic correlations can alter the long term result of selection by influencing the direction of evolution at critical periods when a population approaches a threshold (or saddlepoint) between adaptive zones, as by random genetic drift or by environmental fluctuations which directly affect the phenotype or alter the adaptive topography.” This can be easily understood noting that, in evolutionary terms, the distance between the population average position and the peak is not a simple linear (Euclidean) distance between the start position and end position of the species averages, but it is a weighted distance, with the weight being given by the patterns of genetic association. Given the influence of genetic correlations, the distance of a population from a peak is measured in units of genetic variation. Thus, the closest peak, the peak the population eventually reaches, is not necessarily the highest or even the closest in Euclidian distance, but the closest in genetic scaled distance. We will refer to this idea as the “peak selection” model.
Figure 3.
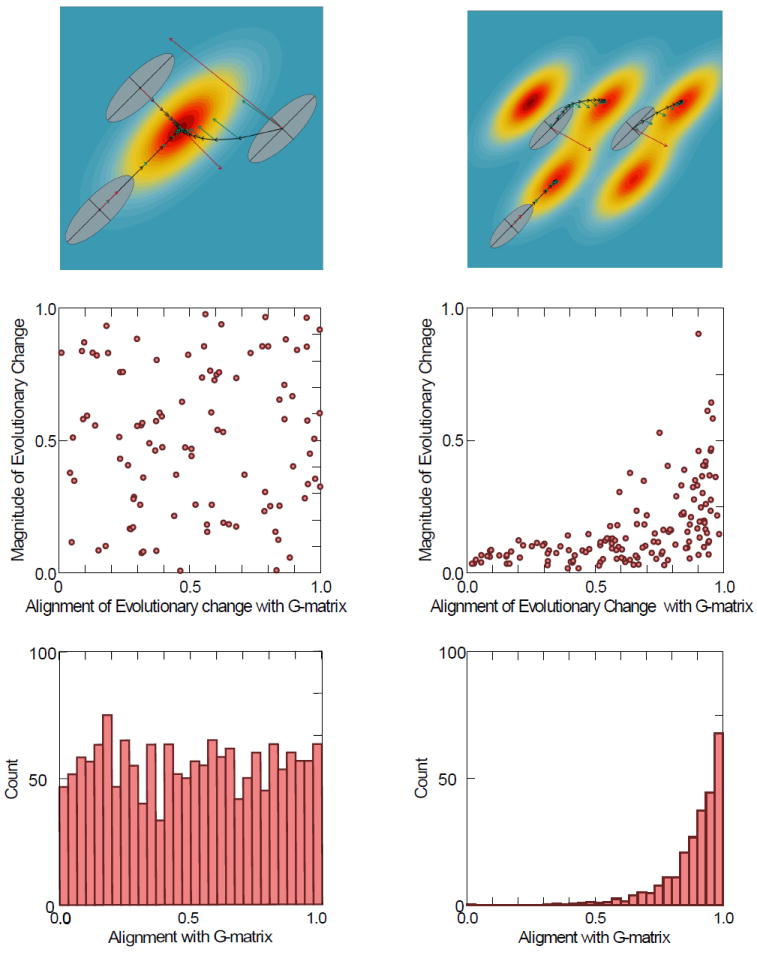
Top left panel shows selection gradients (β) per generation (green arrows) and average responses (Δz) per generation (black arrows) of populations sharing similar G-matrix structure, but at different starting points of a single-peaked adaptive landscape. Red arrows represent the net selection gradient (the sum of all selection gradients). Thus, the alignment between the direction of selection and the orientation of the G-matrix differs for each population. Responses to selection will thus vary between populations, in terms of its direction and magnitude. Some will evolve rapidly and directly to the peak (population b), others will evolve slowly (population a) due to differences in the amount of variation aligned with selection (evolvability sensu Hansen and Houle 2008). Population c will approach the peak in a non-linear way and its trajectory will be strongly deflected by the G-matrix in the direction of the line of least resistance. The line of least resistance equals the first principal component of a G-matrix and acts as an attractor of short-term evolutionary responses. We can expand this notion to multivariate systems and think of linear combinations of the first principal components as representing hyperplanes of least resistance. This notion is related to modularity, as principal components are related to modules but do not carry a one to one relation with each module (Berner 2011). Usually principal components are contrasts (positive loadings for one module and negative loadings for the other) between modules, and linear combinations between these contrasts define directions of independent change for each module. Note that the net selection gradients (red arrows) are much larger when selection is not aligned with the G-matrix’s main axis. Top right panel shows the same 3 populations, but in a rugged adaptive landscape. In this scenario, populations won’t always evolve to the closest peak (euclidean distance), but instead to those that are closest given the covariation among traits. Central panels illustrate the predictions of each model (transient constraints – left, and peak selection – right). Each point represents one species, with Y being the total magnitude of evolution, and X being the alignment of the evolutionary response (z) with the G-matrix. In the transient constraints model, you would not expect any particular relationship between the magnitude of evolutionary change and its direction, since every species would eventually reach the peak. Conversely, under the peak selection model (right side), species’ evolutionary trajectories may or may not be aligned with the G-matrix, but the magnitude of evolutionary change will be small when not aligned. Bottom panels show the predictions for both models (transient constraints to the left, and peak selection to the right) in terms of number of species observed in terms of their(z) and their alignment with the G-matrix.
What would we expect in terms of empirical patterns under each of these scenarios? If G-matrices only impose microevolutionary constraints and population/species eventually reach their single adaptive peak we would expect no particular relationship between the magnitude and direction of evolutionary change and its alignment with the G-matrix. We would also not expect any significant alignment of the species response to selection with the major axis of variation of the G-matrix. Evolution in this scenario would only depend on the position of the adaptive peak in relation to the population average. Alternatively, if G-matrices have enduring consequences at the macroevolutionary level by influencing the choice of peak, we would expect an association between the magnitude and direction of evolutionary change and its alignment with the major axis of the G-matrix (see Porto et al. 2015). Furthermore, species diversification should be biased in the directions of highest variation in the G-matrix. Evolutionary change would depend not only on the position of the adaptive peaks in regard to the current position of the population averages but also on the G-matrix structure, which would affect the probability of reaching the various peaks (Figure 3).
Does alignment with lines of least resistance imply constraint?
Comparisons of G-matrix orientation with the observed direction of evolutionary change, as described in the previous section, can be a fruitful way of testing these ideas. Several studies have compared morphological diversification to available genetic variation, and in several instances diversification was aligned with the “lines of least resistance” while others show diversification in alternate directions (Berner et al. 2010, Marroig & Cheverud 2010, Renaud et al. 2006, Schluter 1996). But this alignment is not necessarily due to constraints, since selection and constraint can act in the same direction (Marroig and Cheverud 2010, augmentation sensu Conner 2012). This would imply that species lie near the axis of major evolvability not due to constraint, but due to a ridge in the fitness surface (Conner 2012) or that at least some of the available peaks happened to be aligned with that direction, and thus the pattern is adaptive (Arnold et al. 2001, Marroig & Cheverud 2010). Likewise, when macroevolutionary diversification is not aligned with variation, it does not negate the possibility of the G-matrix imposing microevolutionary restrictions -- it could be that the position of adaptive peaks had some other pattern. Perhaps a more complete picture of what we are observing is one close to the peak selection model. Species don’t tend to follow the line of least resistance because they are constrained in that direction, in the sense of lacking variation in other directions of the morphospace (Marroig & Cheverud 2005, 2010). Instead, G-matrix and peak distribution interact, making the realized morphospace coverage much smaller that the full range of possibilities. We will now turn our attention to whether or not we can gain any information on past peak distribution from comparative quantitative genetic studies.
Differentiating between constraints, co-selection and drift
If the covariation between species is mirrored by the G-matrix, can we attribute this to constraints or to a common pattern of selection and covariation? In other words, can we examine the alignment of the orientation of the G-matrix with the distribution of peaks in the adaptive landscape? In theory, it should be possible to estimate covariation between selection in different clades (Figure 4) based on observed selection gradients, given some assumptions (Felsenstein 1988, Zeng 1988). While this only gives us access to the peaks that were eventually reached and are currently occupied by living species, this is valuable information that can help us to explain whether macroevolution is dominated by constraints or by an interaction between constraints and selection, as in the peak selection model (Marroig & Cheverud 2010). Under transient constraints, we should not expect any alignment between the G-matrix and the selective covariance matrix, since, given enough time, the populations should eventually reach their respective adaptive peak. Conversely, under peak selection, we would expect an alignment between the G-matrix and selective covariance matrix. We are aware of only two such tests reported to date (Hohenlohe & Arnold 2008, Marroig & Cheverud 2010).
Figure 4.
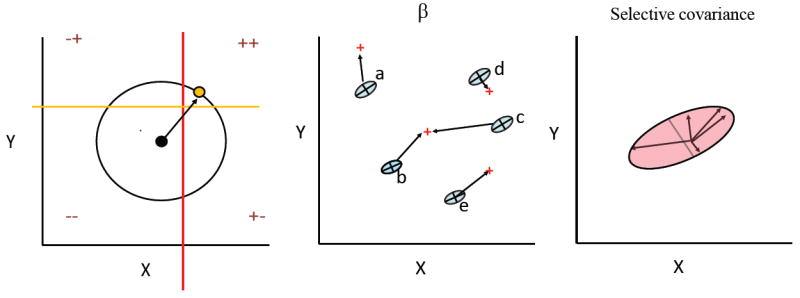
Traits will evolve together either because they are inherited together (G-matrix) or because they are selected together (selective covariance). Panel A illustrates the idea of selective covariance. Traits X and Y are genetically independent. The black dot indicates the average before selection. + and – signs indicate the direction of increase in fitness for each trait. Thus, selection is favoring the joint increase of X and Y, and the population will evolve a new average phenotype (yellow dot). The term selective covariance was coined by Felsenstein (1988, see also Zeng 1988). If we have evidence that the G-matrix is relatively stable during macroevolution, equation V=GCG captures the covariance of changes in the averages of the species (V-matrix) in terms of its two potential (non-excluding) sources: inheritance (G-matrix) and selective covariance (C-matrix). Theoretically, if we have a reasonable estimate of the G-matrix and of the phylogenetic relationships, we can compute the V-matrix and thus solve the Zeng-Felsenstein equation to compute C=G-1VG-1. C is the covariance of slopes of log W viz., the covariance among the selection gradients operating upon each species. Panels B and C illustrate this with selection gradients on panel b and the selective covariance matrix represented on panel C (pink ellipse).
Comparative approaches establishing a relationship between lines of least resistance and divergence patterns have other important limitations. Most significantly, random genetic drift can create an association between the orientation of the G-matrix and the patterns of between species divergence, given stable patterns of genetic covariation. This occurs because evolutionary divergence under drift is expected to be proportional to the ancestral pattern of variation and covariation among traits (Figure 2), and, therefore, an observed association between the orientation of the G-matrix and divergence can be a direct product of neutral evolution. While most biologists would agree that morphology is usually under selection, it is useful to examine the potential consequences of drift and how it relates to modularity. Simulation work suggests that if genetic drift is the only evolutionary process operating, modularity patterns would not be stable, and patterns of association would vary widely across closely related populations or taxa (Jones et al. 2003, Melo & Marroig 2015). This is clearly not observed in nature (see above). But what if modularity is maintained by stabilizing selection and trait means are free to change by genetic drift? In this situation, divergence among populations would be largest along directions where ancestral genetic variation is abundant, and smaller in direction of low ancestral variation (Arnold et al. 2001, Lande 1976). There are methods for distinguishing drift from selection in quantitative traits (Ackermann & Cheverud 2004, Bartoszek et al. 2012, Hohenlohe & Arnold 2008, Karhunen et al. 2013) but most of them are not well suited to high dimensional systems, or do not take the influence of genetic covariation into account, or require a large number of individuals distributed in a large number of species. For example, the approach from Hohenlohe & Arnold (2008, MIPoD) explicitly models evolution under drift to predict a probability distribution for the divergence of population averages, given a phylogeny, the G-matrix and an estimate of effective population size. This is an elegant solution that can test whether divergence among groups is compatible with drift and the current G-matrix, but it can only be applied in full force with two characters at a time. With few exceptions (Bartoszek et al. 2012, Hohenlohe & Arnold 2008), most phylogenetic methods fail to take genetic covariation into account, limiting our understanding of macroevolution. By modeling evolution under a univariate brownian motion model, for example, we assume that no selection is operating (but see Butler & King 2004, Hansen 1997) and that traits are evolving independently. Some advances have been made in the past decade (Bartoszek et al. 2012, Cressler et al. 2015, Hohenlohe & Arnold 2008) but we still lack comparative methods that balance the external aspect of selection (niche shifts on OU models, Butler & King 2004, Hansen 1997), with the populational consequences of modularity.
Conclusion
Placing micro- and macroevolution into a common framework is essential for our understanding of the influence of genetic and developmental constraints on multivariate evolution. Quantitative genetic theory has long been interested in the variational properties of organisms and recent studies using the conceptual umbrella of modularity have extrapolated its breadth to include long-term evolutionary change. While empirical results led us to discard the notion that variational patterns are set in stone and act as absolute constraints, they have also made us abandon the idea that adaptive landscapes can be characterized by simple and stable selective peaks, or that variational properties are largely unimportant considerations for evolutionary change. Embracing the dynamic nature of variational patterns, their context dependency, as well as their relationship with genetics, development and evolution will allow us to bridge these two levels of the hierarchy in a systematic way. One of the challenges going forward is the incorporation of mechanistic models of development into models of how variation emerges and how it influences the shape of population variation and adaptive landscapes. Another major challenge will be discriminating the relative contribution of constraints, selection and neutral processes in determining the path of multivariate evolution. We propose that this challenge will only be met when we know more about the true shape of adaptive landscapes, including the number, height and distribution of peaks (see Laughlin & Messier 2015, Pfaender et al. 2016), as well as incorporate modularity into our thinking.
Acknowledgments
Thanks to Madeline Keleher, Devin Dobias for discussions and helpful comments, and to Ana Paula Assis and Guilherme Garcia for help with figures. D. Melo was supported by FAPESP grant 2014/26262-4. A. Porto was supported by the National Institute of Dental and Craniofacial Research of the National Institutes of Health, award number F31DE024944. G. Marroig was supported by FAPESP grant 2011/14295-7.
Bibliography
- Ackermann RR, Cheverud JM. Detecting genetic drift versus selection in human evolution. Proc Natl Acad Sci U S A. 2004;101(52):17946–51. doi: 10.1073/pnas.0405919102. [DOI] [PMC free article] [PubMed] [Google Scholar]
- Adams D, Rohlf F, Slice D. A field comes of age: geometric morphometrics in the 21st century. Hystrix, the Italian Journal of Mammalogy. 2013;24:7–14. [Google Scholar]
- Alberch P. From genes to phenotype: dynamical systems and evolvability. Genetica. 1991;84(1):5–11. doi: 10.1007/BF00123979. [DOI] [PubMed] [Google Scholar]
- Armbruster S, Pelabon C, Hansen T, Mulder C. Floral integration, modularity, and accuracy: distinguishing complex adaptations from genetic constraints. In: Pigliucci M, Preston K, editors. Phenotypic Integration: Studying the Ecology and Evolution of Complex Phenotypes. New York: Oxford University Press; 2004. pp. 23–49. [Google Scholar]
- Arnold SJ. Phenotypic evolution: the ongoing synthesis (American Society of Naturalists address) Am Nat. 2014;183(6):729–46. doi: 10.1086/675304. [DOI] [PubMed] [Google Scholar]
- Arnold SJ, Bürger R, Hohenlohe PA, Ajie BC, Jones AG. Understanding the evolution and stability of the G-matrix. Evolution. 2008;62(10):2451–61. doi: 10.1111/j.1558-5646.2008.00472.x. [DOI] [PMC free article] [PubMed] [Google Scholar]
- Arnold SJ, Pfrender ME, Jones AG. The adaptive landscape as a conceptual bridge between micro- and macroevolution. Genetica. 2001;112-113:9–32. [PubMed] [Google Scholar]
- Ayroles JF, Buchanan SM, O’Leary C, Skutt-Kakaria K, Grenier JK, et al. Behavioral idiosyncrasy reveals genetic control of phenotypic variability. Proc Natl Acad Sci U S A. 2015;112(21):6706–11. doi: 10.1073/pnas.1503830112. [DOI] [PMC free article] [PubMed] [Google Scholar]
- Ayroles JF, Carbone MA, Stone EA, Jordan KW, Lyman RF, et al. Systems genetics of complex traits in Drosophila melanogaster. Nat Genet. 2009;41(3):299–307. doi: 10.1038/ng.332. [DOI] [PMC free article] [PubMed] [Google Scholar]
- Bartoszek K, Pienaar J, Mostad P, Andersson S, Hansen TF. A phylogenetic comparative method for studying multivariate adaptation. J Theor Biol. 2012;314:204–15. doi: 10.1016/j.jtbi.2012.08.005. [DOI] [PubMed] [Google Scholar]
- Beldade P, Brakefield PM. The genetics and evo-devo of butterfly wing patterns. Nat Rev Genet. 2002;3(6):442–52. doi: 10.1038/nrg818. [DOI] [PubMed] [Google Scholar]
- Beldade P, Koops K, Brakefield PM. Modularity, individuality, and evo-devo in butterfly wings. Proc Natl Acad Sci U S A. 2002;99(22):14262–67. doi: 10.1073/pnas.222236199. [DOI] [PMC free article] [PubMed] [Google Scholar]
- Berner D. Size correction in biology: how reliable are approaches based on (common) principal component analysis? Oecologia. 2011;166(4):961–71. doi: 10.1007/s00442-011-1934-z. [DOI] [PubMed] [Google Scholar]
- Berner D, Kaeuffer R, Grandchamp A-C, Raeymaekers JAM, Räsänen K, Hendry AP. Quantitative genetic inheritance of morphological divergence in a lake-stream stickleback ecotype pair: implications for reproductive isolation. J Evol Biol. 2011;24(9):1975–83. doi: 10.1111/j.1420-9101.2011.02330.x. [DOI] [PubMed] [Google Scholar]
- Berner D, Stutz WE, Bolnick DI. Foraging trait (co)variances in stickleback evolve deterministically and do not predict trajectories of adaptive diversification. Evolution. 2010;64(8):2265–77. doi: 10.1111/j.1558-5646.2010.00982.x. [DOI] [PubMed] [Google Scholar]
- Björklund M, Husby A, Gustafsson L. Rapid and unpredictable changes of the G-matrix in a natural bird population over 25 years. J Evol Biol. 2013;26(1):1–13. doi: 10.1111/jeb.12044. [DOI] [PubMed] [Google Scholar]
- Blows MW, Hoffmann AA. A REASSESSMENT OF GENETIC LIMITS TO EVOLUTIONARY CHANGE. Ecology. 2005;86(6):1371–84. [Google Scholar]
- Bolstad GH, Cassara JA, Márquez E, Hansen TF, van der Linde K, et al. Complex constraints on allometry revealed by artificial selection on the wing of Drosophila melanogaster. Proc Natl Acad Sci U S A. 2015;112(43):13284–89. doi: 10.1073/pnas.1505357112. [DOI] [PMC free article] [PubMed] [Google Scholar]
- Bolstad GH, Hansen TF, Pélabon C, Falahati-Anbaran M, Pérez-Barrales R, Armbruster WS. Genetic constraints predict evolutionary divergence in Dalechampia blossoms. Philos Trans R Soc Lond, B, Biol Sci. 2014;369(1649):20130255. doi: 10.1098/rstb.2013.0255. [DOI] [PMC free article] [PubMed] [Google Scholar]
- Bookstein FL. Morphometric Tools for Landmark Data: Geometry and Biology. Cambridge University Press; 1997. [Google Scholar]
- Bulmer MG. The Effect of Selection on Genetic Variability. The American Naturalist 1971 [Google Scholar]
- Butler MA, King AA. Phylogenetic Comparative Analysis: A Modeling Approach for Adaptive Evolution. Am Nat. 2004;164(6):683–95. doi: 10.1086/426002. [DOI] [PubMed] [Google Scholar]
- Calsbeek B, Goodnight CJ. Empirical comparison of G matrix test statistics: finding biologically relevant change. Evolution. 2009;63(10):2627–35. doi: 10.1111/j.1558-5646.2009.00735.x. [DOI] [PubMed] [Google Scholar]
- Chenoweth SF, Rundle HD, Blows MW. The contribution of selection and genetic constraints to phenotypic divergence. Am Nat. 2010;175(2):186–96. doi: 10.1086/649594. [DOI] [PubMed] [Google Scholar]
- Cheverud J, Richtsmeier J. Finite-element scaling applied to sexual dimorphism in rhesus macaque (Macaca mulatta) facial growth. Syst Biol. 1986;35(3):381–399. [Google Scholar]
- Cheverud JM. Phenotypic, Genetic, and Environmental Morphological Integration in the Cranium. Evolution. 1982;36(3):499. doi: 10.1111/j.1558-5646.1982.tb05070.x. [DOI] [PubMed] [Google Scholar]
- Cheverud JM. Quantitative genetics and developmental constraints on evolution by selection. J Theor Biol. 1984;110(2):155–71. doi: 10.1016/s0022-5193(84)80050-8. [DOI] [PubMed] [Google Scholar]
- Cheverud JM. A comparative analysis of morphological variation patterns in the papionins. Evolution. 1989;43(8):1737. doi: 10.1111/j.1558-5646.1989.tb02623.x. [DOI] [PubMed] [Google Scholar]
- Cheverud JM. Developmental Integration and the Evolution of Pleiotropy. Am Zool. 1996;36(1):44–50. [Google Scholar]
- Cheverud JM, Marroig G. Comparing covariance matrices: random skewers method compared to the common principal components model. Genet Mol Biol. 2007;30(2):461–69. [Google Scholar]
- Conner JK. Quantitative genetic approaches to evolutionary constraint: how useful? Evolution. 2012;66(11):3313–20. doi: 10.1111/j.1558-5646.2012.01794.x. [DOI] [PubMed] [Google Scholar]
- Cressler CE, Butler MA, King AA. Detecting Adaptive Evolution in Phylogenetic Comparative Analysis Using the Ornstein-Uhlenbeck Model. Syst Biol. 2015;64(6):953–68. doi: 10.1093/sysbio/syv043. [DOI] [PubMed] [Google Scholar]
- Eroukhmanoff F, Svensson EI. Evolution and stability of the G-matrix during the colonization of a novel environment. J Evol Biol. 2011;24(6):1363–73. doi: 10.1111/j.1420-9101.2011.02270.x. [DOI] [PubMed] [Google Scholar]
- Felsenstein J. Phylogenies and Quantitative Characters. Annu Rev Ecol Syst. 1988;19(1):445–71. [Google Scholar]
- Garcia G, Hingst-Zaher E, Cerqueira R, Marroig G. Quantitative Genetics and Modularity in Cranial and Mandibular Morphology of Calomys expulsus. Evol Biol. 2014;41(4):619–36. [Google Scholar]
- Grant PR, Grant BR. Predicting Microevolutionary Responses to Directional Selection on Heritable Variation. Evolution. 1995;49(2):241. doi: 10.1111/j.1558-5646.1995.tb02236.x. [DOI] [PubMed] [Google Scholar]
- Hallgrímsson B, Jamniczky H, Young NM, Rolian C, Parsons TE, et al. Deciphering the Palimpsest: Studying the Relationship Between Morphological Integration and Phenotypic Covariation. Evol Biol. 2009;36(4):355–76. doi: 10.1007/s11692-009-9076-5. [DOI] [PMC free article] [PubMed] [Google Scholar]
- Hallgrímsson B, Jamniczky HA, Young NM, Rolian C, Schmidt-Ott U, Marcucio RS. The generation of variation and the developmental basis for evolutionary novelty. J Exp Zool B Mol Dev Evol. 2012;318(6):501–17. doi: 10.1002/jez.b.22448. [DOI] [PMC free article] [PubMed] [Google Scholar]
- Hansen TF. Stabilizing Selection and the Comparative Analysis of Adaptation. Evolution. 1997;51(5):1341–51. doi: 10.1111/j.1558-5646.1997.tb01457.x. [DOI] [PubMed] [Google Scholar]
- Hansen TF. Is modularity necessary for evolvability? Remarks on the relationship between pleiotropy and evolvability. BioSystems. 2003;69(2-3):83–94. doi: 10.1016/s0303-2647(02)00132-6. [DOI] [PubMed] [Google Scholar]
- Hansen TF. Why epistasis is important for selection and adaptation. Evolution. 2013;67(12):3501–11. doi: 10.1111/evo.12214. [DOI] [PubMed] [Google Scholar]
- Hansen TF, Alvarez-Castro JM, Carter AJR, Hermisson J, Wagner GP. Evolution of genetic architecture under directional selection. Evolution. 2006;60(8):1523–36. [PubMed] [Google Scholar]
- Hansen TF, Pélabon C, Armbruster WS, Carlson ML. Evolvability and genetic constraint in Dalechampia blossoms: components of variance and measures of evolvability. J Evol Biol. 2003;16(4):754–66. doi: 10.1046/j.1420-9101.2003.00556.x. [DOI] [PubMed] [Google Scholar]
- Hazel LN. The Genetic Basis for Constructing Selection Indexes. Genetics. 1943;28(6):476–90. doi: 10.1093/genetics/28.6.476. [DOI] [PMC free article] [PubMed] [Google Scholar]
- Hohenlohe PA, Arnold SJ. MIPoD: a hypothesis-testing framework for microevolutionary inference from patterns of divergence. Am Nat. 2008;171(3):366–85. doi: 10.1086/527498. [DOI] [PMC free article] [PubMed] [Google Scholar]
- Houle D, Meyer K. Estimating sampling error of evolutionary statistics based on genetic covariance matrices using maximum likelihood. J Evol Biol. 2015;28(8):1542–49. doi: 10.1111/jeb.12674. [DOI] [PubMed] [Google Scholar]
- Ihmels J, Friedlander G, Bergmann S, Sarig O, Ziv Y, Barkai N. Revealing modular organization in the yeast transcriptional network. Nat Genet. 2002;31(4):370–77. doi: 10.1038/ng941. [DOI] [PubMed] [Google Scholar]
- Jones AG, Arnold SJ, Bürger R. Stability of the G-matrix in a population experiencing pleiotropic mutation, stabilizing selection, and genetic drift. Evolution. 2003;57(8):1747–60. doi: 10.1111/j.0014-3820.2003.tb00583.x. [DOI] [PubMed] [Google Scholar]
- Jones AG, Arnold SJ, Bürger R. Evolution and stability of the G-matrix on a landscape with a moving optimum. Evolution. 2004;58(8):1639–54. doi: 10.1111/j.0014-3820.2004.tb00450.x. [DOI] [PubMed] [Google Scholar]
- Jones AG, Bürger R, Arnold SJ. Epistasis and natural selection shape the mutational architecture of complex traits. Nat Commun. 2014;5:3709. doi: 10.1038/ncomms4709. [DOI] [PMC free article] [PubMed] [Google Scholar]
- Jones AG, Bürger R, Arnold SJ, Hohenlohe PA, Uyeda JC. The effects of stochastic and episodic movement of the optimum on the evolution of the G-matrix and the response of the trait mean to selection. J Evol Biol. 2012;25(11):2210–31. doi: 10.1111/j.1420-9101.2012.02598.x. [DOI] [PMC free article] [PubMed] [Google Scholar]
- Juenger T, Pérez-Pérez JM, Bernal S, Micol JL. Quantitative trait loci mapping of floral and leaf morphology traits in Arabidopsis thaliana: evidence for modular genetic architecture. Evol Dev. 2005;7(3):259–71. doi: 10.1111/j.1525-142X.2005.05028.x. [DOI] [PubMed] [Google Scholar]
- Karhunen M, Merilä J, Leinonen T, Cano JM, Ovaskainen O. DRIFTSEL: an R package for detecting signals of natural selection in quantitative traits. Mol Ecol Resour. 2013;13(4):746–54. doi: 10.1111/1755-0998.12111. [DOI] [PubMed] [Google Scholar]
- Kauffman S, Levin S. Towards a general theory of adaptive walks on rugged landscapes. J Theor Biol. 1987;128(1):11–45. doi: 10.1016/s0022-5193(87)80029-2. [DOI] [PubMed] [Google Scholar]
- Kendall DG. Shape manifolds, procrustean metrics, and complex projective spaces. Bulletin of the London Mathematical Society. 1984;16:81–121. [Google Scholar]
- Kingsolver JG, Diamond SE, Siepielski AM, Carlson SM. Synthetic analyses of phenotypic selection in natural populations: lessons, limitations and future directions. Evol Ecol. 2012;26(5):1101–18. [Google Scholar]
- Kingsolver JG, Hoekstra HE, Hoekstra JM, Berrigan D, Vignieri SN, et al. The strength of phenotypic selection in natural populations. Am Nat. 2001;157(3):245–61. doi: 10.1086/319193. [DOI] [PubMed] [Google Scholar]
- Klingenberg CP. Morphometric integration and modularity in configurations of landmarks: tools for evaluating a priori hypotheses. Evol Dev. 2009;11(4):405–21. doi: 10.1111/j.1525-142X.2009.00347.x. [DOI] [PMC free article] [PubMed] [Google Scholar]
- Lande R. Natural Selection and Random Genetic Drift in Phenotypic Evolution. Evolution. 1976;30(2):314. doi: 10.1111/j.1558-5646.1976.tb00911.x. [DOI] [PubMed] [Google Scholar]
- Lande R. Quantitative Genetic Analysis of Multivariate Evolution, Applied to Brain: Body Size Allometry. Evolution. 1979;33(1):402. doi: 10.1111/j.1558-5646.1979.tb04694.x. [DOI] [PubMed] [Google Scholar]
- Lande R, Arnold SJ. The Measurement of Selection on Correlated Characters. Evolution. 1983;37(6):1210. doi: 10.1111/j.1558-5646.1983.tb00236.x. [DOI] [PubMed] [Google Scholar]
- Langfelder P, Horvath S. WGCNA: an R package for weighted correlation network analysis. BMC Bioinformatics. 2008;9:559. doi: 10.1186/1471-2105-9-559. [DOI] [PMC free article] [PubMed] [Google Scholar]
- Laughlin DC, Messier J. Fitness of multidimensional phenotypes in dynamic adaptive landscapes. Trends Ecol Evol (Amst) 2015;30(8):487–96. doi: 10.1016/j.tree.2015.06.003. [DOI] [PubMed] [Google Scholar]
- Lele S, Richtsmeier JT. Euclidean distance matrix analysis: A coordinate-free approach for comparing biological shapes using landmark data. American Journal of Physical Anthropology. 1991;86:415–27. doi: 10.1002/ajpa.1330860307. [DOI] [PubMed] [Google Scholar]
- Mackay TFC, Stone EA, Ayroles JF. The genetics of quantitative traits: challenges and prospects. Nat Rev Genet. 2009;10(8):565–77. doi: 10.1038/nrg2612. [DOI] [PubMed] [Google Scholar]
- MacMahon M, Garlaschelli D. Community Detection for Correlation Matrices. Phys Rev X. 2015;5(2):021006. [Google Scholar]
- Magwene PM. New tools for studying integration and modularity. Evolution. 2001;55(9):1734–45. doi: 10.1111/j.0014-3820.2001.tb00823.x. [DOI] [PubMed] [Google Scholar]
- Márquez EJ. A statistical framework for testing modularity in multidimensional data. Evolution. 2008;62(10):2688–2708. doi: 10.1111/j.1558-5646.2008.00476.x. [DOI] [PubMed] [Google Scholar]
- Márquez EJ, Cabeen R, Woods RP, Houle D. The Measurement of Local Variation in Shape. Evol Biol. 2012;39(3):419–39. doi: 10.1007/s11692-012-9159-6. [DOI] [PMC free article] [PubMed] [Google Scholar]
- Marroig G, Cheverud JM. A comparison of phenotypic variation and covariation patterns and the role of phylogeny, ecology, and ontogeny during cranial evolution of new world monkeys. Evolution. 2001;55(12):2576–2600. doi: 10.1111/j.0014-3820.2001.tb00770.x. [DOI] [PubMed] [Google Scholar]
- Marroig G, Cheverud JM. Size as a line of least evolutionary resistance: diet and adaptive morphological radiation in New World monkeys. Evolution. 2005;59(5):1128–42. [PubMed] [Google Scholar]
- Marroig G, Cheverud J. Size as a line of least resistance II: direct selection on size or correlated response due to constraints? Evolution. 2010;64(5):1470–88. doi: 10.1111/j.1558-5646.2009.00920.x. [DOI] [PubMed] [Google Scholar]
- Marroig G, Melo DAR, Garcia G. Modularity, noise, and natural selection. Evolution. 2012;66(5):1506–24. doi: 10.1111/j.1558-5646.2011.01555.x. [DOI] [PubMed] [Google Scholar]
- Martin CH, Wainwright PC. Multiple fitness peaks on the adaptive landscape drive adaptive radiation in the wild. Science. 2013;339(6116):208–11. doi: 10.1126/science.1227710. [DOI] [PubMed] [Google Scholar]
- Matamoro-Vidal A, Salazar-Ciudad I, Houle D. Making quantitative morphological variation from basic developmental processes: Where are we? The case of the Drosophila wing. Dev Dyn. 2015;244(9):1058–1073. doi: 10.1002/dvdy.24255. [DOI] [PMC free article] [PubMed] [Google Scholar]
- Maxwell TJ, Ballantyne CM, Cheverud JM, Guild CS, Ndumele CE, Boerwinkle E. APOE modulates the correlation between triglycerides, cholesterol, and CHD through pleiotropy, and gene-by-gene interactions. Genetics. 2013;195(4):1397–1405. doi: 10.1534/genetics.113.157719. [DOI] [PMC free article] [PubMed] [Google Scholar]
- Mayr E. Animal Species and Evolution. Vol. 797. Belknap Press of Harvard University Press; Cambridge, Massachusetts: 1963. [Google Scholar]
- Melo D, Marroig G. Directional selection can drive the evolution of modularity in complex traits. Proc Natl Acad Sci U S A. 2015;112(2):470–75. doi: 10.1073/pnas.1322632112. [DOI] [PMC free article] [PubMed] [Google Scholar]
- Mitteroecker P. The Developmental Basis of Variational Modularity: Insights from Quantitative Genetics, Morphometrics, and Developmental Biology. Evol Biol. 2009;36(4):377–85. [Google Scholar]
- Mitteroecker P, Bookstein F. The conceptual and statistical relationship between modularity and morphological integration. Syst Biol. 2007;56(5):818–36. doi: 10.1080/10635150701648029. [DOI] [PubMed] [Google Scholar]
- Olson R, Miller E. Morphological Integration. University of Chicago Press; Chicago: 1958. [Google Scholar]
- Paaby AB, Rockman MV. The many faces of pleiotropy. Trends Genet. 2013;29(2):66–73. doi: 10.1016/j.tig.2012.10.010. [DOI] [PMC free article] [PubMed] [Google Scholar]
- Pavlicev M, Cheverud JM, Wagner GP. Evolution of adaptive phenotypic variation patterns by direct selection for evolvability. Proc Biol Sci. 2011a;278(1713):1903–12. doi: 10.1098/rspb.2010.2113. [DOI] [PMC free article] [PubMed] [Google Scholar]
- Pavlicev M, Hansen TF. Genotype-Phenotype Maps Maximizing Evolvability: Modularity Revisited. Evol Biol. 2011;38(4):371–89. [Google Scholar]
- Pavlicev M, Kenney-Hunt JP, Norgard EA, Roseman CC, Wolf JB, Cheverud JM. Genetic variation in pleiotropy: differential epistasis as a source of variation in the allometric relationship between long bone lengths and body weight. Evolution. 2008;62(1):199–213. doi: 10.1111/j.1558-5646.2007.00255.x. [DOI] [PubMed] [Google Scholar]
- Pavlicev M, Norgard EA, Fawcett GL, Cheverud JM. Evolution of pleiotropy: epistatic interaction pattern supports a mechanistic model underlying variation in genotype-phenotype map. J Exp Zool B Mol Dev Evol. 2011b;316(5):371–85. doi: 10.1002/jez.b.21410. [DOI] [PMC free article] [PubMed] [Google Scholar]
- Pavličev M, Cheverud JM. Constraints Evolve: Context Dependency of Gene Effects Allows Evolution of Pleiotropy. Annu Rev Ecol Evol Syst. 2015;46(1):413–34. [Google Scholar]
- Pearson K. Mathematical Contributions to the Theory of Evolution. III. Regression, Heredity, and Panmixia. Philosophical Transactions of the Royal Society A: Mathematical, Physical and Engineering Sciences. 1896;187(0):253–318. [Google Scholar]
- Pepin KM, Samuel MA, Wichman HA. Variable pleiotropic effects from mutations at the same locus hamper prediction of fitness from a fitness component. Genetics. 2006;172(4):2047–56. doi: 10.1534/genetics.105.049817. [DOI] [PMC free article] [PubMed] [Google Scholar]
- Pfaender J, Hadiaty RK, Schliewen UK, Herder F. Rugged adaptive landscapes shape a complex, sympatric radiation. Proc Biol Sci. 2016;283(1822) doi: 10.1098/rspb.2015.2342. [DOI] [PMC free article] [PubMed] [Google Scholar]
- Phillips PC, Whitlock MC, Fowler K. Inbreeding changes the shape of the genetic covariance matrix in Drosophila melanogaster. Genetics. 2001;158(3):1137–45. doi: 10.1093/genetics/158.3.1137. [DOI] [PMC free article] [PubMed] [Google Scholar]
- Polly PD. Developmental Dynamics and G-Matrices: Can Morphometric Spaces be Used to Model Phenotypic Evolution? Evol Biol. 2008;35(2):83–96. [Google Scholar]
- Porto A, de Oliveira FB, Shirai LT, De Conto V, Marroig G. The Evolution of Modularity in the Mammalian Skull I: Morphological Integration Patterns and Magnitudes. Evol Biol. 2009;36(1):118–35. [Google Scholar]
- Porto A, Sebastião H, Pavan SE, VandeBerg JL, Marroig G, Cheverud JM. Rate of evolutionary change in cranial morphology of the marsupial genus Monodelphis is constrained by the availability of additive genetic variation. J Evol Biol. 2015;28(4):973–85. doi: 10.1111/jeb.12628. [DOI] [PMC free article] [PubMed] [Google Scholar]
- Porto A, Shirai LT, de Oliveira FB, Marroig G. Size variation, growth strategies, and the evolution of modularity in the mammalian skull. Evolution. 2013;67(11):3305–22. doi: 10.1111/evo.12177. [DOI] [PubMed] [Google Scholar]
- Reichardt J, Bornholdt S. Statistical mechanics of community detection. Phys Rev E. 2006;74(1):016110. doi: 10.1103/PhysRevE.74.016110. [DOI] [PubMed] [Google Scholar]
- Renaud S, Auffray J-C, Michaux J. Conserved phenotypic variation patterns, evolution along lines of least resistance, and departure due to selection in fossil rodents. Evolution. 2006;60(8):1701–17. [PubMed] [Google Scholar]
- Riedl R. Order in living systems: A systems analysis of evolution. Wiley; New York: 1978. [Google Scholar]
- Salazar-Ciudad I, Jernvall J. A gene network model accounting for development and evolution of mammalian teeth. Proc Natl Acad Sci U S A. 2002;99(12):8116–20. doi: 10.1073/pnas.132069499. [DOI] [PMC free article] [PubMed] [Google Scholar]
- Salazar-Ciudad I, Jernvall J. A computational model of teeth and the developmental origins of morphological variation. Nature. 2010;464(7288):583–86. doi: 10.1038/nature08838. [DOI] [PubMed] [Google Scholar]
- Schäfer J, Strimmer K. A shrinkage approach to large-scale covariance matrix estimation and implications for functional genomics. Stat Appl Genet Mol Biol. 2005;4 doi: 10.2202/1544-6115.1175. Article32. [DOI] [PubMed] [Google Scholar]
- Schluter D. Adaptive Radiation Along Genetic Lines of Least Resistance. Evolution. 1996;50(5):1766. doi: 10.1111/j.1558-5646.1996.tb03563.x. [DOI] [PubMed] [Google Scholar]
- Shaw RG, Geyer CJ. Inferring fitness landscapes. Evolution. 2010;64(9):2510–20. doi: 10.1111/j.1558-5646.2010.01010.x. [DOI] [PubMed] [Google Scholar]
- Simpson GG. The Study of Evolution: Methods and Present Status of Theory. Yale Univ. Press; New Haven: 1958. [Google Scholar]
- Stearns FW. One hundred years of pleiotropy: a retrospective. Genetics. 2010;186(3):767–73. doi: 10.1534/genetics.110.122549. [DOI] [PMC free article] [PubMed] [Google Scholar]
- Steppan SJ, Phillips PC, Houle D. Comparative quantitative genetics: evolution of the G matrix. Trends Ecol Evol (Amst) 2002;17(7):320–27. [Google Scholar]
- Templeton AR, Crease TJ, Shah F. The molecular through ecological genetics of abnormal abdomen in Drosophila mercatorum. I. Basic genetics. Genetics. 1985;111(4):805–18. doi: 10.1093/genetics/111.4.805. [DOI] [PMC free article] [PubMed] [Google Scholar]
- Turelli M. Phenotypic Evolution, Constant Covariances, and the Maintenance of Additive Variance. Evolution. 1988;42(6):1342. doi: 10.1111/j.1558-5646.1988.tb04193.x. [DOI] [PubMed] [Google Scholar]
- Van der Linde K, Houle D. Inferring the Nature of Allometry from Geometric Data. Evol Biol. 2009;36(3):311–22. [Google Scholar]
- Wagner GP. The developmental genetics of homology. Nat Rev Genet. 2007;8(6):473–79. doi: 10.1038/nrg2099. [DOI] [PubMed] [Google Scholar]
- Wagner GP, Altenberg L. Perspective: Complex Adaptations and the Evolution of Evolvability. Evolution. 1996;50(3):967. doi: 10.1111/j.1558-5646.1996.tb02339.x. [DOI] [PubMed] [Google Scholar]
- Wagner GP, Pavlicev M, Cheverud JM. The road to modularity. Nat Rev Genet. 2007;8(12):921–31. doi: 10.1038/nrg2267. [DOI] [PubMed] [Google Scholar]
- Wang Z, Liao B-Y, Zhang J. Genomic patterns of pleiotropy and the evolution of complexity. Proc Natl Acad Sci U S A. 2010;107(42):18034–39. doi: 10.1073/pnas.1004666107. [DOI] [PMC free article] [PubMed] [Google Scholar]
- Watson RA, Wagner GP, Pavlicev M, Weinreich DM, Mills R. The evolution of phenotypic correlations and “developmental memory”. Evolution. 2014;68(4):1124–38. doi: 10.1111/evo.12337. [DOI] [PMC free article] [PubMed] [Google Scholar]
- Weldon WFR. On Certain Correlated Variations in Carcinus maenas. Proceedings of the Royal Society of London. 1893;54(326-330):318–29. [Google Scholar]
- Whitlock MC, Phillips PC, Fowler K. Persistence of changes in the genetic covariance matrix after a bottleneck. Evolution. 2002;56(10):1968–75. doi: 10.1111/j.0014-3820.2002.tb00122.x. [DOI] [PubMed] [Google Scholar]
- Wolf JB, Leamy LJ, Routman EJ, Cheverud JM. Epistatic pleiotropy and the genetic architecture of covariation within early and late-developing skull trait complexes in mice. Genetics. 2005;171(2):683–94. doi: 10.1534/genetics.104.038885. [DOI] [PMC free article] [PubMed] [Google Scholar]
- Wright S. The Roles of Mutation, Inbreeding, Crossbreeding and Selection in Evolution. Proceedings of the VI International Congress of Genetics. 1932;1:356–366. [Google Scholar]
- Young NM, Hallgrímsson B. Serial homology and the evolution of mammalian limb covariation structure. Evolution. 2005;59(12):2691–2704. [PubMed] [Google Scholar]
- Zeng Z-B. Long-Term Correlated Response, Interpopulation Covariation, and Interspecific Allometry. Evolution. 1988;42(2):363–74. doi: 10.1111/j.1558-5646.1988.tb04139.x. [DOI] [PubMed] [Google Scholar]