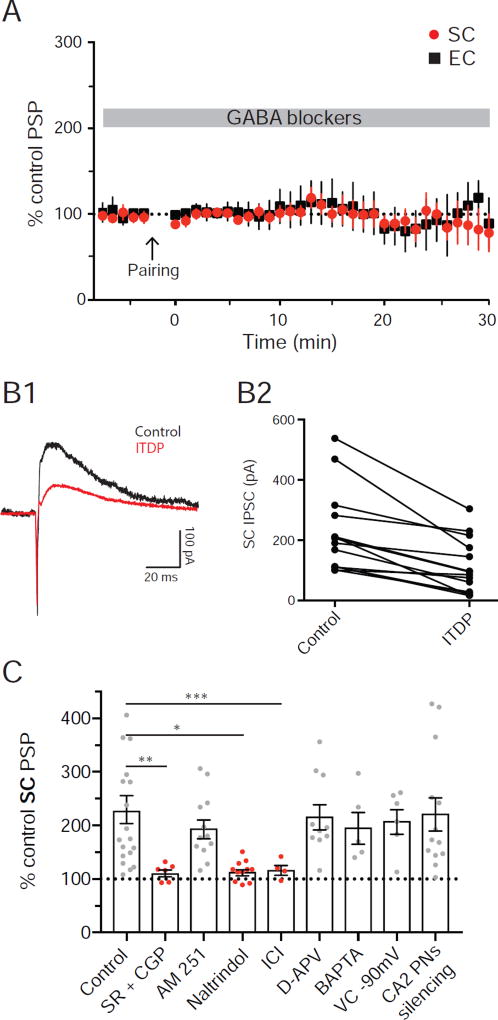
Figure 2. Mechanisms of ITDP in CA2 PNs.
A. Time course of the average normalized PSPs amplitudes obtained in whole-cell current-clamp following ITDP induction in the presence of GABA blockers. B. Whole-cell voltage-clamp recordings of CA2 PNs IPSCs at a holding potential of −10 mV. IPSCs are induced by SC stimulation (B1). Amplitude of the SC IPSCs is compared before and after ITDP (B2). Empty circle is the cell shown in B1. C. Normalized SC PSP amplitudes following ITDP induction in the presence of different drugs or with the CA2 PNs silenced by inhibitory DREADDs. Data are represented as mean ± SEM. See also Figure S2.

