Significance
The inability to accurately monitor glioblastoma tumor progression vs. pseudoprogression has severely limited clinical treatment decisions, especially in the setting of immunotherapy. We have identified a novel noninvasive imaging combination that could distinguish intracranial immune responses from tumor progression in mice bearing orthotopic gliomas and in patients with glioblastomas. We combined the use of advanced MRI with PET imaging of deoxycytidine kinase, an enzyme overexpressed in immune cells. This combination resulted in superior differentiation between immune responses and tumors within the brain, and identified peripheral lymph nodes in which immune responses occurred after immunotherapy combinations. This combined imaging approach may provide a useful method to clinically monitor patients with glioblastomas treated with immune-based therapies, and to distinguish tumor progression from pseudoprogression.
Keywords: glioblastoma, PET, MRI, immunotherapy, checkpoint blockade
Abstract
Contrast-enhanced MRI is typically used to follow treatment response and progression in patients with glioblastoma (GBM). However, differentiating tumor progression from pseudoprogression remains a clinical dilemma largely unmitigated by current advances in imaging techniques. Noninvasive imaging techniques capable of distinguishing these two conditions could play an important role in the clinical management of patients with GBM and other brain malignancies. We hypothesized that PET probes for deoxycytidine kinase (dCK) could be used to differentiate immune inflammatory responses from other sources of contrast-enhancement on MRI. Orthotopic malignant gliomas were established in syngeneic immunocompetent mice and then treated with dendritic cell (DC) vaccination and/or PD-1 mAb blockade. Mice were then imaged with [18F]-FAC PET/CT and MRI with i.v. contrast. The ratio of contrast enhancement on MRI to normalized PET probe uptake, which we term the immunotherapeutic response index, delineated specific regions of immune inflammatory activity. On postmortem examination, FACS-based enumeration of intracranial tumor-infiltrating lymphocytes directly correlated with quantitative [18F]-FAC PET probe uptake. Three patients with GBM undergoing treatment with tumor lysate-pulsed DC vaccination and PD-1 mAb blockade were also imaged before and after therapy using MRI and a clinical PET probe for dCK. Unlike in mice, [18F]-FAC is rapidly catabolized in humans; thus, we used another dCK PET probe, [18F]-clofarabine ([18F]-CFA), that may be more clinically relevant. Enhanced [18F]-CFA PET probe accumulation was identified in tumor and secondary lymphoid organs after immunotherapy. Our findings identify a noninvasive modality capable of imaging the host antitumor immune response against intracranial tumors.
Glioblastoma (GBM), the most common primary malignancy of the brain, occurs in both the young and the elderly, with swift and devastating outcomes. While advances in immunotherapy are beginning to reach clinical relevance in GBM (1–4), a corresponding improvement in effective monitoring of the immune response is lacking (5–7). T lymphocytes are the most critical immune cell type for immune surveillance of cancer. Lymphocytic infiltration in tumors is associated with better prognosis for patients, and efforts are underway to incorporate the staging of malignant tumors with immune infiltration (8–13). However, the assessment of intratumoral lymphocytic infiltration requires repeated surgical biopsy/resection for pathological evaluation, which often is not feasible or safe in brain tumors.
The accurate differentiation of contrast enhancement caused by inflammation (pseudoprogression) (14–16) is of paramount importance in the evaluation of response in patients treated with immune-targeted therapies. At present, contrast-enhanced MRI is the modality typically used to track treatment response and progression in patients with GBM; however, the precise identification of tumor progression, when the potential for pseudoprogression or treatment-associated necrosis and inflammation exists, remains a clinical dilemma largely unmitigated by advancements in imaging techniques. Biopsy remains the gold standard for this determination as well.
Noninvasive testing methods to differentiate tumor progression from treatment effects could offer important utility in the clinical management of patients with GBM and many other brain malignancies. Recent advances in PET suggest a promising potential to enhance the accuracy of monitoring in patients receiving immunotherapy (17–20). Our group at the University of California Los Angeles (UCLA) originally demonstrated preferential uptake in activated CD8+ T lymphocytes of the d-enantomeric configuration of [18F]-2-fluoro-d-(arabinofuranosyl) cytosine (FAC) (21), a deoxycytidine analog that is a specific substrate for deoxycytidine kinase (dCK) and that can denote areas of immune cell activity (18–21). [18F]-FAC has improved selectivity for immune cells compared with [18F]-fludeoxyglucose and specifically accumulates in lymphoid organs during primary antitumor immune responses (19). An analogous clinical dCK PET probe, 2-chloro-2′-deoxy-2′-[18F]fluoro-9-b-d-arabinofuranosyl-adenine ([18F]-CFA), has similar bioaccumulation as [18F]-FAC and is currently being tested in patients at our institution (22). The ability of these PET probes to selectively discriminate immune responses within tumors has been limited, however (19). Thus, to examine immune cell infiltration into tumors, combined PET and MRI imaging modalities may be needed. Here we report on the combined use of dCK-based PET and contrast-enhanced MRI as a noninvasive, systematic, reproducible measure of the treatment-induced immune response.
Results
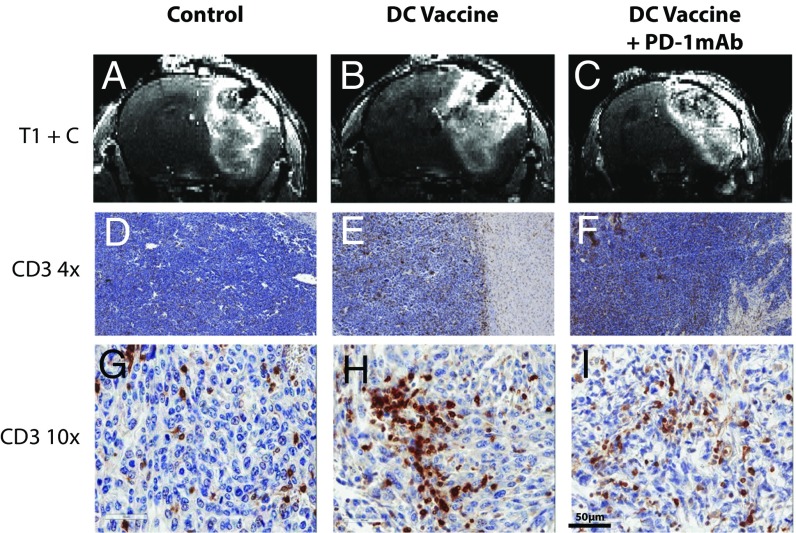
To evaluate whether standard contrast-enhanced MRI could provide clinically relevant information in mice treated with immunotherapy, intracranial GL261 gliomas were established in syngeneic mice and then treated with tumor lysate-pulsed dendritic cell (DC) vaccination and/or PD-1 mAb blockade. We have recently reported on the survival benefit and antitumor immune responses produced by DC vaccination and PD-1 mAb combination treatments in this animal model (1, 23); however, the ability to accurately monitor immunotherapy noninvasively in mice or human patients has not yet been evaluated. Following tumor establishment, mice were imaged with 7-T small animal MRI. High-resolution 3D precontrast T1-weighted (T1) and postcontrast T1-weighted (T1+C) images were obtained. Postcontrast MRI images depicted comparable tumor growth in control nontreated, DC vaccinated, and DC vaccinated + PD-1 mAb-treated mice (Fig. 1 A–C). Following imaging, mice were euthanized and the brains were harvested for immunohistochemical staining of T lymphocyte infiltration. An elevated population of infiltrating T lymphocytes was noted in both the DC-vaccinated and the DC-vaccinated + PD-1 mAb-treated mice (Fig. 1 D–I). Thus in glioma-bearing mice treated with immunotherapy, standard MRI was unable to effectively distinguish between tumor progression and effective antitumor immune responses induced by the therapy.
Fig. 1.
Standard contrast-enhanced MRI cannot distinguish tumor growth from pseudoprogression in glioma-bearing mice. (A–C) Representative coronal sections of T1-weighted MRI images following i.v. injection of contrast agent. (D–I) 4× magnified (D–F) and 10×- magnified (G–I) cross-sections of mice from control, DCVax, and DCVax + PD-1 mAb mice after immunohistochemical staining for CD3. Images were obtained from representative mice in experiments repeated multiple times; n = 4–6 mice per group.
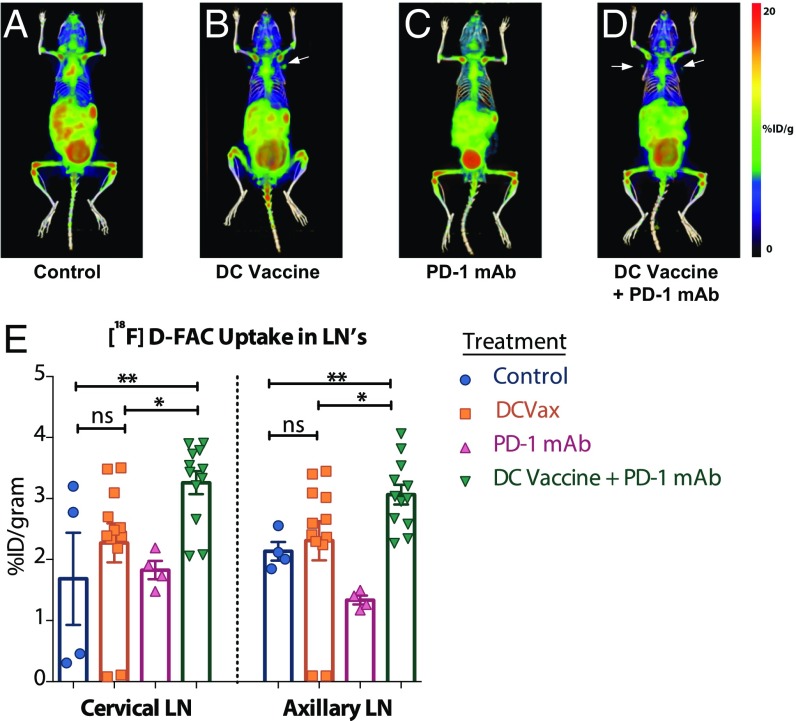
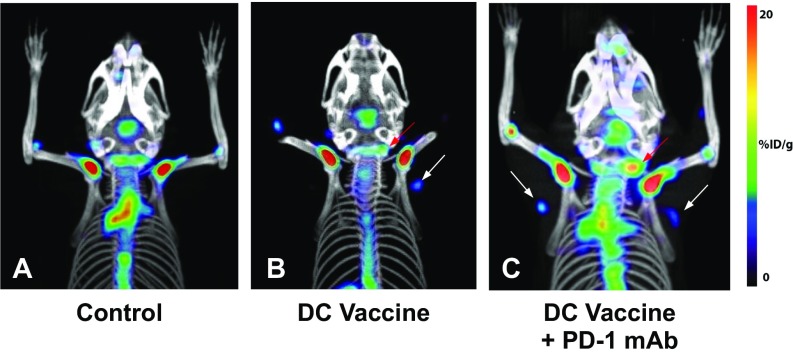
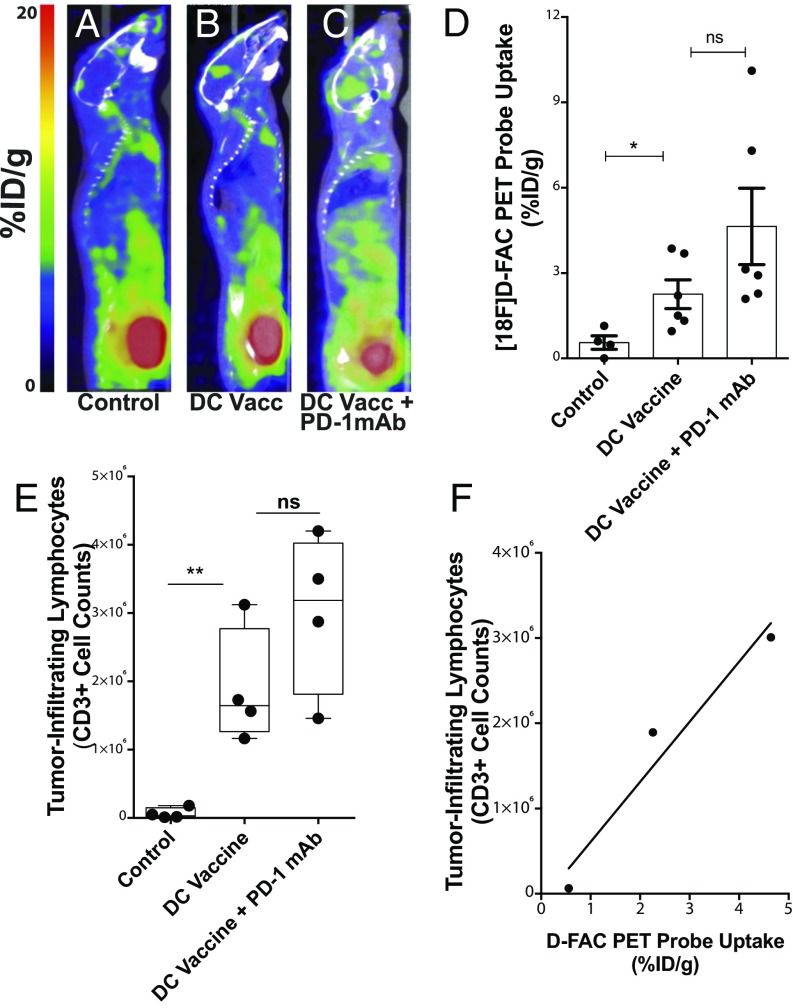
To systematically address this problem, we adapted a new, functional PET technology approach based on imaging substrates expressed selectively by activated immune cells, which could then directly detect the in situ activity of brain tumor immunotherapies (17, 19–22, 24). As such, we performed [18F]-FAC whole-body PET/CT imaging in mice bearing orthotopic GL261 gliomas following the completion of DC vaccination with or without PD-1 mAb blockade. Mice treated with this combination immunotherapy exhibited significantly increased cervical and axillary lymph node tracer uptake compared with animals treated with each agent alone and with untreated controls (Fig. 2 and Fig. S1). Furthermore, a significant increase in the intracranial tumor probe uptake was observed in mice treated with immunotherapy compared with control, tumor-bearing animals. Animals that received DC vaccination together with adjuvant PD-1 mAb showed the greatest probe uptake (Fig. 3 A–D). We next harvested tumor-bearing brain hemispheres from all mice and quantified the infiltrating immune response using multicolor flow cytometry. We found a direct correlation between intratumoral PET probe uptake and the number of tumor-associated T lymphocytes (Fig. 3 E and F). These findings strongly suggest that the additional use of noninvasive [18F]-FAC PET imaging could add an important new dimension of relevant immunologic information, with spatial resolution.
Fig. 2.
DC vaccination with or without PD-1 mAb blockade results in elevated [18F]-FAC probe accumulation in lymph nodes. (A–D) Representative 3D whole-body reconstructions of [18F]-FAC PET and CT imaging in control, DCVax, PD-1 mAb, and DCVax + PD-1 mAb treatment groups. (E) Regions of interest (ROIs) and quantification of probe uptake measured in the cervical and axillary lymph nodes in the treatment groups. *P < 0.05; **P < 0.005, unpaired t tests of the ROI data. n = 4–6/group. Measurements were repeated at least twice to verify the results.
Fig. S1.
Increased [18F]-FAC probe accumulation in lymph nodes following treatment with DCVax ± PD-1 mAb blockade. (A–C) Additional representative [18F]-FAC PET and CT images in control, DCVax, and DCVax + PD-1 mAb treatment groups highlighting cervical and axillary lymph node tracer uptake.
Fig. 3.
DC vaccination with or without PD-1 mAb blockade results in elevated [18F]-FAC probe accumulation in gliomas and directly correlates with lymphocytic infiltrate. (A–C) Representative whole-body cross-sections of PET-imaged mice injected with [18F]-FAC radioactive label for control, DCVax-treated, and DCVax + PD-1 mAb-treated mice. (D) [18F]-FAC PET probe uptake in tumor was significantly elevated in treated mice compared with untreated mice (*P < 0.05, **P < 0.01); n = 4–6/group. (E) Absolute counts of CD3+ tumor-infiltrating lymphocytes were significantly elevated in treated mice compared with untreated mice (**P < 0.01, ***P < 0.001); n = 4/group. (F) Correlation between the average PET probe uptake per group (D) and the average absolute infiltrating CD3+ lymphocyte count (E) per group quantified (R2 = 0.89) across treatment groups.
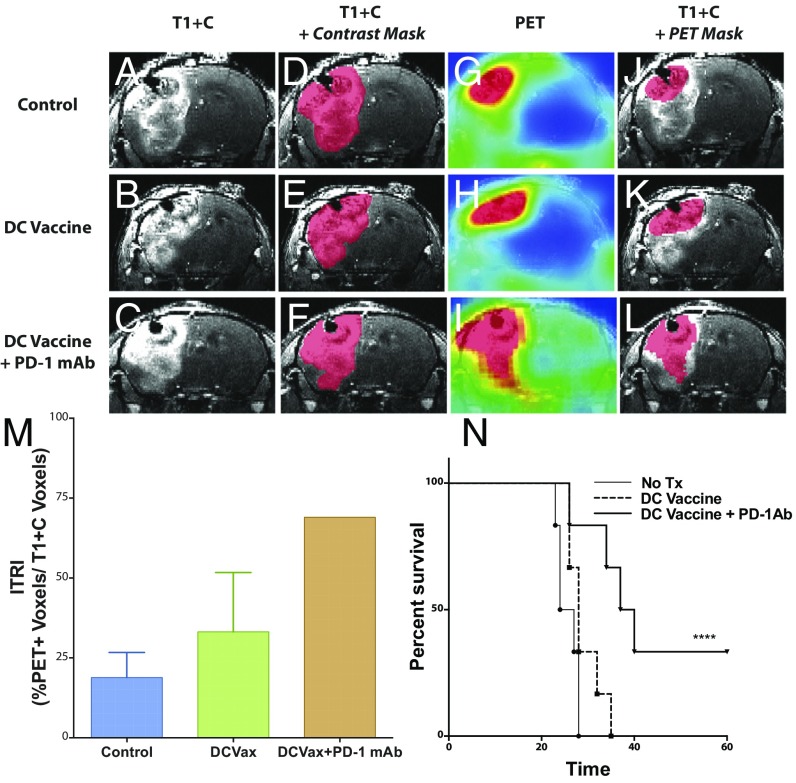
MRI is currently the most clinically useful imaging technique for patients with brain tumors (25, 26), providing significantly better anatomic resolution than can be obtained with PET. Thus, we used precontrast and postcontrast MRI of glioma-bearing mice to generate contrast subtraction maps, a technique that our group has previously used to highlight relevant differences in GBM after various treatments (27). We quantified the difference between the T1+C voxels (Fig. 4 A–C) and the T1 voxels (Fig. 4 D–F) to create a contrast mask. We similarly created a PET mask by subtracting any PET voxels (Fig. 4 G–I) below the baseline threshold from each image (0.5 ID%/g). This PET mask was overlaid onto the T1+C MRI study (Fig. 4 J–L), and the percentage of overlap between the contrast mask and the PET mask was identified as the intratumoral inflammatory signal. We quantitated this signal by creating a ratio of the PET voxels divided by the T1+C subtraction voxel data, which we term the immunotherapeutic response index (ITRI) (Fig. 4M). Increased ITRI values were observed in mice treated with DC vaccination and/or PD-1 mAb compared with untreated mice. This increased immune activity was correlated with increased survival in mice receiving DC vaccination in conjunction with PD-1 mAb treatment (Fig. 4N), as we have reported previously (1). When correlated with median survival in mice, there was a direct linear correlation between ITRI value and median survival (R2 = 0.995).
Fig. 4.
The ITRI predicts survival outcome in glioma-bearing mice following immunotherapy. (A–C) Representative coronal T1-weighted MRI sections of untreated control, DCVax-treated, and DCVax + PD-1 mAb-treated mice. (D–F) Representative contrast subtraction maps (red; contrast mask) overlaid onto T1-weighted MRI images with contrast. (G–I) Representative coronal [18F]-FAC PET images of untreated control and DCVax- and DCVax + PD-1 mAb-treated mice. (J–L) Representative threshold PET subtraction maps (red; PET mask) overlaid onto T1-weighted MRI images with contrast. (M) The ITRI (% PET voxels/T1+C voxels) calculated for each treatment group. n = 1–4 mice/group. Calculations were performed twice, with similar findings. (N) Survival of intracranial GBM-bearing untreated control (no Tx), DCVax-treated, and DCVax + PD-1 mAb-treated mice (****P < 0.0001); n = 6/group.
While [18F]-FAC enables PET imaging of dCK activity in mice (17–19, 21, 24), the utility of this probe in humans is limited by its rapid catabolism mediated by cytidine deaminase. To overcome this problem, our group recently developed purine analog probes that are also selectively phosphorylated by dCK for use in human patients. [18F]-CFA PET imaging of dCK activity is an important candidate purine PET probe for human use (22). In an ongoing imaging study, we performed [18F]-CFA PET imaging on patients with recurrent GBM before and after two immunotherapeutic treatments consisting of autologous tumor lysate-pulsed DC vaccination (DCVax-L; Northwest Biotherapeutics) with or without PD-1 mAb blockade (pembrolizumab; Merck).
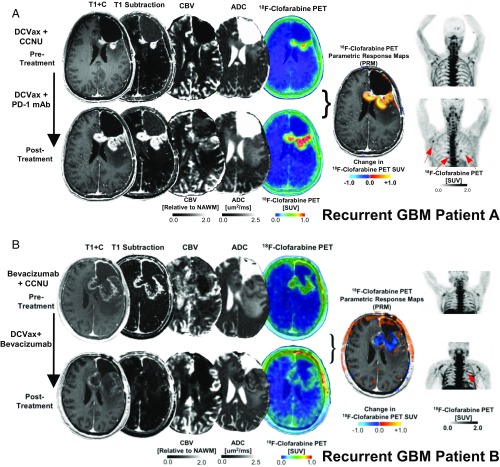
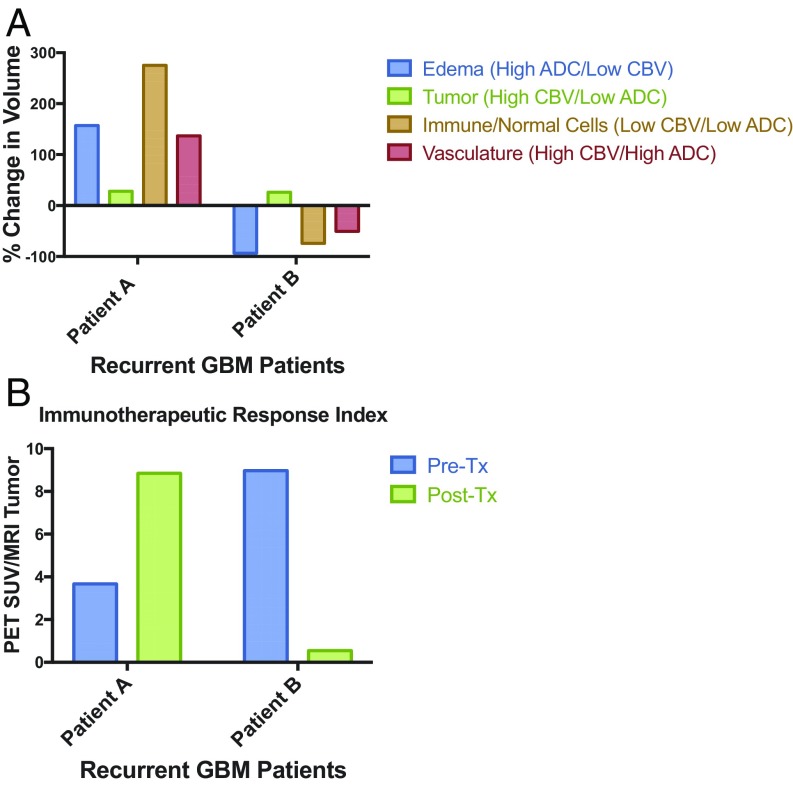
The case studies of the first three patients are outlined below. Patient A received tumor lysate-pulsed DCVax before imaging and then PD-1 antibody blockade during the interval between the first and second [18F]-CFA PET scans. The posttreatment [18F]-CFA PET scan demonstrated elevated uptake in several peripheral lymph nodes and in the tumor (Fig. 5A) compared with the first scan done 3 wk earlier, in agreement with the results of the murine studies. Advanced MRI revealed an increase in the tumor’s subtraction map (T1+C – T1). MRI with apparent diffusion coefficient (ADC) maps and cerebral blood volume (CBV) perfusion-weighted MRI suggested an almost 300% increase in immune cells in the tumor microenvironment, with the tumor volume remaining fairly constant (Fig. 6A).
Fig. 5.
The combination of [18F]-CFA PET and advanced MRI can help distinguish tumor progression from inflammation in patients with GBM treated with DC vaccination and PD-1 mAb blockade. Postcontrast T1-weighted, T1-subtraction, relative CBV, ADC, [18F]-FAC PET + MRI fusion, and whole-body maximum-intensity projection images of [18F]-CFA from two patients (A, patient A; B, patient B) with recurrent GBM before (Top) and after (Bottom) immunotherapy.
Fig. 6.
Quantitative estimation of intratumoral immune responses using combined multiparametric MRI/PET. (A) Quantification of edema, tumor, immune/normal cells, and vasculature from perfusion (CBV) and diffusion (ADC)-weighted MRI. (B) Ratio of [18F]-CFA PET standard uptake value divided by the tumor (high CBV/low ADC) volumes for patients A and B.
Patient B received DCVax during the interval between the two [18F]-CFA PET scans. Again, lymph node [18F]-CFA tracer uptake was observed on the posttreatment scan (Fig. 5B). In contrast to patient A, patient B’s advanced MRI showed a substantial decrease in both [18F]-CFA PET tracer uptake and the tumor’s contrast-enhancing area encompassed by edema and normal/immune cells (Fig. 6A). However, just before scanning, this patient had started treatment with bevacizumab (Avastin; Genentech), which has been shown to decrease peritumoral edema and alter contrast enhancement patterns, perfusion, and diffusion characteristics on advanced MRI (27–29).
Patient C (not pictured) had a recurrent frontal tumor that was treated with bevacizumab and DC vaccination, which resulted in a complete objective response. Because of this, there was no evidence of disease to quantify by imaging at the time points studied, and thus PET imaging results are not presented here.
Plotting then the ratio of the [18F]-CFA PET standardized uptake value to the tumor area (high CBV/low ADC) revealed a substantial increase in patient A, but not in patient B (Fig. 6B). While preliminary, the results were striking in these patients scanned with both [18F]-CFA PET and advanced MRI techniques. Our findings suggest that [18F]-CFA PET and advanced MRI yield similar results as those seen in the preclinical animal models, which is encouraging. Additional studies are needed to understand the significance of the observed imaging changes induced by immunotherapeutic treatments in patients with GBM. Of note, the concurrent use of antiangiogenic agents may alter characteristics of PET probe uptake or perfusion/diffusion MRI, possibly limiting the effectiveness of this imaging modality.
Discussion
PET has widely been used to visualize functional processes, such as glucose uptake by cancer cells; however, probes to distinguish immune cells from cancer cells could have a considerable clinical impact in evaluating therapeutic immune responses. Our group first identified that PET probes focused on the salvage pathway (particularly on substrates for dCK) for DNA synthesis can be differentially retained in proliferating T cells. The first dCK PET probe, [18F]-FAC, emerged from a differential screen in primary lymphocytes that identified fluorinated nucleoside analogs that share similar transport and phosphorylation mechanisms with the endogenous dCK substrate, deoxycytidine (21). However, [18F]-FAC is not clinically relevant, owing to rapid catabolism in humans by cytidine deaminase, an enzyme present at much higher concentrations in humans compared with mice. CFA is a purine dCK substrate probe that is not deaminated by cytidine deaminase and has the same substrate specificity. To provide a more clinically applicable PET probe for dCK PET imaging in patients, our group developed [18F]-CFA. The [18F]-CFA probe has been shown to be a primary substrate for cytosolic dCK, with minimal cross-reactivity to mitochondrial deoxyguanosine kinase, indicating that the probe accumulation is most likely related to immune activation rather than to mitochondrial stress or dysfunction. Unfortunately, the ability of these PET probes to selectively discriminate immune responses within tumors has been limited (19). Thus, we adapted the functional selectively of this PET tracer with the spatial resolution of MRI to study immune-related changes occurring within gliomas before and after immunotherapy.
Over the past decade, experimental immunotherapeutic trials have been hindered by the lack of reliable and systematic measures of immune responses within central nervous system (CNS) tumors. In our preclinical models of glioma, the activated tumor-infiltrating T lymphocyte response is responsible for extended survival and therapeutic benefit (1, 23). DC vaccination alone is able to promote an infiltrating T lymphocytic response, but the addition of PD-1 mAb conveys a significant survival benefit only when combined with DC vaccination (1, 23). We describe an imaging-based modality capable of monitoring the penetrance of the lymphocytic response within preclinical CNS tumors, which provides a framework for continuing evaluation of whether similar methodologies can quantify antitumor immune responses in patients with malignant brain tumors treated with immunotherapy. Advanced MRI, including diffusion and perfusion MRI, is not sensitive to specific cell type (immune vs. tumor vs. normal brain), but can demonstrate whether the localized cell density (diffusion) or vascularity (perfusion) has been altered. With the addition of [18F]-CFA PET, we can enhance imaging specificity of the specific type of cells present. Thus, a combination of advanced MRI and PET may be useful for differentiating tumor progression from immune cell infiltration.
In conclusion, by combining dCK-based PET and MRI modalities, we are able to noninvasively localize and quantify immune responses induced by immunotherapy. The percentage of tumor volume containing an activated lymphocytic infiltrate is positively correlated with survival in animals. ITRI not only allows us to quantify the immune response in CNS tumors using noninvasive means, but also serves to standardize how we quantify this immunity, to potentially serve as a predictive biomarker of survival and antitumor immune response in a reproducible fashion among patient populations. Additional studies in patients are needed to explore the clinical significance of the changes observed with these imaging modalities.
Materials and Methods
Cell Lines.
The murine glioma cell line GL261 was obtained from Dr. Henry Brem (Johns Hopkins University). Cells were maintained in complete DMEM (Mediatech; Corning) supplemented with 10% FBS (Gemini Bio Products) and 1% (vol/vol) penicillin-streptomycin (Mediatech; Corning) and cultured in a humidified atmosphere of 5% CO2 at 37 °C.
GL261 Lysate Preparation.
GL261 cells were cultured and expanded in complete DMEM media. Cells were then harvested and passaged through several freeze-thaw cycles and suspension-filtered. Lysate concentration was quantified using a Bradford protein assay as described previously (1, 23).
Bone Marrow-Derived DC and Preclinical Treatment Regimens.
Tumor lysate-pulsed DC vaccines were prepared as described previously (1, 23, 30). In brief, bone marrow cells were cultured in a humidified atmosphere of 5% CO2 at 37 °C overnight in complete RPMI (Mediatech; Corning) supplemented with 10% FBS and 1% (vol/vol) penicillin-streptomycin. The next day, nonadherent cells were collected and cultured with murine IL-4 (400 IU/mL; R&D Systems) and murine GM-CSF (100 ng/mL; R&D Systems). On day 4, nonadherent cells were removed from culture via aspiration, and medium containing GM-CSF and IL-4 was replenished on the adherent cells. On day 7, DCs were harvested and resuspended at 1 × 10⁶ cells/mL in complete RPMI and pulsed with GL261 lysate (250 μg/mL). On day 8, DCs were collected and resuspended at 2 × 10⁶ cells/mL in PBS and then immediately prepared for injection in 0.2 mL of cell suspension per mouse. Injections were given s.c. at four sites on the back on days 3 and 13 after tumor implantation. PD-1 mAb (clone RMP1-14; Bio X Cell) was administered i.p. at 250 mg/kg daily on days 3–5 and 13–15 after tumor implantation, as described previously (1, 23).
Intracranial Glioma Implants.
Female C57BL/6 mice, age 6–8 wk, were obtained from our institutional breeding colonies. All mice were bred and maintained under defined-flora pathogen-free conditions at the Association for Assessment and Accreditation of Laboratory Animal Care International-approved Animal Facility of the Division of Experimental Radiation Oncology at UCLA. Mice were handled in accordance with UCLA’s animal care policy and approved animal protocols. Mice were anesthetized with an i.p. injection of ketamine/xylazine. After shaving the hair, disinfecting with povidone-iodine, and incising the scalp, a burr hole was made in the skull 2.5 mm lateral to bregma using a dental drill. GL261 glioma cells (2 × 10⁴ cells in 2 μL of PBS) were injected stereotactically with a sterile Hamilton syringe fitted with a 26-gauge needle. The intracranial injection was performed over a 2-min period at a depth of 3.5 mm below the dura mater. The syringe was retained in the brain for another 1 min following complete infusion of cells and then slowly withdrawn to prevent leakage of the cells into the leptomeningeal space. Following intracranial tumor implantation, mice were randomized into treatment groups.
Radiotracer Syntheses.
Synthesis of [18F]-FAC was carried out as described by Radu et al. (21), using a technique previously described by Hamacher et al. (31). The radiochemical purity was >99%, and the specific activity was 0.96 Ci/μmol. The synthesis of [18F]-CFA followed the procedure described in ref. 20. [18F]-CFA was obtained with a radiochemical purity >98% and specific activity of 10–20 Ci/μmol. All batches were tested for sterility and apyrogenicity and approved for human use.
Preclinical MicroPET/CT and MRI Studies.
MicroPET/CT studies were conducted as described previously (19, 22). For preclinical PET/CT imaging, mice were injected with 888.89–1,037.04 MBq of [18F]-FAC i.v. at 1 h before scanning. Mice were warmed during the uptake and PET/CT imaging. Mice were imaged with a PerkinElmer G4 PET/CT scanner (Sofie Biosciences) in a 10-min static scan. For preclinical MRI, mice were sedated with 1–3% isoflurane under O2/N2 flow, and respiration was monitored. The mice were kept warm with water heated to 37 °C circulated using a Stryker TP500 water pump. Tail vein catheterization was performed to administer the clinical-grade gadolinium contrast solution (Magnevist; Bayer Schering Pharma) at a dilution of 1:10 in 1× PBS. After precontrast T1-weighted MRI, 6 μL/g diluted Magnevist was injected over a period of 45 s via a lateral tail vein cannula immediately before the second T1-weighted MRI. All MRI scans were done with a 7-T Bruker Biospec system with a custom-built 2.2-cm RF birdcage coil. PET and MRI images were analyzed using a freely available Advanced Medical Imaging Data Examiner (AMIDE) tool. To calculate the percentage of tumor volume containing immune infiltrate, anatomic MRI and PET data were overlaid. Using our MRI studies, precontrast T1 was subtracted from T1+C to generate a contrast subtraction map (27). The number of tumor-associated voxels was quantified. Next, the PET ID%/g was normalized to muscle to account for background signal, given that previous studies by our group identified muscle as a dCK-negative tissue based on digital whole-body autoradiography (21). The PET/CT study was coregistered to the MRI study using known landmarks to identify MRI contrast-marked tumor on the PET study.
Finally, the number of voxels within the marked tumor region above a noise threshold of 0.5 ID%/g was quantified. The number of PET-positive tumor-associated voxels were divided by the number of MRI contrast-positive tumor-associated voxels multiplied by 100. This unitless value, representing the percentage of tumor delineated on MRI containing immune infiltrate as identified on PET, was identified as the ITRI.
Clinical PET and MRI Studies.
Clinical [18F]-CFA PET imaging studies were performed with informed consent under a Radioactive Drug Research Committee protocol and with approval from UCLA’s Institutional Review Board, as described previously (22). In brief, ≈233.1 MBq of [18F]-CFA was administered to patients with GBM, and static imaging was performed at 30–60 min following probe injection. Clinical MRI was performed with a 3-T MRI scanner (Siemens Prisma or Skyra). Standard clinical images were obtained for these patients following a standardized brain tumor imaging protocol (25), including 3D precontrast and postcontrast inversion recovery prepared gradient echo T1-weighted images; T2-weighted turbo spin echo (TSE) images; T2-weighted fluid-attenuated inversion recovery TSE images; ADC maps calculated from diffusion-weighted images with b values of 0, 500, and 1,000 s/mm2, and relative CBV maps calculated using a bidirectional leakage correction algorithm (32). PET parametric response maps were calculated using standard techniques (33). In brief, all posttreatment PET scans and corresponding MRI examinations were aligned to the pretreatment PET and MRI examinations. Voxel-wise subtraction of standardized uptake values was then performed to isolate regions with significantly increased or decreased PET uptake.
Tissue Harvesting.
Mouse brains were harvested from mice on day 21 after PET imaging. In cases where sectioning and immunohistochemistry were required, brains were carefully removed from the skull and placed in 1× zinc fixative (BD Biosciences) for 24 h and then transferred to 70% ethanol, followed by embedding in paraffin wax. For cell FACS analysis, tumor-bearing hemispheres were carefully removed from the skull and minced with a scalpel. The tissue was placed on a rotator in collagenase with DNase for 24 h, followed by isolation of lymphocytes using a 30:70% Percoll gradient. Small mononuclear cells within the tumor were enumerated by trypan blue exclusion. Tumor-infiltrating lymphocyte counts were calculated by determining the total number of CD8+ cells per tumor-bearing hemisphere. Fluorochrome-conjugated antibodies to CD3, CD8, and CD25 were obtained from Biolegend. All FACS analyses were performed with an LSR II flow cytometer (BD Biosciences). Gates were set based on isotype-specific control antibodies. Data were analyzed using FlowJo software.
Acknowledgments
We thank Namjo Shin, Larry Pang, Roger Slavik, and Waldemar Ladno for assistance with the PET/CT imaging studies; the UCLA Biomedical Cyclotron team for the production of [18F]-CFA; the Nuclear Medicine Clinic for assistance with the clinical PET scans; and the Crump Institute for the production of [18F]-FAC used in the preclinical imaging studies. This work was supported in part by National Institutes of Health/National Cancer Institute Grants R21 CA186004 and R01 CA154256 (to R.M.P.), R01 CA125244 (to L.M.L.), and R25 NS079198 (to R.M.P., R.G.E., and L.M.L.); the Isabel Neidorf Foundation (R.M.P. and L.M.L.), the Musella Foundation for Brain Tumor Research (R.M.P.), an American Cancer Society Research Scholar Grant (to B.M.E.), a UCLA Graduate Division Dissertation Year Fellowship (to J.P.A.), UCLA Department of Radiology, and the UCLA Medical Scientist Training Program (J.P.A.).
Footnotes
Conflict of interest statement: C.R., M.E.P., and J.C. are cofounders of Sofie Biosciences. These authors and the University of California hold equity in Sofie Biosciences.
This article contains supporting information online at www.pnas.org/lookup/suppl/doi:10.1073/pnas.1706689114/-/DCSupplemental.
References
- 1.Antonios JP, et al. PD-1 blockade enhances the vaccination-induced immune response in glioma. JCI Insight. 2016;1:e87059. doi: 10.1172/jci.insight.87059. [DOI] [PMC free article] [PubMed] [Google Scholar]
- 2.Liau LM, et al. Dendritic cell vaccination in glioblastoma patients induces systemic and intracranial T-cell responses modulated by the local central nervous system tumor microenvironment. Clin Cancer Res. 2005;11:5515–5525. doi: 10.1158/1078-0432.CCR-05-0464. [DOI] [PubMed] [Google Scholar]
- 3.Prins RM, et al. Gene expression profile correlates with T-cell infiltration and relative survival in glioblastoma patients vaccinated with dendritic cell immunotherapy. Clin Cancer Res. 2011;17:1603–1615. doi: 10.1158/1078-0432.CCR-10-2563. [DOI] [PMC free article] [PubMed] [Google Scholar]
- 4.Prins RM, et al. Comparison of glioma-associated antigen peptide-loaded versus autologous tumor lysate-loaded dendritic cell vaccination in malignant glioma patients. J Immunother. 2013;36:152–157. doi: 10.1097/CJI.0b013e3182811ae4. [DOI] [PMC free article] [PubMed] [Google Scholar]
- 5.Hsu M, et al. TCR Sequencing can identify and track glioma-infiltrating T cells after DC vaccination. Cancer Immunol Res. 2016;4:412–418. doi: 10.1158/2326-6066.CIR-15-0240. [DOI] [PMC free article] [PubMed] [Google Scholar]
- 6.Müller I, et al. Tumor antigen-specific T cells for immune monitoring of dendritic cell-treated glioblastoma patients. Cytotherapy. 2016;18:1146–1161. doi: 10.1016/j.jcyt.2016.05.014. [DOI] [PubMed] [Google Scholar]
- 7.Weathers SP, Gilbert MR. Current challenges in designing GBM trials for immunotherapy. J Neurooncol. 2015;123:331–337. doi: 10.1007/s11060-015-1716-2. [DOI] [PubMed] [Google Scholar]
- 8.Galon J, et al. Type, density, and location of immune cells within human colorectal tumors predict clinical outcome. Science. 2006;313:1960–1964. doi: 10.1126/science.1129139. [DOI] [PubMed] [Google Scholar]
- 9.Galon J, et al. Cancer classification using the immunoscore: A worldwide task force. J Transl Med. 2012;10:205. doi: 10.1186/1479-5876-10-205. [DOI] [PMC free article] [PubMed] [Google Scholar]
- 10.Pagès F, et al. In situ cytotoxic and memory T cells predict outcome in patients with early-stage colorectal cancer. J Clin Oncol. 2009;27:5944–5951. doi: 10.1200/JCO.2008.19.6147. [DOI] [PubMed] [Google Scholar]
- 11.Tumeh PC, et al. PD-1 blockade induces responses by inhibiting adaptive immune resistance. Nature. 2014;515:568–571. doi: 10.1038/nature13954. [DOI] [PMC free article] [PubMed] [Google Scholar]
- 12.Wargo JA, Reddy SM, Reuben A, Sharma P. Monitoring immune responses in the tumor microenvironment. Curr Opin Immunol. 2016;41:23–31. doi: 10.1016/j.coi.2016.05.006. [DOI] [PMC free article] [PubMed] [Google Scholar]
- 13.Okada H, et al. Immunotherapy response assessment in neuro-oncology: A report of the RANO working group. Lancet Oncol. 2015;16:e534–e542. doi: 10.1016/S1470-2045(15)00088-1. [DOI] [PMC free article] [PubMed] [Google Scholar]
- 14.Hygino da Cruz LC, Jr, Rodriguez I, Domingues RC, Gasparetto EL, Sorensen AG. Pseudoprogression and pseudoresponse: Imaging challenges in the assessment of posttreatment glioma. AJNR Am J Neuroradiol. 2011;32:1978–1985. doi: 10.3174/ajnr.A2397. [DOI] [PMC free article] [PubMed] [Google Scholar]
- 15.Brandsma D, Stalpers L, Taal W, Sminia P, van den Bent MJ. Clinical features, mechanisms, and management of pseudoprogression in malignant gliomas. Lancet Oncol. 2008;9:453–461. doi: 10.1016/S1470-2045(08)70125-6. [DOI] [PubMed] [Google Scholar]
- 16.Brandsma D, van den Bent MJ. Pseudoprogression and pseudoresponse in the treatment of gliomas. Curr Opin Neurol. 2009;22:633–638. doi: 10.1097/WCO.0b013e328332363e. [DOI] [PubMed] [Google Scholar]
- 17.McCracken MN, et al. Noninvasive detection of tumor-infiltrating T cells by PET reporter imaging. J Clin Invest. 2015;125:1815–1826. doi: 10.1172/JCI77326. [DOI] [PMC free article] [PubMed] [Google Scholar]
- 18.Brewer S, et al. Epithelial uptake of [18F]1-(2′-deoxy-2′-arabinofuranosyl) cytosine indicates intestinal inflammation in mice. Gastroenterology. 2010;138:1266–1275. doi: 10.1053/j.gastro.2010.01.003. [DOI] [PMC free article] [PubMed] [Google Scholar]
- 19.Nair-Gill E, et al. PET probes for distinct metabolic pathways have different cell specificities during immune responses in mice. J Clin Invest. 2010;120:2005–2015. doi: 10.1172/JCI41250. [DOI] [PMC free article] [PubMed] [Google Scholar]
- 20.Shu CJ, et al. Novel PET probes specific for deoxycytidine kinase. J Nucl Med. 2010;51:1092–1098, and erratum (2015) 56:329. doi: 10.2967/jnumed.109.073361. [DOI] [PMC free article] [PubMed] [Google Scholar]
- 21.Radu CG, et al. Molecular imaging of lymphoid organs and immune activation by positron emission tomography with a new [18F]-labeled 2′-deoxycytidine analog. Nat Med. 2008;14:783–788. doi: 10.1038/nm1724. [DOI] [PMC free article] [PubMed] [Google Scholar]
- 22.Kim W, et al. [18F]CFA as a clinically translatable probe for PET imaging of deoxycytidine kinase activity. Proc Natl Acad Sci USA. 2016;113:4027–4032. doi: 10.1073/pnas.1524212113. [DOI] [PMC free article] [PubMed] [Google Scholar]
- 23.Antonios JP, et al. Immunosuppressive tumor-infiltrating myeloid cells mediate adaptive immune resistance via a PD-1/PD-L1 mechanism in glioblastoma. Neuro Oncol. 2017;19:796–807. doi: 10.1093/neuonc/now287. [DOI] [PMC free article] [PubMed] [Google Scholar]
- 24.Laing RE, et al. Noninvasive prediction of tumor responses to gemcitabine using positron emission tomography. Proc Natl Acad Sci USA. 2009;106:2847–2852. doi: 10.1073/pnas.0812890106. [DOI] [PMC free article] [PubMed] [Google Scholar]
- 25.Ellingson BM, et al. Jumpstarting Brain Tumor Drug Development Coalition Imaging Standardization Steering Committee Consensus recommendations for a standardized brain tumor imaging protocol in clinical trials. Neuro-oncol. 2015;17:1188–1198. doi: 10.1093/neuonc/nov095. [DOI] [PMC free article] [PubMed] [Google Scholar]
- 26.Ellingson BM, Wen PY, Cloughesy TF. Modified criteria for radiographic response assessment in glioblastoma clinical trials. Neurotherapeutics. 2017;14:307–320. doi: 10.1007/s13311-016-0507-6. [DOI] [PMC free article] [PubMed] [Google Scholar]
- 27.Ellingson BM, et al. Recurrent glioblastoma treated with bevacizumab: Contrast-enhanced T1-weighted subtraction maps improve tumor delineation and aid prediction of survival in a multicenter clinical trial. Radiology. 2014;271:200–210. doi: 10.1148/radiol.13131305. [DOI] [PMC free article] [PubMed] [Google Scholar]
- 28.Karavaeva E, et al. Relationship between [18F]FDOPA PET uptake, apparent diffusion coefficient (ADC), and proliferation rate in recurrent malignant gliomas. Mol Imaging Biol. 2015;17:434–442. doi: 10.1007/s11307-014-0807-3. [DOI] [PubMed] [Google Scholar]
- 29.Nghiemphu PL, et al. Bevacizumab and chemotherapy for recurrent glioblastoma: A single-institution experience. Neurology. 2009;72:1217–1222. doi: 10.1212/01.wnl.0000345668.03039.90. [DOI] [PMC free article] [PubMed] [Google Scholar]
- 30.Prins RM, Odesa SK, Liau LM. Immunotherapeutic targeting of shared melanoma-associated antigens in a murine glioma model. Cancer Res. 2003;63:8487–8491. [PubMed] [Google Scholar]
- 31.Hamacher K, Coenen HH, Stöcklin G. Efficient stereospecific synthesis of no-carrier-added 2-[18F]-fluoro-2-deoxy-D-glucose using aminopolyether-supported nucleophilic substitution. J Nucl Med. 1986;27:235–238. [PubMed] [Google Scholar]
- 32.Leu K, et al. Improved leakage correction for single-echo dynamic susceptibility contrast perfusion MRI estimates of relative cerebral blood volume in high-grade gliomas by accounting for bidirectional contrast agent exchange. AJNR Am J Neuroradiol. 2016;37:1440–1446. doi: 10.3174/ajnr.A4759. [DOI] [PMC free article] [PubMed] [Google Scholar]
- 33.Ellingson BM, et al. PET parametric response mapping for clinical monitoring and treatment response evaluation in brain tumors. PET Clin. 2013;8:201–217. doi: 10.1016/j.cpet.2012.09.002. [DOI] [PubMed] [Google Scholar]


