Significance
The combination of multichannel collimator and diamond anvil cells enabled the investigation of the real-space structure of an amorphous material >100 GPa. We have measured the structure of SiO2 glass by angle-dispersive X-ray diffraction up to 172 GPa. Our results are in agreement with existing data up to 50 GPa showing a sharp change from fourfold to sixfold Si–O coordination number (CN). However, at higher pressures, CN continuously increases to values beyond 6 without sharp structural changes. The behavior of SiO2 glass at high pressure serves as a model for more complex silicate glasses and melts. Thus, our results provide experimental insight into the structural evolution of silicate glasses and melts at ultrahigh pressures.
Keywords: high pressure, polyamorphism, glass, oxygen packing
Abstract
We investigated the structure of SiO2 glass up to 172 GPa using high-energy X-ray diffraction. The combination of a multichannel collimator with diamond anvil cells enabled the measurement of structural changes in silica glass with total X-ray diffraction to previously unachievable pressures. We show that SiO2 first undergoes a change in Si–O coordination number from fourfold to sixfold between 15 and 50 GPa, in agreement with previous investigations. Above 50 GPa, the estimated coordination number continuously increases from 6 to 6.8 at 172 GPa. Si–O bond length shows first an increase due to the fourfold to sixfold coordination change and then a smaller linear decrease up to 172 GPa. We reconcile the changes in relation to the oxygen-packing fraction, showing that oxygen packing decreases at ultrahigh pressures to accommodate the higher than sixfold Si–O coordination. These results give experimental insight into the structural changes of silicate glasses as analogue materials for silicate melts at ultrahigh pressures.
The structure of silicate melts and glasses at high pressure is of great interest not only in physics, geophysics, and materials science, but also in engineering and industry. Their physical properties at high pressures and temperatures have fundamental influences on present-day magmatic processes and the evolution of the early Earth (1, 2). Seismological heterogeneities at the top of the transition zone (3, 4) and at the core–mantle boundary (5) have been interpreted with the potential presence of silicate melts at very high pressures in the Earth’s interior. At ambient conditions, polymerized silicate melts and glasses are characterized mainly by networks of Si–O tetrahedra (6). Experimental investigations (7–10) and molecular dynamics (MD) simulations (11, 12) have shown that Si–O coordination number (CN) increases from fourfold to sixfold between 15 and 40 GPa, resulting in a network of Si–O octahedra (13). At pressures >40 GPa, MD simulations indicate a continuous increase in Si–O CN in SiO2 glass (11) and SiO2 melt (12), whereas existing experimental data on SiO2 glass indicate a plateau of sixfold coordinated Si–O up to 100 GPa from total X-ray diffraction analysis (9) and up to 140 GPa inferred from shear soundwave velocities (14).
A recent compilation of glass and melt structure data (15) found that evolution of network-forming structural motifs can be rationalized in terms of oxygen-packing fraction (OPF). A plateau region for fourfold coordinated A atoms (A = Si, Ge, Al, etc.) is found for an OPF of 0.4–0.6. The transformation to sixfold coordination occurs rapidly as OPF approaches 0.64. The highest experimental CN measured for SiO2 so far is 6 at 100 GPa (9), indicating another plateau for sixfold CN. However, recent data for GeO2 glass, which serves as a structural analogue for SiO2 glass, show a CN larger than sixfold, up to 7.4 at 92 GPa (16). These data follow the trend seen from MD simulations, where it has been shown that CN continuously increases with pressure after the relatively sharp fourfold to sixfold transition has taken place.
We have conducted measurements of the SiO2 glass structure factors up to 172 GPa using angular dispersive X-ray diffraction using a combination of diamond anvil cells (DACs) with a multichannel collimator (MCC) (17). The MCC, which was originally developed for Paris–Edinburgh Presses, effectively reduces the background scattering of the surrounding DAC, thus enabling total X-ray diffraction up to very high pressures and extending the pressure range for total X-ray diffraction with an angle dispersive setup by more than a factor of 3 (previously 50–60 GPa; e.g., ref. 7) for relatively low Z elements.
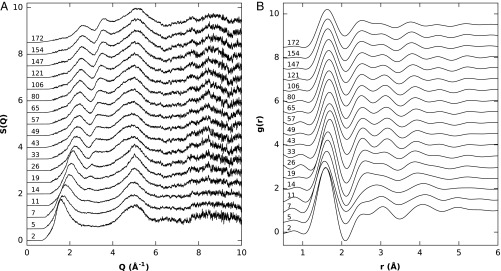
Selected structure factors S(Q) and pair distribution functions g(r) of the SiO2 glass up to 172 GPa are shown in Fig. 1. The S(Q) shows strong changes up to 33 GPa, whereby the main new feature is a peak rising between 2 and 3 Å−1 and a decrease in the intensity of the first sharp diffraction peak (FSDP). From 33 to 172 GPa, the S(Q) changes very smoothly with no apparent new features.
Fig. 1.
(A) X-ray structure factors S(Q) of SiO2 glass at selected pressures (in gigapascals) during compression. (B) Radial distribution functions g(r) of SiO2 glass obtained by Fourier transform of the structure factors. The pressures are given next to the curves.
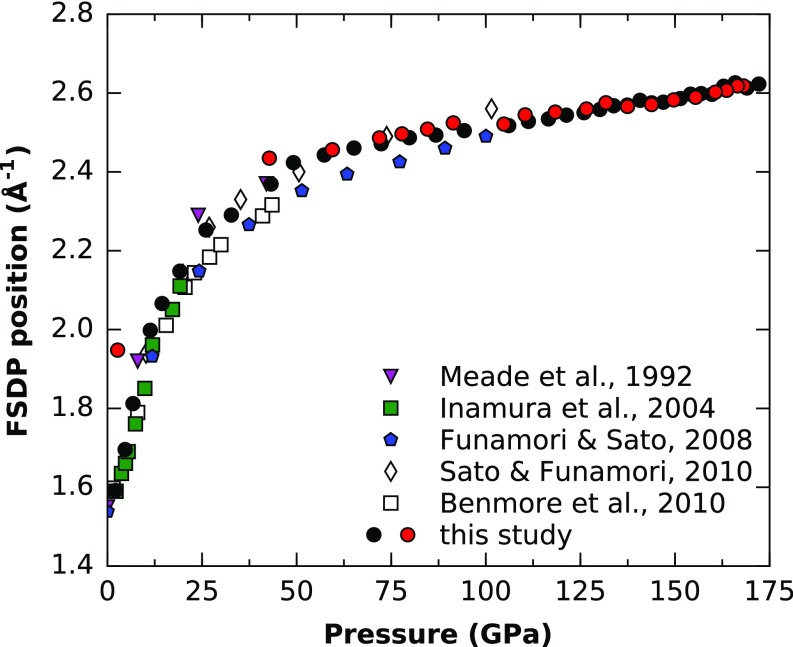
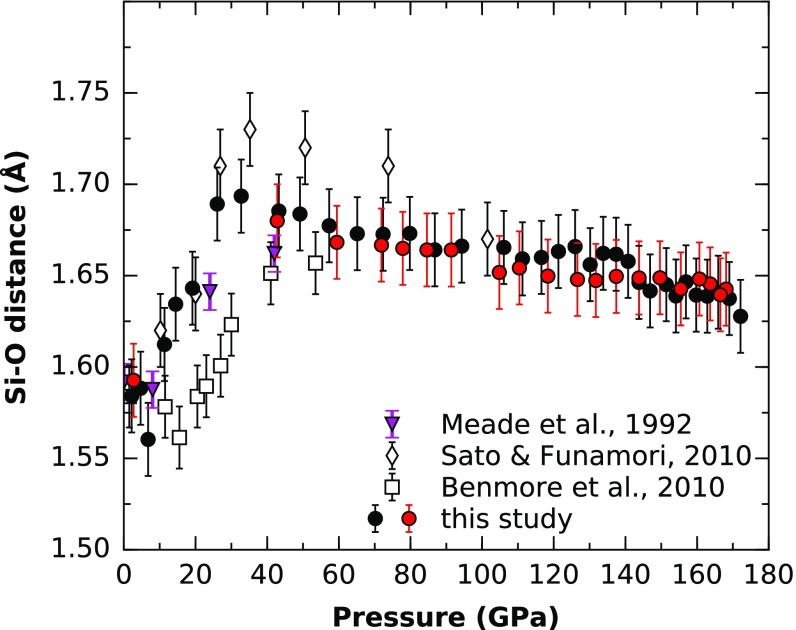
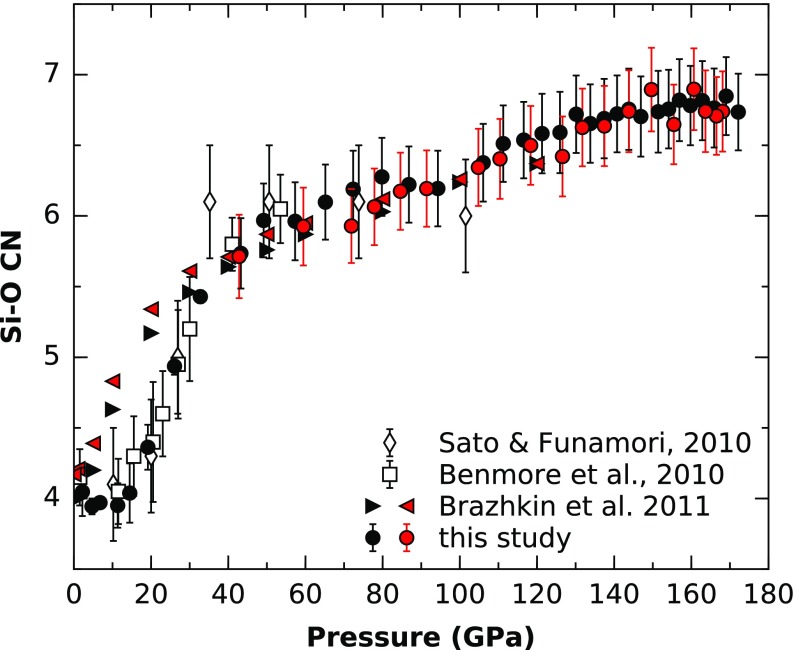
Figs. 2–4 show the pressure dependence of the FSDP position and the Si–O CN and Si–O distances, respectively. The FSDP position increases almost linearly with pressure up to 20 GPa, followed by a gradual curvature to another linear regime with a much smaller slope from 50 to 172 GPa. Our FSDP positions are in good agreement with refs. 8, 9, and 18, whereas refs. 7 and 19 reported slightly lower values at >25 GPa. The data used in refs. 19 and 9 are the same, and the discrepancy can probably be explained by different methods for extracting FSDP positions. The large change in FSDP positions at low pressures can be associated with a strong change in intermediate-range order. The accompanied drop in intensity also indicates a large decrease in void space in the structure (20) and ring closure (21), which is supported by the rapid increase in density in this pressure region (10).
Fig. 2.
Pressure dependence of the FSDP position of SiO2 glass. Values are compared with previous experimental data (7, 8, 10, 18, 19). Black and red circles represent compression and decompression, respectively.
Fig. 4.
Pressure dependence of the Si–O bond distance in SiO2 glass. Values are compared with previous X-ray diffraction data (7–9). Black and red symbols represent compression and decompression, respectively.
The Si–O CN (Fig. 3) remains constant at 4 up to 14 GPa and then rose sharply to 6 at 40 GPa, which is in agreement with previous experimental studies (7, 9, 21). The MD simulation data of ref. 11 shows an increase to higher CN at lower pressures. Above 50 GPa, our Si–O CN linearly increases with pressure to 7 at 172 GPa. Previous estimates reported a constant sixfold Si–O CN from 50 to 100 GPa (9). While our data are in agreement within the uncertainties of the data of ref. 9, our data, which cover a much greater pressure range, show a smooth linear increase (Fig. 3). A linear increase of Si–O CN after the fourfold to sixfold crossover is also observed in MD simulations of SiO2 glass (11) and ab initio MD simulations of SiO2 melt (12), although the absolute values are shifted. Ab initio MD simulations of SiO2 glass (22, 23), on the contrary, show only a very slow increase of CN >6 at pressures >100 GPa. Also, the fourfold to sixfold crossover seems to be completed at higher pressures, at 70–90 GPa. This indicates that there is a general shift in cross-over pressures, which might be induced by the small size of the simulation cell, which is not giving enough statistical information. Thus, SiO2 glass shows a similar behavior as GeO2 glass, where a larger than sixfold CN has been reported (16).
Fig. 3.
Pressure dependence of Si–O CN in SiO2 glass in comparison with previous experimental data (7, 9) and MD simulations (11). Black and red symbols represent compression and decompression, respectively.
The Si–O distance (Fig. 4) first remains constant at 1.62 Å up to 10 GPa and then almost linearly increases to 1.69 Å between 10 and 40 GPa. Above 40 GPa, the Si–O distance shows a linear decrease to 1.65 at 172 GPa. This behavior can be rationalized by means of two mechanisms, the effect of compression and change in CN. Below 10 GPa, the compression mechanism for SiO2 glass is mostly due to collapsing void space, while the Si–O distance remains constant. The increasing distance between 10 and 40 GPa is due to the increase from fourfold to sixfold coordination characterized by longer Si–O bond distances. Above 40 GPa, the compression effect on the Si–O distance is larger than the small continuous increase in CN, resulting in a decreasing Si–O distance from 40 to 172 GPa. Below 30 GPa, the data are in good agreement with ref. 9, whereas >30 GPa, our Si–O bond distances were slightly lower. However, there was a considerable disagreement with the data of refs. 7 and 21. The discrepancy in Si–O distances between refs. 21 and 7 has been attributed to radiation-induced annealing (21) in the study of ref. 9 due to the use of white-beam, energy-dispersive X-ray diffraction. However, our data were also collected with monochromatic X-ray diffraction, as in ref. 7, and also collection times were relatively short. Therefore, this mechanism is not likely to be the main cause. Another possible factor might be different degrees of anhydrostaticity. Sato et al. (24) have shown that differential stress results in large differential strain in SiO2 glass <20 GPa, whereas the strain decreases with higher pressures.
Our data show that the structure of SiO2 continuously changes with pressure from 50 up to 172 GPa. We do not see evidence for a stable plateau with a CN of 6 at higher pressures as reported for SiO2 glass (9) and GeO2 glass (16), but, rather, a continuous increase in CN up to 7 at 172 GPa. Furthermore, we do not observe first-order structural changes at 140 GPa, as predicted from soundwave velocity measurements of SiO2 glass (14). If existent, the origin of those sound speed changes might lie in other mechanisms or be caused by the different experimental approaches. For example, it might be specific to the laser interaction with the glass and the very long collection time needed for a Brillouin spectroscopy measurement >140 GPa, resulting in possible structural changes and/or densification.
In comparison with the glass at high pressure, crystalline SiO2 undergoes a succession of phase transformations with increasing pressure, depending on the state of the starting material (25). Experimental investigations have shown that, for example, -quartz transforms to coesite at 2.5 GPa, to a rutile-type structure (stishovite) at 10 GPa, to a CaCl2-type structure at ∼60 GPa, to α-PbO2 structure (seifertite) at 120 GPa, and a polymorph with space group >270 GPa, which has been suggested to be a pyrite like structure due to the same space group (26). Many of those phase transformations are not readily occurring at room temperature and need heating at the relevant pressures to overcome kinetic barriers. Room temperature compression of different SiO2 starting materials has been shown to lead to a variety of other metastable polymorphs (25, 27) or even amorphization at high pressures (28). Beyond current experimental achievable pressure, a cotunnite SiO2 structure has been predicted at >750 GPa (29). However, a later detailed search for different structure types at ultrahigh pressures has found the Fe2P-type structure to be more stable than the cotunnite structure (30). This structure type was predicted to be stable at >650 GPa. Lyle et al. (31) further predicted an structure at >10 TPa. It is remarkable that in almost all of those high-pressure structure types, except for the predicted structures >650 GPa, the first-neighbor maximum Si–O CN is 6. Only in the very high-pressure structures, Si was either 9-fold coordinated in the cotunnite-type and Fe2P-type structures or 10-fold coordinated in the structure. The steady increase of the Si–O CN with pressure >50 GPa in the glass observed here suggests that amorphous and crystalline SiO2 exhibit different densification mechanisms at very high pressures.
However, a closer look at the second Si–O neighbor distances in crystalline SiO2 shows a decrease with each subsequent structural transformation. While it was 2.952 Å for CaCl2-type structure at 70 GPa, it was only 2.372 Å for the suggested pyrite structure of the -type polymorph at 270 GPa. In fact, the pyrite type structure can be either described as 6- or 8-coordinated Si with six small and two longer Si–O bonds. Thus, it is reasonable that the randomly distorted structure of the SiO2 glass could reach higher Si–O CN than 6 at high pressures. If we assume linear increase of the CN with pressure, extrapolation of the Si–O CN to higher pressures reaches a value of 8 at ∼325 GPa, which is only slightly higher in pressure than the observed transition to the pyrite structure in crystalline SiO2 at 270 GPa (26).
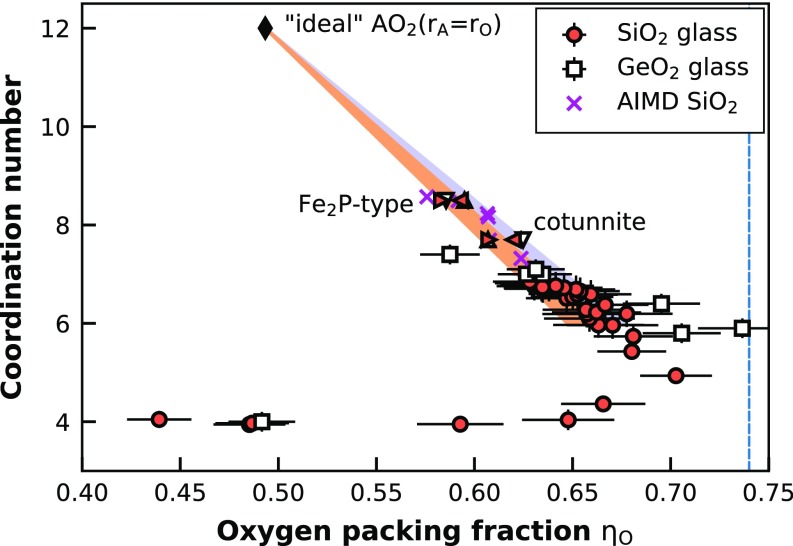
The changes of CN with pressure in oxide glasses and oxide melts have been shown to be linked to the OPF (15). Due to the lack of glass and melt structural data with a CN >6, the systematics in Zeidler et al. (15) is reported only for CNs between 3 and 6. Kono et al. (16) reported the first data on above-sixfold Ge–O CN in GeO2 glass at high pressures. They extended the systematics by using a similar approach to calculate OPF for structures with above sixfold CN. The OPF is calculated by , with , where is the oxygen radius, is the atomic fraction of oxygen, and is number density. The number densities were taken from density measurements of the respective glasses at high pressures or by extrapolation of this data by using different equation of state (EOS) formalisms, when experimental density data are not available. The oxygen radii are more difficult to obtain, since the apparent O–O peaks in experimentally derived g(r) do not necessarily represent the shortest O–O distance. For example, by comparing the distances of the apparent O–O peak of the SiO2 glass at high pressures to the distances in crystalline analogue structures, it is clear that there has to be contributions with lower O–O distance than the peak position suggests. This can also be seen, for example, by the height increase of the minimum between the Si–O peak and the neighboring O–O peak in the g(r) with pressure (Fig. 1B). In Zeidler et al. (15), the A–O distance is used as reference distance, and the O–O distance is calculated from geometric considerations (e.g., for sixfold coordination in octahedral geometry). There, O–O distances for structures with a CN between 3–4 and 4–6 are calculated as weighted averages from the corresponding polyhedra, assuming a linear dependence. Kono et al. (16) applied this principle for sixfold to ninefold CN by using the GeO2 cotunnite-type structure predicted by first-principles calculations (32). They calculated the / ratio using average Ge–O and O–O distances up to 2.54 Å in the predicted cotunnite structure and applied this ratio for estimating the oxygen radius in the glass.
However, the atomic radii should be more closely represented by the smallest distances, whereas the larger distances are often induced by the specific medium-range structure of the material. To correct for this effect and obtain a more robust estimate, we used a different approach. We calculated the oxygen radius in the predicted ultrahigh pressure structures using the concept of mean fictive ionic radii (MEFIR) (33), which weighs shorter bond distances more than larger bond distances. On this basis, we recalculated / = 0.593 and for the predicted cotunnite structure of GeO2 and SiO2, respectively. For the predicted GeO2 and SiO2 Fe2P-type structures, we obtained and , respectively. Furthermore, while the apparent Ge–O/Si–O CN for both structures, cotunnite-type and Fe2P-type, is 9, the polyhedron of the cotunnite-type structure is much more distorted. To account for this distortion, Hoppe (33) introduced the concept of effective CN (ECoN), which counts the contribution from atoms deviating from the closest distance slightly less. This results in an ECoN of 7.7 for the cotunnite structure and of 8.5 for Fe2P-type structure. Using these values, we have calculated the OPF-CN systematics for our SiO2 glass data and recalculated the systematics for the GeO2 glass data (16).
For the SiO2 glass data, we used the Fe2P-type structure as endmember, and for the GeO2 glass data, we used the cotunnite structure as endmember, since these have been predicted to be the next stable crystalline phases at pressures higher than the maximum pressure reached in each experimental study, respectively (30, 32). The results are shown in Fig. 5.
Fig. 5.
Dependence of OPF on A–O CN for SiO2 glass from this study and GeO2 glass from ref. 16. We compare experimental data to calculated values for the Fe2P-type and cotunnite structural polymorphs for SiO2 (red left/right triangles) (30) and GeO2 (white up/down triangles) (32). Hereby, different directions of the symbols are for different cutoff values (2.1 and 2.5 Å) for the O–O MEFIR distance calculations for these crystal structures. The dashed blue line represents the Kepler conjecture (KC) marking the densest possible OPF [0.74 (34)]. The black diamond represents an “ideal” hypothetical close-packed AO2 structure where both atoms have the same size and contribute to the close packing equally; thus, A–B coordination will be 12, but the OPF is only two-thirds of the KC. The shaded areas are linear extrapolations from the ideal AO2 structure through the values of predicted crystalline high pressure phases to sixfold coordination. The magenta crosses show the results of the ab initio MD (AIMD) simulation for different densities (7–16 g/cm3 at 4,000 K).
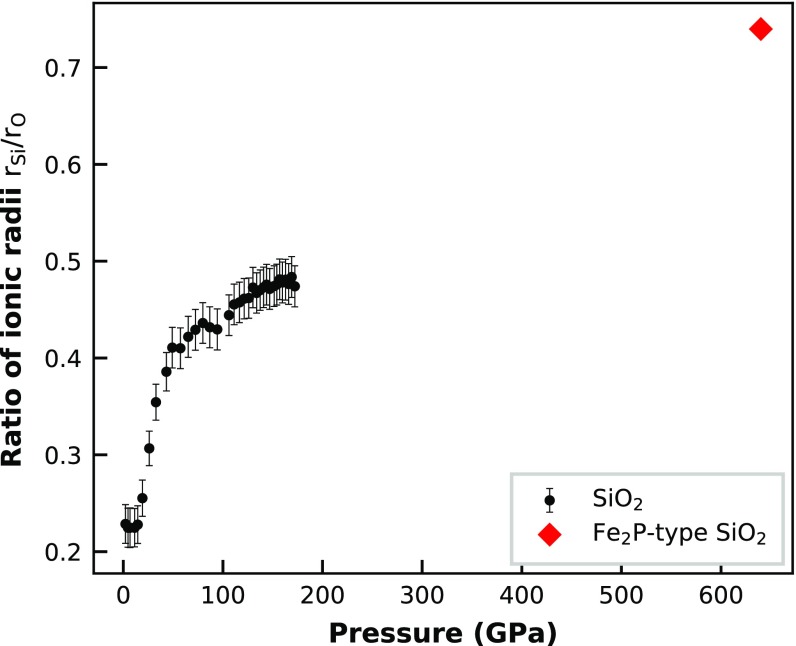
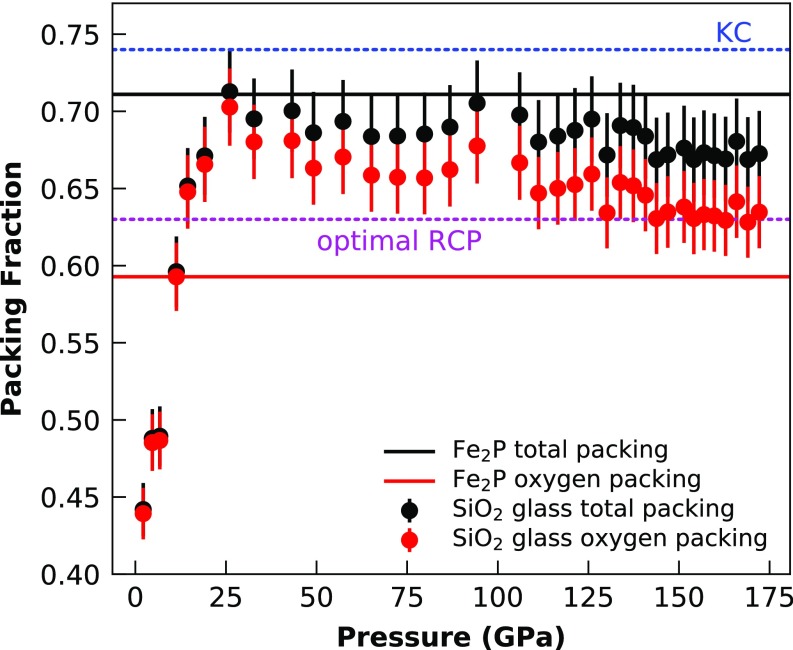
The -CN systematics of SiO2 glass up to sixfold coordination followed the trend in the compilation of ref. 15. The OPF for fourfold Si-O coordination ranged from 0.44 to 0.67. At this , the Si–O CN increased to 6. Above sixfold Si–O CN, actually decreased, rather than remaining more or less constant, as reported for GeO2 (16). However, this is an expected behavior: A close-packed oxygen structure only has fourfold (tetrahedral) and sixfold (octahedral) gaps; thus, to increase the Si–O CN to a larger value, the structure has to depart from a closed packed oxygen arrangement. The increasing CN >6 is caused by the increasing ionic radius ratio at very high pressures (Fig. S1). This results in an increasing Si-packing fraction by the expense of the OPF, while the total packing of the glass structure remains more or less constant (Fig. S2). If we imagine a closed packed structure of an ideal AO2 compound with , where both atoms are building the packing structure, would be 0.49 (2/3 of the KC). Projecting from this ideal AO2 structure through the SiO2 and GeO2 Fe2P-type and cotunnite-type structure points in the -CN plot explains the behavior of the SiO2 glass with CN between 6 and 7 very well, as shown in Fig. 5. Those results do not necessarily imply that the structure of the SiO2 glass will eventually reach a of the KC at 0.74. It could also be that maximum remains at 0.71 up to ultrahigh pressures, as is approximately seen for our high-pressure SiO2 glass data in Fig. S2. However, the projection in Fig. 5 clearly shows the trend that Si plays a more and more important role in building the packing structure of the SiO2 glass at ultrahigh pressures, which will inevitably also result in larger and larger CNs. Another important point to make here is that and of the SiO2 glass at pressures >20 GPa are already above the so-called optimal random close packing (RCP) limit of equal spheres [0.64 (Fig. S2)] (35). This implies that this optimal RCP limit, which was empirically derived for hard sphere objects, does not necessarily apply for glass structures.
Fig. S1.
The ratio of the atomic Si and O radius against pressure for the SiO2 glass and predicted Fe2P-type structure of crystalline SiO2 (30).
Fig. S2.
The packing fraction of the atoms against pressure. Comparing the total packing (Si + O) against the oxygen packing shows that at low pressures, the total packing is mainly induced by the oxygen atoms, whereas at higher pressures, the Si atoms become more and more important. The total packing fraction seems to be more or less constant within error bars >25 GPa and never rises above the total packing fraction of the predicted crystalline Fe2P-type structure of SiO2 at ultrahigh pressures (640 GPa) (30). The data are compared with the optimal closed packing of equal spheres defined by the KC at 0.74 and to the optimal RCP of equal spheres at 0.64.
The recalculated Ge–O CN to oxygen packing systematics of GeO2 glass data from Kono et al. (16) shows a similar trend as seen for the SiO2 glass (Fig. 5). Whereas the calculations in Kono et al. (16) give a constant oxygen packing >6 CN (see figure 6 in ref. 16), using the MEFIR estimation of the oxygen radius in combination with the lower ECoN number of the cotunnite structure results in a decreasing for CNs >6. This is following the predicted trend extrapolated from the ideal AO2 to the predicted Fe2P-type cotunnite structures. Thus, the decreasing OPF, and therefore a deviation from a closed packed oxygen lattice for CNs >6, seems to be a general behavior of crystalline and amorphous AO2 structures.
To test our method of using MEFIR and ECoN of the predicted high-pressure structures as a basis for extrapolation above sixfold Si–O coordination, we performed ab initio MD (AIMD) simulations of SiO2 glass at very high densities, from 7 to 16 g/cm3. The simulations were done at 4,000 K to have enough kinetic energy for the structures to relax in a reasonable time frame and reach pseudostable configurations, but not enough temperature to be in the molten state for these densities. While the AIMD simulations might not be a perfectly accurate description of how the SiO2 glass would behave at those very high densities due to the limited simulation time and small number of atoms, it still is a viable tool for predicting the general behavior of SiO2 at ultrahigh pressures. The AIMD simulation ηO-CN results plot remarkably well in the predicted region spanned between the extrapolated ideal AO2 structure and the predicted high-pressure polymorphs (Fig. 5), thus, confirming the validity of our approach for the calculation of ηO-CN systematics for the SiO2 and GeO2 glasses for above sixfold Si–O coordination.
Materials and Methods
Experimental Details.
The high-pressure X-ray diffraction experiments were performed at the GSECARS, 13-IDD beamline, Advanced Photon Source, Argonne National Laboratory. A BX90 DAC (36) was used for pressure generation, and all measurements were collected at room temperature. An incident monochromatic X-ray beam with an energy of 40 keV and 2.53 m beam size was used. An MCC as described in ref. 17 with a 50-m inner slit size and 200-m outer slit size was used. Commercially available SiO2 glass was packed in the pressure chamber in a Re gasket; beveled diamonds with 120-m culet size were used; and no pressure medium was used. A small piece of gold was added as pressure calibrant, whereby pressure was estimated before and after each measurement based on the known equation of state (EOS) of gold (37), with the reported pressures being the average, and the difference was used as error estimate. Diffraction data were collected with a Mar345 image plate detector, which was calibrated by using a LaB6 standard. The typical collection time was 300 s.
Data Analysis.
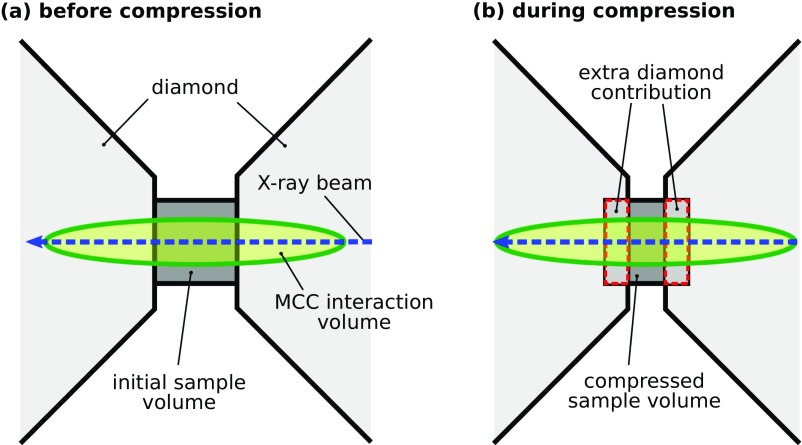
Detector calibration, image integration, and intensity corrections for oblique X-ray to detector angle, c-BN seat and diamond absorption were performed by using the Dioptas software package (38). The resulting diffraction patterns were corrected for an additional diamond Compton scattering contribution, which was necessary because the background measurement before compression was measured with a thicker sample chamber than the compressed sample material at high pressure (Fig. S3). The thinner sample chamber resulted in more diamond in the volume of diffraction constrained by the MCC. Both the sample signal and the additional diamond Compton scattering contribution were corrected for the transfer function of the MCC (39).
Fig. S3.
Schematic drawing of the interaction volumes constrained by the MCC in combination with DACs. The real MCC interaction volumes are actually dependent on diffraction angle. See ref. 39 for details. A shows the configuration before compression, and B shows the configuration during compression. Typically, the background signal is collected from an empty cell prior to compression (A). After compression of the sample chamber, additional diamond material enters the MCC interaction volume. Thus, for correct data treatment, we have to account for additional diamond Compton scattering as background signal. This signal will increase with pressure, as the sample height will get smaller and smaller.
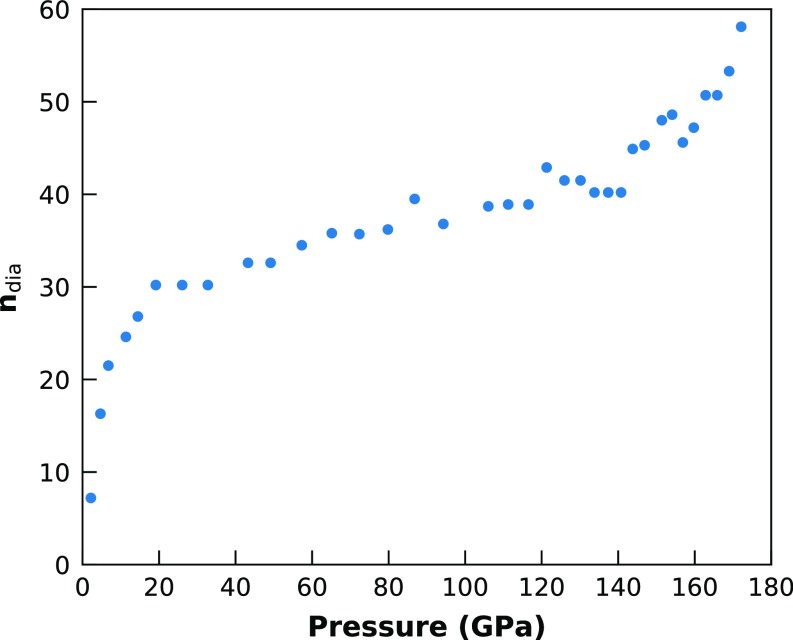
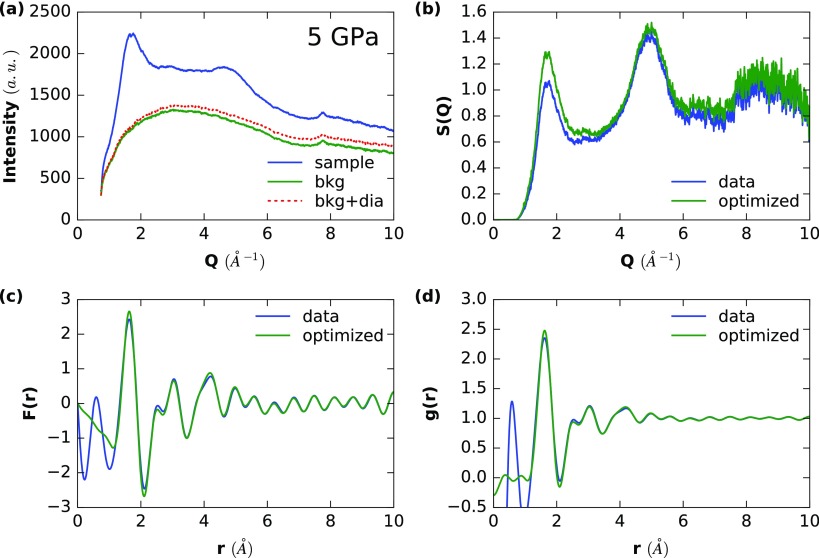
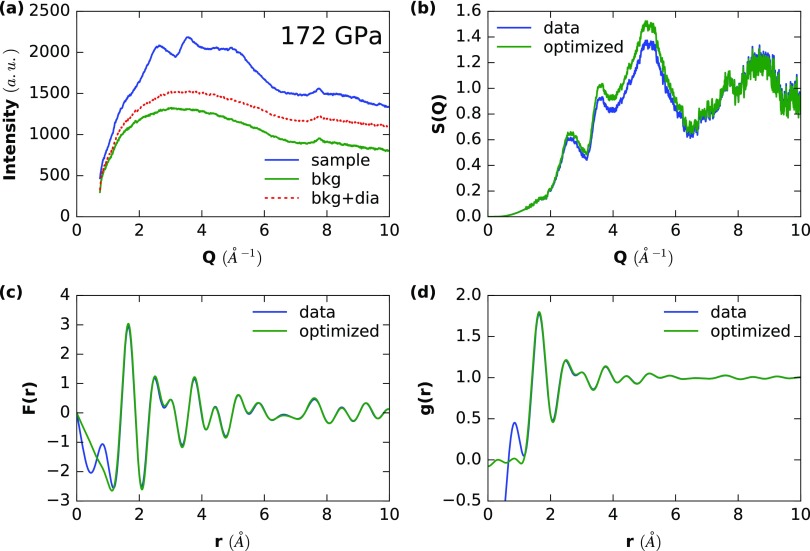
The Faber–Ziman structure factors and pair distribution functions were calculated by using the Glassure software package (40). The data-processing steps included: (i) normalization to atomic units by fitting the high part of the wave vector Q to the calculated scattering factors of SiO2, (ii) extrapolation of the resulting S(Q) to zero by using a second-order polynomial function with , with y = 0 for x c, and (iii) optimization of the data using a Kaplow-type correction (41) with typically three iterations. The amount of extra diamond Compton scattering ndia was optimized by minimization of the amplitude of the oscillations before the first peak in g(r) after Fourier transformation from S(Q) to g(r) before any Kaplow-type correction (41). The resulting ndia are shown in Fig. S4. No Lorch-modification (42) function was used, since it was found to be unnecessary. Number densities for calculation of g(r) and CNs were estimated by using two third-order Birch–Murnaghan EOSs for different pressure regions: (i) up to 45 GPa with = 2.212 , K0 = 18.88 GPa and K′ = 3.53; (ii) >45 GPa with = 3.86 , K0 = 176 GPa and K′ = 4.5.* These EOSs have been determined by X-ray absorption up to almost 100 GPa. Because our data did not show any sign of abrupt structural changes >100 GPa, we assumed the estimated EOS parameters to be valid up to 172 GPa. Example analyses at 5 GPa and 172 GPa are shown in Figs. S5 and Fig. S6, respectively.
Fig. S4.
Pressure evolution of the amount of extra diamond Compton scattering ndia (Fig. S1) for the compression run. The amount has been optimized by minimization of the amplitude of the oscillations before the first peak in g(r) after Fourier transformation from S(Q) to g(r) before any Kaplow-type correction (41).
Fig. S5.
Example analysis for the data point at 5 GPa. (A) Showing the raw intensities, with dia representing the extra contribution of diamond Compton scattering. (B–D) The raw and optimized Faber–Ziman structure factors S(Q) (B), F(r) (C), and g(r) (D).
Fig. S6.
Example analysis of SiO2 glass for the data point at the 172 GPa. (A) The raw intensities are shown, whereby dia represents the extra contribution of diamond Compton scattering which needs to be subtracted. (B–D) The raw and optimized Faber-Ziman structure factors S(Q) (B), F(r) (C), and g(r) (D).
CN Estimation.
In principle CNs can be extracted from the calculated pair distribution functions g(r) by integrating over the first peak. This works directly for monatomic materials. However, for materials with two or more elements, there exists no direct solution, since g(r) is influenced by weighing of the partial S(Q) with the X-ray form factors f(Q) for each element. One way to overcome this is by calculating pseudopartial structure factors through reweighing of the original S(Q) using the X-ray form factors f(Q) for Si and O:
where is the weighing factor, and are the relative concentrations of each element ( and ), and are the X-ray form factors for Si and O, respectively. By performing the Fourier transform of , we obtain the pseudopartial pair distribution function :
where is the number density in atoms per cubic Å (e.g., 0.0662 Å−3 for SiO2 glass at ambient conditions). This partial pair distribution function can now be used to estimate the Si-O CN by integrating over the first peak, provided that the peak is only from an Si-O contribution. In this case, we do an integration over the full peak up to the first minimum in the curve after the peak:
| [1] |
However, this method is only reliable if the peak is well separated and we are sure there is no other contribution (e.g., from O-O). In the case for the SiO2 glass data at high pressures, this method works very well up to sixfold coordination at 40–50 GPa. At higher pressures, it is known from crystalline polymorphs of SiO2 that the O–O distances can be as low as 1.9 Å,—for example, for -PbO2 type SiO2 at 120 GPa using the EOS data of ref. 51, which will be well within the integration area (the usual is at 2.1 Å) and thus leading to erroneously high Si–O CNs. To avoid this issue, we can also assume that the peak is symmetric and integrate over the left half of the peak and double the intensity, whereby the will be the maximum in of the first peak:
| [2] |
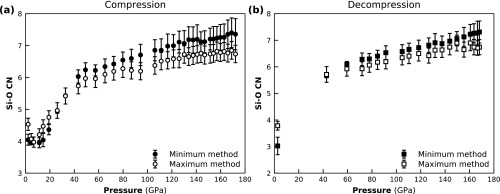
This maximum peak integration method is only reliable if the distribution is symmetric, which is often not the case for glasses. Depending on the type of asymmetry of the peak, the different methods will give upper and lower limits of the actual average CN present in the glass. For the analysis of the SiO2 glass presented here, we chose to use Eq. 1 for the CN up to 40 GPa, because the peak is well separated, and we can account for the asymmetric peak shape. Eq. 2 was used at higher pressures to avoid the artificially high CN due to the extra O–O contribution. Comparison between the extracted CN of both methods is shown in Fig. S7. The minimum method [Eq. 1] leads to very high CNs > GPa, probably due to extra O–O contributions, and the peak maximum method leads to slightly higher CNs <30 GPa, due to not representing the slight asymmetric nature of the Si–O peak and therefore overestimating the CN. The CN errors were calculated by the variation within the estimate of the r-space uncertainty used for the Si–O distances.
Fig. S7.
Comparison between the different CN estimates when using the minimum method (Eq. 1) or the maximum method (Eq. 2). Shown are compression (A) and decompression (B).
Computational Details.
The AIMD simulations are based on a PBE exchange correlation functional (43) in conjunction with Goedecker-type (44) pseudopotentials as implemented in the CPMD code (45). Born–Oppenheimer simulations were performed in canonical ensemble with a Nosé–Hoover thermostat (46, 47) and with 264 atoms. An integration time step of 0.3 fs was used, and each density was equilibrated for at least 3 ps. Parameters from the simulations were extracted from a subsequent production run with a run time of at least 6 ps. A good compromise between accuracy and computation speed was found for the plane-wave expansion of the Kohn–Sham orbitals with a cutoff of 100 Ry. We calculated based on box size and number of O atoms in the simulation cell and the Si–O CN was estimated by integrating the first peak of the time averaged Si–O pair distribution function up to the first minimum after the peak (Eq. 1).
The starting configuration for the AIMD simulations was produced by classical MD (CMD) simulations using the DL_POLY Classic code (48) in combination with Morse potentials (49, 50) and a time step of 1 fs. The CMD simulations were run in the NPT ensemble with a Nosé–Hoover thermostat (46, 47). An initial randomized cell was created with 264 atoms and a number density of 0.066 atoms/Å3, whereby atoms were moved until all atomic distances were above reasonable cutoff distances (d1.4 Å; d2 Å and d2 Å). This cell was then equilibrated at ambient pressure and 3,000 K for 100 ps. After this, the cell was equilibrated at 70 GPa and 5,000 K for 1,000 ps. This structure produced by the CMD simulations was further equilibrated by an AIMD run of >30 ps at 4,000 K.
Acknowledgments
We thank S. Petitgirard for providing preliminary EOS data for SiO2 glass. Y.W. was supported by NSF Grant EAR-1620548. Portions of this work were performed at GeoSoilEnviroCARS (The University of Chicago, Sector 13), Advanced Photon Source (APS), Argonne National Laboratory. GeoSoilEnviroCARS is supported by NSF Earth Sciences Grant EAR-1128799) and Department of Energy (DOE) GeoSciences Grant DE-FG02-94ER14466. This research used resources of the APS, a DOE Office of Science User Facility operated for the DOE Office of Science by Argonne National Laboratory under Contract DE-AC02-06CH11357. We thank the Gauss Center for Supercomputing (GCS) for providing computing time for a GCS Large Scale Project on the GCS share of the supercomputer JUQUEEN (51) at Jülich Supercomputing Center (JSC). GCS is the alliance of the three national supercomputing centers, Höchstleistungsrechenzentrum Stuttgart (Universität Stuttgart), JSC (Forschungszentrum Jülich), and Leibniz-Rechenzentrum (Bayerische Akademie der Wissenschaften), funded by the German Federal Ministry of Education and Research and the German State Ministries for Research of Baden-Württemberg, Bayern, and Nordrhein-Westfalen.
Footnotes
The authors declare no conflict of interest.
This article is a PNAS Direct Submission.
*Petitgirard S, et al. (2017) Goldschmidt Conference, August 13–18, 2017, Paris.
This article contains supporting information online at www.pnas.org/lookup/suppl/doi:10.1073/pnas.1708882114/-/DCSupplemental.
References
- 1.Stixrude L, de Koker N, Sun N, Mookherjee M, Karki BB. Thermodynamics of silicate liquids in the deep Earth. Earth Planet Sci Lett. 2009;278:226–232. [Google Scholar]
- 2.Tonks WB, Melosh HJ. Magma ocean formation due to giant impacts. J Geophys Res. 1993;98:5319–5333. [Google Scholar]
- 3.Revenaugh J, Sipkin SA. Seismic evidence for silicate melt atop the 410-km mantle discontinuity. Nature. 1994;369:474–476. [Google Scholar]
- 4.Song TRA, Helmberger DV, Grand SP. Low-velocity zone atop the 410-km seismic discontinuity in the northwestern United States. Nature. 2004;427:530–533. doi: 10.1038/nature02231. [DOI] [PubMed] [Google Scholar]
- 5.Williams Q, Garnero EJ. Seismic evidence for partial melt at the base of Earth’s mantle. Science. 1996;273:1528–1530. [Google Scholar]
- 6.Wright AC. Neutron scattering from vitreous silica. V. The structure of vitreous silica: What have we learned from 60 years of diffraction studies? J Non Cryst Sol. 1994;179:84–115. [Google Scholar]
- 7.Benmore CJ, et al. Structural and topological changes in silica glass at pressure. Phys Rev B. 2010;81:054105. [Google Scholar]
- 8.Meade C, Hemley RJ, Mao HK. High-pressure x-ray diffraction of SiO2 glass. Phys Rev Lett. 1992;69:1387–1391. doi: 10.1103/PhysRevLett.69.1387. [DOI] [PubMed] [Google Scholar]
- 9.Sato T, Funamori N. High-pressure structural transformation of SiO2 glass up to 100 GPa. Phys Rev B. 2010;82:184102. [Google Scholar]
- 10.Sato T, Funamori N. Sixfold-coordinated amorphous polymorph of SiO2 under high pressure. Phys Rev Lett. 2008;101:255502. doi: 10.1103/PhysRevLett.101.255502. [DOI] [PubMed] [Google Scholar]
- 11.Brazhkin VV, Lyapin AG, Trachenko K. Atomistic modeling of multiple amorphous-amorphous transitions in SiO2 and GeO2 glasses at megabar pressures. Phys Rev B. 2011;83:132103. [Google Scholar]
- 12.Karki BB, Bhattarai D, Stixrude L. First-principles simulations of liquid silica: Structural and dynamical behavior at high pressure. Phys Rev B. 2007;76:104205. [Google Scholar]
- 13.Teter DM, Hemley RJ, Kresse G, Hafner J. High pressure polymorphism in silica. Phys Rev Lett. 1998;80:2145–2148. [Google Scholar]
- 14.Murakami M, Bass JD. Spectroscopic evidence for ultrahigh-pressure polymorphism in SiO2 glass. Phys Rev Lett. 2010;104:025504. doi: 10.1103/PhysRevLett.104.025504. [DOI] [PubMed] [Google Scholar]
- 15.Zeidler A, Salmon PS, Skinner LB. Packing and the structural transformations in liquid and amorphous oxides from ambient to extreme conditions. Proc Natl Acad Sci USA. 2014;111:10045–10048. doi: 10.1073/pnas.1405660111. [DOI] [PMC free article] [PubMed] [Google Scholar]
- 16.Kono Y, et al. Ultrahigh-pressure polyamorphism in GeO2 glass with coordination number >6. Proc Natl Acad Sci USA. 2016;113:3436–3441. doi: 10.1073/pnas.1524304113. [DOI] [PMC free article] [PubMed] [Google Scholar]
- 17.Mezouar M, et al. Multichannel collimator for structural investigation of liquids and amorphous materials at high pressures and temperatures. Rev Sci Instrum. 2002;73:3570–3574. doi: 10.1063/1.3551988. [DOI] [PubMed] [Google Scholar]
- 18.Inamura Y, Katayama Y, Utsumi W, Funakoshi KI. Transformations in the intermediate-range structure of SiO2 glass under high pressure and temperature. Phys Rev Lett. 2004;93:015501. doi: 10.1088/0953-8984/19/41/415104. [DOI] [PubMed] [Google Scholar]
- 19.Funamori N, Sato T. A cubic boron nitride gasket for diamond-anvil experiments. Rev Sci Instrum. 2008;79:053903. doi: 10.1063/1.2917409. [DOI] [PubMed] [Google Scholar]
- 20.Elliott S. Origin of the first sharp diffraction peak in the structure factor of covalent glasses. Phys Rev Lett. 1991;67:711–714. doi: 10.1103/PhysRevLett.67.711. [DOI] [PubMed] [Google Scholar]
- 21.Zeidler A, et al. High-pressure transformation of SiO2 glass from a tetrahedral to an octahedral network: A joint approach using neutron diffraction and molecular dynamics. Phys Rev Lett. 2014;113:135501. doi: 10.1103/PhysRevLett.113.135501. [DOI] [PubMed] [Google Scholar]
- 22.Li N, Sakidja R, Aryal S, Ching Wy. Densification of a continuous random network model of amorphous SiO2 glass. Phys Chem Chem Phys. 2014;16:1500–1514. doi: 10.1039/c3cp53192a. [DOI] [PubMed] [Google Scholar]
- 23.Wu M, Liang Y, Jiang Jz, Tse JS. Structure and properties of dense silica glass. Sci Rep. 2012;2:398. doi: 10.1038/srep00398. [DOI] [PMC free article] [PubMed] [Google Scholar]
- 24.Sato T, Funamori N, Yagi T. Differential strain and residual anisotropy in silica glass. J Appl Phys. 2013;114:103509. [Google Scholar]
- 25.Prakapenka V, Shen G, Dubrovinsky L, Rivers M, Sutton S. High pressure induced phase transformation of SiO2 and GeO2: difference and similarity. J Phys Chem Sol. 2004;65:1537–1545. [Google Scholar]
- 26.Kuwayama Y, Hirose K, Sata N, Ohishi Y. The pyrite-type high-pressure form of silica. Science. 2005;309:923–925. doi: 10.1126/science.1114879. [DOI] [PubMed] [Google Scholar]
- 27.Dubrovinsky LS, et al. A class of new high-pressure silica polymorphs. Phys Earth Planet Inter. 2004;143:231–240. [Google Scholar]
- 28.Hemley RJ, et al. Pressure-induced amorhpization of crystalline silica. Nature. 1988;334:52–54. [Google Scholar]
- 29.Oganov A, Gillan M, Price G. Structural stability of silica at high pressures and temperatures. Phys Rev B. 2005;71:064104. [Google Scholar]
- 30.Tsuchiya T, Tsuchiya J. Prediction of a hexagonal SiO2 phase affecting stabilities of MgSiO3 and CaSiO3 at multimegabar pressures. Proc Natl Acad Sci USA. 2011;108:1252–1255. doi: 10.1073/pnas.1013594108. [DOI] [PMC free article] [PubMed] [Google Scholar]
- 31.Lyle MJ, Pickard CJ, Needs RJ. Prediction of 10-fold coordinated TiO2 and SiO2 structures at multimegabar pressures. Proc Natl Acad Sci USA. 2015;112:6898–6901. doi: 10.1073/pnas.1500604112. [DOI] [PMC free article] [PubMed] [Google Scholar]
- 32.Dekura H, Tsuchiya T, Tsuchiya J. First-principles prediction of post-pyrite phase transitions in germanium dioxide. Phys Rev B. 2011;83:134114. [Google Scholar]
- 33.Hoppe R. Effective coordination numbers (ECoN) and mean fictive ionic radii (MEFIR) Z Krist New Cryst Struct. 1979;150:23–52. [Google Scholar]
- 34.Hales T. A proof of the kepler conjecture. Ann Math. 2005;162:1065–1185. [Google Scholar]
- 35.Jaeger H, Nagel SR. Physics of the granular state. Science. 1992;255:1523–1532. doi: 10.1126/science.255.5051.1523. [DOI] [PubMed] [Google Scholar]
- 36.Kantor I, et al. BX90: A new diamond anvil cell design for x-ray diffraction and optical measurements. Rev Sci Instrum. 2012;83:125102. doi: 10.1063/1.4768541. [DOI] [PubMed] [Google Scholar]
- 37.Fei Y, et al. Toward an internally consistent pressure scale. Proc Natl Acad Sci USA. 2007;104:9182–9186. doi: 10.1073/pnas.0609013104. [DOI] [PMC free article] [PubMed] [Google Scholar]
- 38.Prescher C, Prakapenka VB. DIOPTAS: A program for reduction of two-dimensional x-ray diffraction data and data exploration. High Press Res. 2015;35:223–230. [Google Scholar]
- 39.Weck G, et al. Use of a multichannel collimator for structural investigation of low-Z dense liquids in a diamond anvil cell: Validation on fluid H2 up to 5 GPa. Rev Sci Instrum. 2013;84:063901. doi: 10.1063/1.4807753. [DOI] [PubMed] [Google Scholar]
- 40.Prescher C. Glassure: An API and GUI program for analyzing angular dispersive total X-ray diffraction data. Zenodo. 2017 doi: 10.5281/zenodo.880836. [DOI] [Google Scholar]
- 41.Kaplow R, Strong SL, Averbach BL. Radial density functions for liquid mercury and lead. Phys Rev. 1965;138:A1336–A1345. [Google Scholar]
- 42.Lorch E. Neutron diffraction by germania, silica and radiation-damaged silica glasses. J Phys C Solid State Phys. 1969;229:229–237. [Google Scholar]
- 43.Perdew JP, Burke K, Ernzerhof M. Generalized gradient approximation made simple. Phys Rev Lett. 1996;77:3865–3868. doi: 10.1103/PhysRevLett.77.3865. [DOI] [PubMed] [Google Scholar]
- 44.Goedecker S, Teter M, Hutter J. Separable dual-space Gaussian pseudopotentials. Phys Rev B. 1996;54:1703–1710. doi: 10.1103/physrevb.54.1703. [DOI] [PubMed] [Google Scholar]
- 45.Marx D, Hutter J. 2000. Ab-initio molecular dynamics: Theory and implementation. Modern Methods and Algorithms of Quantum Chemistry, NIC, ed Grotendorst J (Forschungszentrum Jülich, Jülich, Germany), Ist Ed, pp 301–449.
- 46.Nosé S, Klein ML. Constant pressure molecular dynamics for molecular systems. Mol Phys. 1983;50:1055–1076. [Google Scholar]
- 47.Hoover WG. Canonical dynamics: Equilibrium phase-space distributions. Phys Rev A. 1985;31:1695–1697. doi: 10.1103/physreva.31.1695. [DOI] [PubMed] [Google Scholar]
- 48.Smith W, Forester TR. DL_POLY_2.0: A general-purpose parallel molecular dynamics simulation package. J Mol Graph. 1996;14:136–141. doi: 10.1016/s0263-7855(96)00043-4. [DOI] [PubMed] [Google Scholar]
- 49.Takada A, Richet P, Catlow CRA, Price GD. Molecular dynamics simulations of vitreous silica structures. J Non Cryst Sol. 2004;345–346:224–229. [Google Scholar]
- 50.Demiralp E, Çağin T, Goddard WA., III Morse stretch potential charge equilibrium force field for ceramics: Application to the quartz-stishovite phase transition and to silica glass. Phys Rev Lett. 1999;83:3749–3749. [Google Scholar]
- 51.Jülich Supercomputing Centre JUQUEEN: IBM blue Gene/Q supercomputer system at the Jülich supercomputing centre. J Large Scale Res Facil JLSRF. 2015;1:A1. [Google Scholar]


