Significance
The perception and processing of rewarding events are essential for organismal survival. In Drosophila, several groups of neurons have been shown to mediate reward perception or processing. However, a complete description of the reward circuit is missing. Here, we describe a simple two-choice, high-throughput assay suitable for performing large neuronal activation screens for neural circuits involved in reward perception/processing. We characterized this assay using activation of neuropeptide F (NPF) neurons, a known rewarding experience for flies. Furthermore, using genetic intersectional strategies, we subdivided the NPF neurons into different classes and showed that the activation of a subset of small NPF neurons located in the dorsomedial brain is sufficient to trigger preference.
Keywords: reward circuit, high-throughput two-choice assay, optogenetics, neuropeptide F, Drosophila
Abstract
In their classic experiments, Olds and Milner showed that rats learn to lever press to receive an electric stimulus in specific brain regions. This led to the identification of mammalian reward centers. Our interest in defining the neuronal substrates of reward perception in the fruit fly Drosophila melanogaster prompted us to develop a simpler experimental approach wherein flies could implement behavior that induces self-stimulation of specific neurons in their brains. The high-throughput assay employs optogenetic activation of neurons when the fly occupies a specific area of a behavioral chamber, and the flies’ preferential occupation of this area reflects their choosing to experience optogenetic stimulation. Flies in which neuropeptide F (NPF) neurons are activated display preference for the illuminated side of the chamber. We show that optogenetic activation of NPF neuron is rewarding in olfactory conditioning experiments and that the preference for NPF neuron activation is dependent on NPF signaling. Finally, we identify a small subset of NPF-expressing neurons located in the dorsomedial posterior brain that are sufficient to elicit preference in our assay. This assay provides the means for carrying out unbiased screens to map reward neurons in flies.
A major breakthrough in understanding how the perception of reward is represented in the mammalian brain came from a series of experiments carried out by Olds and Milner in 1954 (1) in which rats implanted with stimulating electrodes in different brain regions learned to press a lever to receive intracranial self-stimulation (ICSS). Rats became “addicted” as they preferred to press the lever rather than receive a natural reward such as food and would endure an external electric foot shock to receive the ICSS (2). These experiments showed that specific brain regions encode reward and that activation of these regions is in itself rewarding. Some of these identified brain regions are now considered to form the mammalian reward system, whose principal components are the dopaminergic neurons located in the ventral tegmental region that project to the nucleus accumbens and medial prefrontal cortex (3).
We have opted to study the neural circuitry underlying the perception and processing of reward in Drosophila melanogaster given its sophisticated neurogenetic tools and the fact that the reward systems in flies and mammals share many characteristics at the molecular, cellular, and behavioral levels (4, 5). In Drosophila, reward can be demonstrated operationally when flies develop preference for a neutral odor after it has been paired with exposure to an experience that has positive valence (6). In this context, it is said that such an experience is rewarding or positively reinforcing to the fly. By using such conditioned odor preference assays (6, 7), it has been shown that flies perceive sucrose (6), water (8), alcohol intoxication (9), and mating (10) as rewarding, while noxious stimuli, such as electric shock, are perceived as aversive (6, 7). These findings parallel those in mammalian systems, underscoring the relevance of reward perception and processing in flies to our general understanding of reward (11–14).
In Drosophila, several groups of neurons have been shown to be involved in reward processing. For example, the protocerebral anterior medial (PAM) cluster of dopamine neurons is required for normal sucrose reward (15, 16). There is functional heterogeneity within this cluster, as different subsets of PAM dopamine neurons are involved in the sweet-only or sweet and nutritious sugar reward (17), as well as short-term and long-term appetitive memory formation (18). PAM dopaminergic neurons have also been shown to mediate normal water reward (8). Another interesting example are the Neuropeptide F (NPF) neurons, which regulate a wide range of behaviors related to known rewarding stimuli, such as ethanol preference (10), ethanol sensitivity (19), courtship (20), and sucrose sensitivity (21). It has also been shown that thermogenetic activation of NPF neurons can mimic the effect of starvation by gating the retrieval of appetitive olfactory memories (22). In addition, activation of NPF cells was able to reduce the rewarding effects of ethanol and was shown to be intrinsically rewarding (10). Moreover, it has been proposed that state of the fly reward system is regulated by the activity of NPF neurons (10).
Here, we describe and validate a high-throughput two-choice assay that employs the red-light–sensitive channelrhodopsin CsChrimson (23) to activate specific sets of defined neurons and measures the flies’ preference for the area of a behavioral chamber in which they can access this neuronal stimulation. We characterize the assay using activation of NPF neurons and map the effect to a small group of neurons located in the dorsomedial posterior brain. This assay is well-suited to carry out large-scale unbiased screens for neurons that contribute to reward circuits in Drosophila.
Results
NPF Neuron Activation Produces Preference.
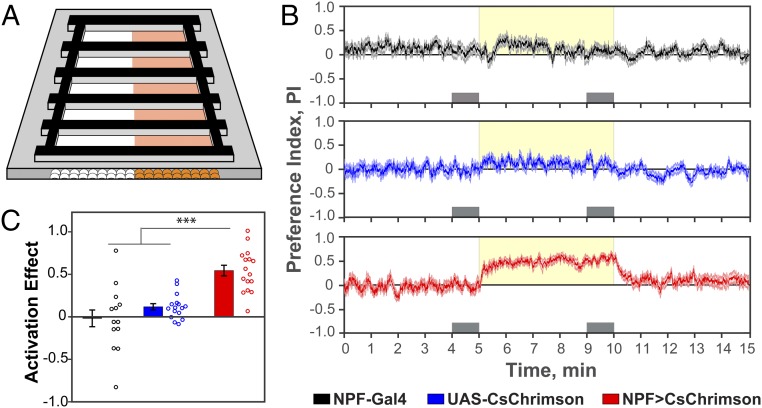
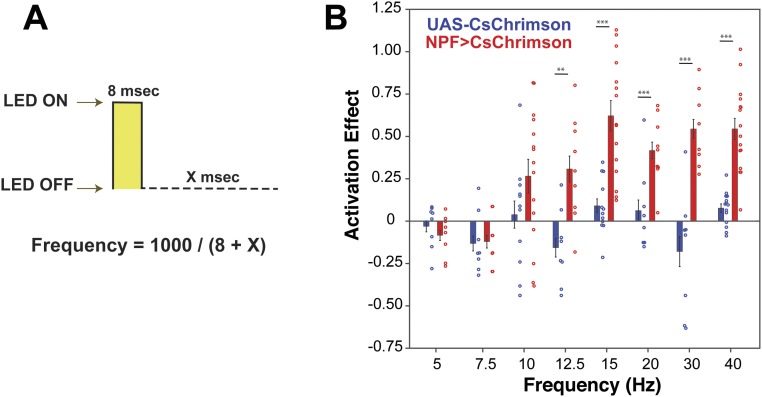
We developed a simple two-choice assay in which flies are able to demonstrate preference (or aversion) for having a specific subset of neurons experimentally activated. In the fly, neurons can be strongly activated by the channelrhodopsin CsChrimson (23); CsChrimson responds to red light (617 nm in our experiments) that traverses the flies’ cuticle, thus allowing analysis of behavior in freely moving flies. In our assay, groups of 10–12 male flies are introduced into rectangular chambers (Fig. 1A) and allowed to explore for 5 min (acclimation phase). This is followed by a 5-min period in which one side of the chamber is illuminated randomly with 617-nm light-emitting diodes (LEDs) (activation phase) at a frequency of 40 Hz (Fig. S1), and then by another 5 min without illumination (recovery phase). The position of each fly is tracked throughout the assay and the distribution of flies is expressed as a preference index (PI), which is calculated as the number of flies on the activation side minus the number on the nonactivation side divided by the total number of flies (Fig. 1B). A positive PI indicates preference for photoactivation, while a negative PI indicates aversion.
Fig. 1.
Flies exhibit preference for NPF neuron activation. (A) Schematic representation of the two-choice assay system. Flies are exposed to 617-nm light on only one side of the chambers. (B) Experimental data expressed as the mean ± SE of the preference index (PI) over time. The yellow shading indicates the side and period of activation. The gray boxes represent the periods of time used to calculate the activation effect (AE = mean PI during last minute of activation − mean PI during last minute of acclimation) (n = 13–16). (C) Activation effect for the data in B showing that experimental NPF>CsChrimson flies have a significant preference for activation of NPF neurons compared with control NPF-GAL4 and UAS-CsChrimson flies (n = 13–16; one-way ANOVA with Tukey’s post hoc test; ***P < 0.001) (frequency of activation, 40 Hz; 617-nm LED light intensity, 5 µW/mm2).
Fig. S1.
Frequency dose–response curve for activation of NPF neurons. (A) During each light pulse, the 617-nm LEDs remained ON for 8 ms followed by a variable amount of time, depending on the desired frequency, in which the 617-nm LEDs remained OFF. (B) Activation of NPF neurons at different frequencies, using a 617-nm LED light intensity of 5 µW/mm2, reveals that a minimum of 12.5 Hz is required for the flies to display a significant preference (unpaired t test for each frequency between the inactive control group and the experimental group; n = 7–16; **P < 0.01; ***P < 0.001).
To determine whether optogenetic activation of NPF neurons leads to preference in this assay, we used the GAL4/UAS binary expression system (24) to express CsChrimson in NPF neurons (19) (the expression pattern of NPF-GAL4 is shown in Figs. 7 and 8). Compared with genetic controls (NPF-GAL4 and UAS-CsChrimson), experimental NPF>CsChrimson males showed robust preference for the side of optogenetic activation (Fig. 1B). A similar effect was observed in females (see below). This preference was quantified by an activation effect (Fig. 1C), defined as the difference in the PIs between the last minute of activation and the last minute of acclimation (gray boxes in Fig. 1B).
Fig. 7.
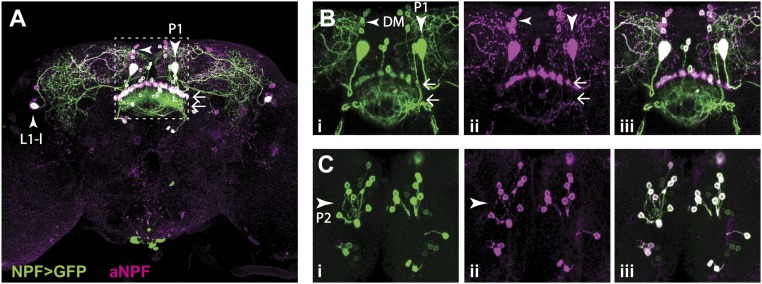
Expression of NPF and NPF-GAL4. (A) The NPF-GAL4 expression pattern includes two large neurons (P1 and L1-l) per hemisphere. (B) Higher-magnification view of the area indicated by the dashed box in A, showing that NPF is also expressed in several small neurons, located in the dorsal medial brain (DM) (left-facing arrowhead). Images correspond to the second third of the confocal stack. (C) Same area as shown in B, but images correspond to the first third of the confocal stack, which allows for the visualization of the cell bodies of the small neurons projecting to the FSB (horizontal arrows). Images correspond to the maximum intensity projection of different portions of a confocal stack collected from the posterior to the anterior end of the brain. Green: NPF-GAL4 expression pattern (i). Magenta: endogenous NPF expression (ii). White in iii: overlapping of NPF-GAL4 expression and NPF endogenous expression. (Magnification: 20×.)
Fig. 8.
Preference for the activation of specific subsets of NPF neurons. (A) Intersection of the NPF-LexA and NPFR-GAL4 drivers, yielding expression in only the big (L1-l + P1) NPF neurons. (B) The ss0020 split-GAL4 line labels a subset of P2 NPF neurons. Brains were imaged from posterior to anterior. Magenta: endogenous NPF. Green: CsChrimson::mVenus. (C) Activation of neither the big (L1-l + P1) nor P2 NPF neurons is sufficient to recapitulate the effect of activating all NPF neurons [n = 14–15; one-way ANOVA followed by Tukey's test. **P < 0.01] (frequency of activation, 40 Hz; 617-nm LED light intensity, 20 μW/mm2). (Magnification: 20×.)
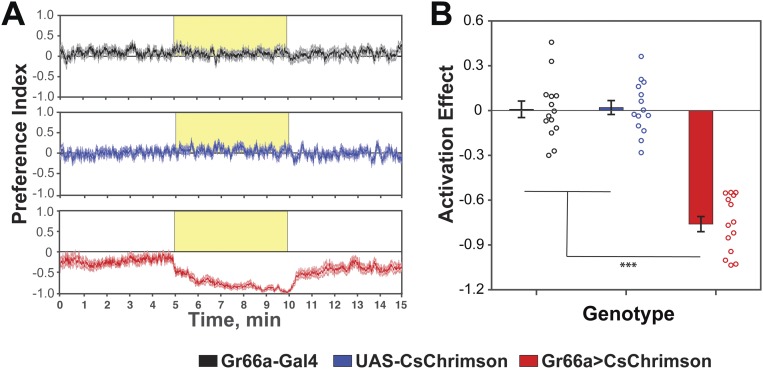
Activation of gustatory neurons expressing the bitter receptor Gr66a by either natural or artificial stimuli is aversive to flies (25, 26). In agreement with these observations, flies expressing CsChrimson in Gr66a neurons showed strong aversion to the side of activation in our setup (Fig. S2). Thus, the assay is able to reveal both preference and aversion to the activation of specific neurons in the fly nervous system.
Fig. S2.
Flies avoid activation of Gr66a neurons. (A) Experimental data expressed as the mean ± SE of the preference index over time (n = 14). (B) The activation effect for the data in A shows that flies display a significant avoidance for the activation of Gr66a neurons (n = 14; one-way ANOVA with Tukey’s post hoc test; ***P < 0.001) (frequency of activation, 40 Hz; 617-nm LED light intensity, 5 µW/mm2).
Individual Flies Display Preference.
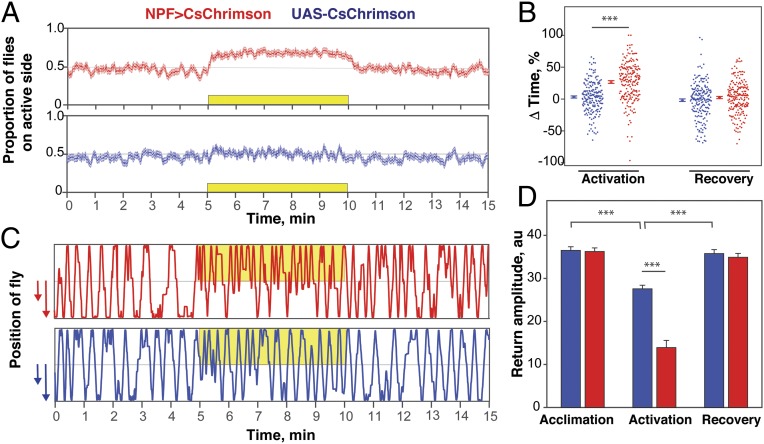
The behavior of flies can be significantly affected by group size, as has been shown in the context of CO2 avoidance (27) and aggregation on a food resource (28). We therefore asked whether flies tested individually display preference for NPF neuron activation. Single NPF>CsChrimson flies did indeed show a preference for (Fig. 2A) and spent more time on (Fig. 2B) the side of activation, an effect not seen in genetic control flies (UAS-CsChrimson).
Fig. 2.
Flies display preference for NPF neuron activation independently of social (group) context. (A) Traces over time for the proportion of flies on the active side for single experimental NPF>CsChrimson flies (n = 203; Top) or single control UAS-CsChrimson flies (n = 198; Bottom). The yellow box indicates the period of activation. Data are expressed as mean ± SE (frequency of activation, 40 Hz; 617-nm LED light intensity, 5 µW/mm2). (B) ΔTime (%) (preference) of flies during the activation and recovery phases, showing that single flies have a significant preference for the activation of NPF neurons (unpaired t test; ***P < 0.001). (C) Representative traces of experimental (Top) and control (Bottom) flies. Yellow indicates time and side of illumination. (D) Return amplitude data showing that, during the period of activation, experimental flies move for shorter distances into the unilluminated side compared with control flies (unpaired t test; ***P < 0.001).
We next analyzed the trajectories of individual flies throughout the assay to gain a more detailed account of their behavior. NPF>CsChrimson and genetic control flies commonly walked from one end of the chamber to the other during acclimation. During the activation phase, however, many NPF>CsChrimson flies returned to the activation side before reaching the opposite end of the box (Fig. 2C). This effect was quantified by the return amplitude (Fig. 2D), which is robustly reduced in NPF>CsChrimson flies during the activation phase. A reduced return amplitude was also observed in control flies (Fig. 2D). This is likely a reflection of mild phototaxis for 617-nm light; however, the magnitude of this effect was much lower than that seen on NPF>CsChrimson flies. We conclude that the observed preference is not a manifestation of collective behavior, although a minor component cannot be excluded.
NPF Neuron Activation Reduces Locomotion.
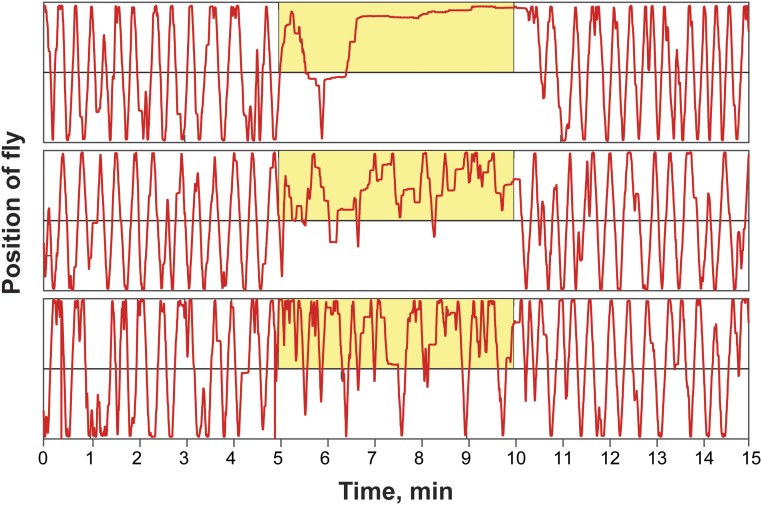
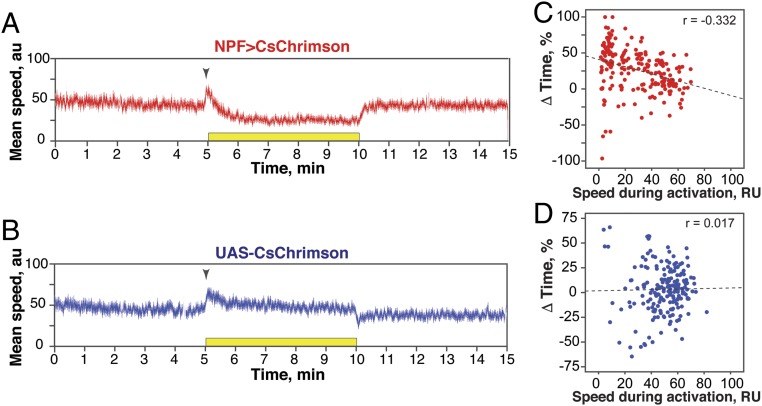
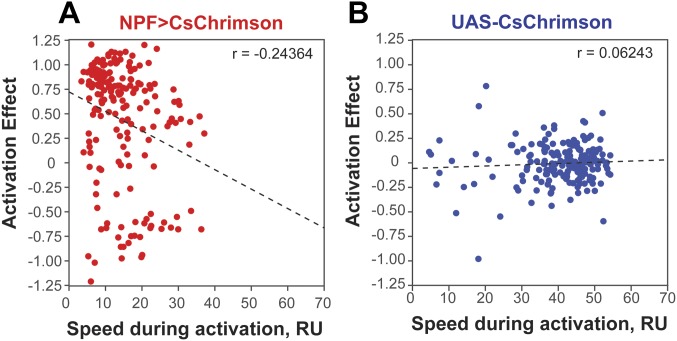
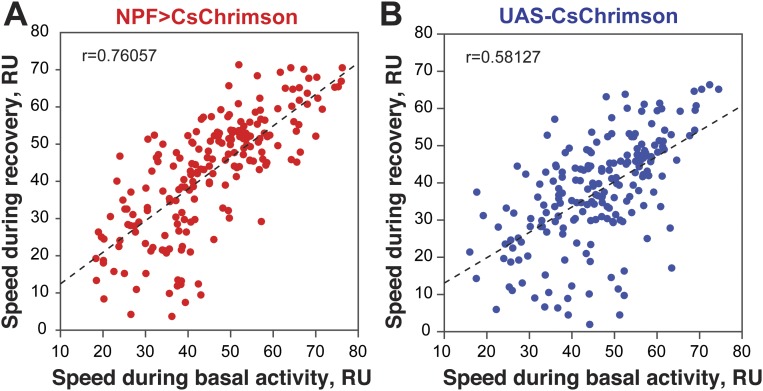
In addition to positional preference, we noticed that optogenetic activation of NPF neurons led to reduced locomotion in some flies (see example traces in Fig. S3). This quickly reversible effect was observed in flies assayed individually (Fig. 3) as well as in flies tested in groups of 10–12 (Fig. S4). Both experimental and control flies also reacted to the onset of illumination (“lights-on” effect; Fig. 3 A and B); control flies also showed a “lights-off” effect. While NPF>CsChrimson flies do not appear sedated during illumination (see below), a primary effect of NPF neuron activation on locomotion could provide a parsimonious explanation for the accumulation of flies on the side of activation. Indeed, a negative correlation was observed between the speed of individual NPF>CsChrimson flies and the time spent on the activation side (Fig. 3C); no correlation was seen in control flies (Fig. 3D). Interestingly, while individual flies displayed greatly different levels of locomotion during the activation period, their activity during the recovery phase was highly correlated with that seen during the acclimation phase (Fig. S5); this suggests that individual flies have stable levels of locomotion that are resistant to optogenetic manipulation of activity. Importantly, the preference of individual flies was not correlated with the flies’ speed during the acclimation phase.
Fig. S3.
Representative traces of single NPF>CsChrimson flies. Representative position over time traces for NPF>CsChrimson flies showing different levels of locomotion during the activation period. Locomotor activity during the acclimation and recovery phases are comparable. The yellow box indicates the side and period of activation (617-nm LED light intensity, 5 µW/mm2; frequency of activation, 40 Hz).
Fig. 3.
Effect of NPF neuron activation on single fly locomotion. (A and B) Experimental data for NPF>CsChrimson flies (n = 203) (A) or control UAS-CsChrimson flies (n = 198) (B), expressed as the mean ± SE of the speed over time. (C and D) Scatterplot of the ΔTime (%) (preference) vs. speed during activation for single experimental flies (n = 203) (C) or single control flies (n = 198) (D), showing that preference and speed during activation are negatively correlated in NPF>CsChrimson flies (r = −0.332; P < 0.001), but not in control flies (r = 0.017; P > 0.05).
Fig. S4.
Scatterplot of the preference (activation effect) vs. speed during activation for grouped NPF>CsChrimson flies (n = 186) (A) or grouped control flies (n = 179) (B), showing that preference and speed during activation are negatively correlated in NPF>CsChrimson flies (r = −0.2517; P < 0.001), but not in control flies (r = 0.0637; P > 0.05).
Fig. S5.
Scatterplot of the speed during the recovery phase vs. speed during acclimation phase for single NPF>CsChrimson flies (n = 203) (A) or single control flies (n = 198) (B), showing that speed during recovery and acclimation are positively correlated in both NPF>CsChrimson flies (r = 0.7606; P < 0.001) and control flies (r = 0.5813; P < 0.001).
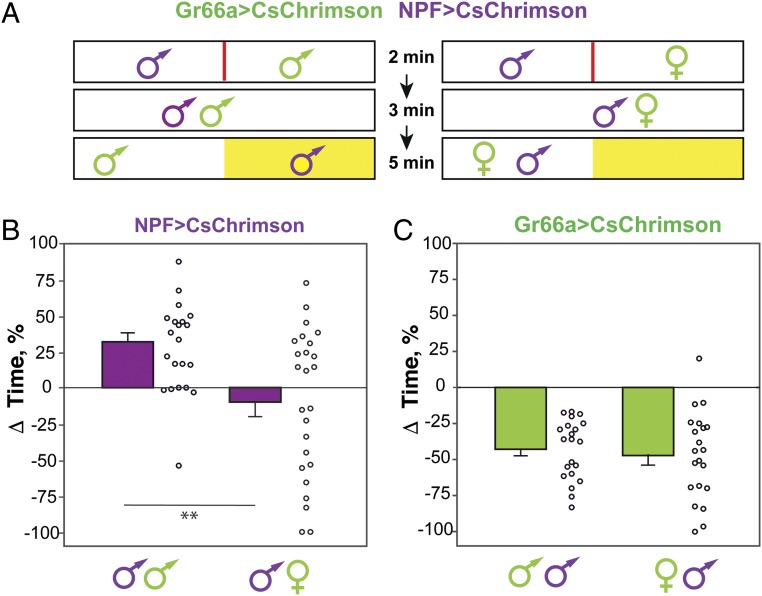
To ask whether less active NPF>CsChrimson flies are still able to respond to external cues or motivational drives during the activation phase, we devised a “dilemma” experiment in which individual NPF>CsChrimson males were asked to choose between the activation of their NPF neurons and a virgin female. NPF>CsChrimson males were paired with a virgin female expressing CsChrimson in bitter-sensing Gr66a neurons (Gr66a>CsChrimson). The flies were initially separated by a divider; after 2 min, the divider was removed and flies were allowed to explore for 3 min before the start of illumination (Fig. 4A). Upon illumination of one side of the box (always the side opposite to the one the NPF>CsChrimson male was originally restrained to), and in the absence of dilemma, we expect NPF>CsChrimson males to prefer the side of activation and Gr66a>CsChrimson virgins to avoid it. To control for an effect of general social interaction, we paired one NPF>CsChrimson male with one Gr66a>CsChrimson male. In the latter control condition, NPF>CsChrimson males showed preference for the light, while the Gr66a>CsChrimson males avoided the light (Fig. 4 B and C), as shown by their positive and negative Δtime (% time on LED+ side − % time on LED– side), respectively. In contrast, NPF>CsChrimson males showed a strong reduction in Δtime when paired with a Gr66a>CsChrimson virgin female (Fig. 4B). This effect was not due to a change in the virgin females’ behavior, as they continued to avoid the light (Fig. 4C). NPF>CsChrimson males that did not experience the side of illumination were excluded from the analysis. These data show that there is competition between a natural reward (a virgin as potential mate) and the experience of NPF neuron activation and that NPF>CsChrimson males are able to move freely between the two choices. Light-induced quiescence is therefore the consequence rather than the cause of the strong preference observed with NPF>CsChrimson flies.
Fig. 4.
Competition between natural and artificial rewards. (A) The chambers were modified by introducing an acrylic divider. A single fly (male or virgin female), expressing CsChrimson in NPF neurons or Gr66a neurons, was introduced into each side of the chamber for 2 min, after which the divider was removed and flies had the possibility to interact with each other for 3 min (flies that either copulated or failed to interact during this period were excluded from the analysis). This was followed by light stimulation (yellow area) in only one side of the chambers for a period of 5 min. (B) Activation effect [ΔTime (%)] data for single NPF>CsChrimson male flies paired with a single male (control group) or single virgin female (experimental group) Gr66a>CsChrimson fly. When paired with a virgin female, male flies show reduced preference for the activation of NPF neurons (n = 21–25; unpaired t test, **P < 0.01). (C) Activation effect [ΔTime (%)] data for flies expressing CsChrimson in Gr66a neurons, for both control and experimental groups. In both cases, flies avoid the activation of Gr66a neurons (n = 21–25; unpaired t test, **P < 0.01) with no difference between them (unpaired t test, P > 0.05) (frequency of activation, 10 Hz; 617-nm LED light intensity, 5 µW/mm2).
Activation of NPF Neurons Is Rewarding.
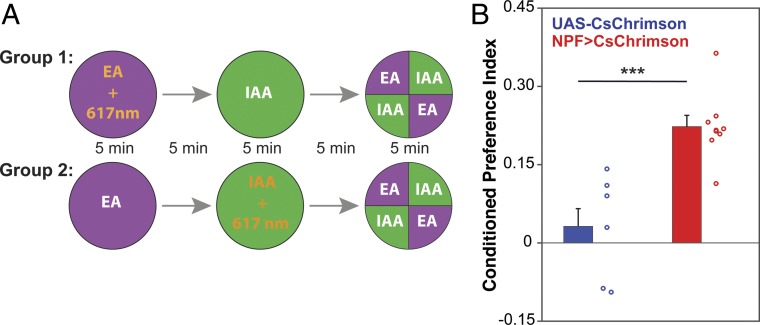
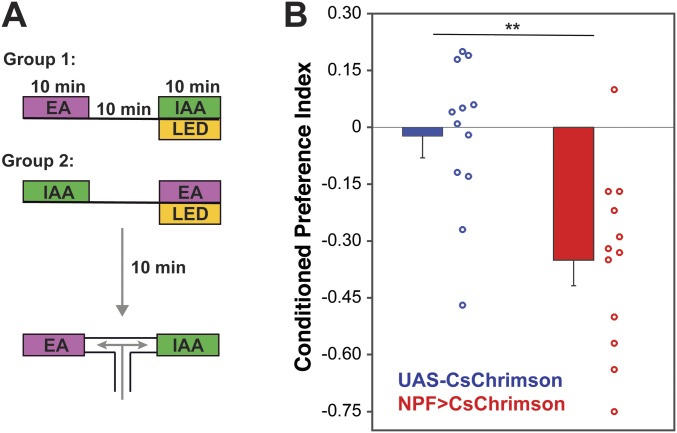
To determine whether the preference shown by the NPF>CsChrimson flies is an effect of the activation of NPF neurons being a rewarding stimulus, we carried out olfactory conditioning experiments using isoamyl alcohol (IAA) and ethyl acetate (EA) (Fig. 5A). In one group of flies, EA was paired with optogenetic activation of NPF neurons for 5 min, while IAA was delivered in the dark; flies were later asked to choose between the two odors in an arena where both odors are delivered simultaneously to specific quadrants (29). The reciprocal group received optogenetic activation of NPF neurons in the presence of IAA (Fig. 5A). NPF>CsChrimson flies showed a positive conditioned odor preference for the odor associated with 617-nm illumination not seen in genetic control flies (Fig. 5B). In a similar conditioning assay, Gr66a>CsChrimson flies developed strong conditioned aversion to the odor paired with optogenetic activation (Fig. S6). This shows that the preference (Fig. 1) or avoidance (Fig. S2) response seen in our preference assay can be a reflection of the rewarding or aversive effect of activating specific neurons. We conclude that the optogenetic activation of NPF neurons in conditions comparable to those used in the preference assay is rewarding to flies.
Fig. 5.
Optogenetic activation of NPF neurons is rewarding. (A) Flies were trained to associate an odor with the optogenetic activation of NPF neurons in a single training session consisting of 5 min of exposure to odor 1 [ethyl acetate (EA)] coupled with optogenetic activation of NPF neurons [activation at constant light; 617-nm LED light intensity, 20 µW/mm2, as described before (29)], followed by 5 min of exposure to air, followed by 5 min of exposure to odor 2 [isoamyl alcohol (IAA)]. To exclude any inherent bias for the olfactory cues, another group was trained in reciprocal manner (group 2). Conditioned odor preference was tested 5 min after the end of the training. Conditioned preference index (CPI) is the average between the CPIs of group 1 and group 2. (B) NPF>CsChrimson flies showed a significant conditioned odor preference (n = 6–8; unpaired t test; ***P < 0.001).
Fig. S6.
Optogenetic activation of Gr66a neurons is aversive. (A) Flies were trained to associate an odor with the optogenetic activation of Gr66a neurons using a single training session consisting of 10-min exposure to air, followed by a 10-min exposure to odor 1 [ethyl acetate (EA)], followed by a 10-min exposure to air, and finally a 10-min exposure to odor 2 [isoamyl alcohol (IAA)] paired with Gr66a neuron activation. To exclude any inherent bias for the olfactory cues, a second group of flies was trained to associate the activation of Gr66a neurons with the reciprocal odor (group 2). Conditioned odor preference was tested 10 min after the end of the training. Each conditioned preference index (CPI) is calculated as the average between the CPIs of group 1 and group 2. (B) Gr66a>CsChrimson flies showed a significant conditioned odor aversion (n = 12; unpaired t test; **P < 0.01) when the memory was tested 10 min after training (frequency of activation, 40 Hz; 617-nm LED light intensity, 5 µW/mm2).
NPF Neuron Activation-Induced Preference Is Dependent on NPF.
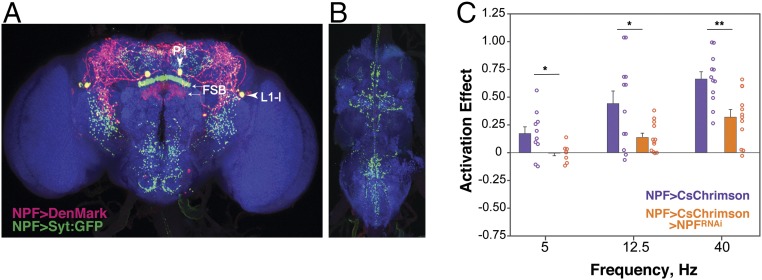
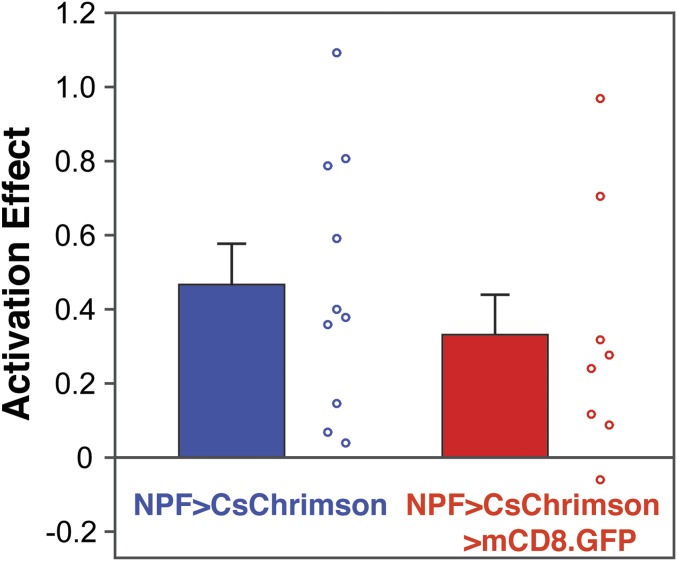
NPF-GAL4 is expressed in ≈30 neurons (see below) that extend dendrites and axon terminals throughout the central brain and ventral nerve cord (VNC) (Fig. 6 A and B). Many neuropeptide-expressing neurons coexpress other neuropeptides and/or fast-acting neurotransmitters (30) that would be released upon activation of CsChrimson. We therefore tested directly if signaling mediated by NPF is required for the preference we observed with NPF>CsChrimson flies. To do this, we performed two-choice assays with flies that coexpress NPF>CsChrimson with a transgene, UAS-NPFRNAi, that targets NPF mRNA for degradation through RNA interference (RNAi). A reduced preference for NPF neuron activation at the three light frequencies tested was observed in these flies (Fig. 6C). The effect is not due limiting expression levels of GAL4 as introduction of a 20XUAS-mCD8-GFP construct had no effect on the preference for NPF neuron activation (Fig. S7). Overall, we conclude that the preference for NPF neuron activation is dependent on NPF, although the residual preference suggests either incomplete down-regulation of NPF or contribution of additional transmitters. Curiously, we observed neither preference nor avoidance when activating the neurons expressing the NPF receptor (NPFR), suggesting complex signaling pathways downstream of NPF.
Fig. 6.
NPF is required for the NPF activation-induced preference. Distribution of NPF neurons in the central brain (A) and ventral nerve cord (B) of the fly, as visualized by the expression of the cell polarity markers DenMark (dendrites) and Syt::GFP (synaptic terminals) (42, 43) driven by the NPF-GAL4 driver. Positions of the large P1 and L1-l neurons, and the FSB are indicated. (C) Flies, in which the expression of NPF was targeted using an RNAi construct, showed a reduced preference for the activation of NPF neurons (n = 8–12; unpaired t test, *P < 0.05; **P < 0.01) (617-nm LED light intensity, 5 µW/mm2). (Magnification: 20×.)
Fig. S7.
Presence of extra UAS binding sites does not change the preference for NPF neuron activation. Positive control NPF>CsChrimson flies (left bar) carry NPF-GAL4 and UAS-CsChrimson; experimental flies carry, in addition, 20XUAS-mCD8-GFP (n = 10–12; unpaired t test, P > 0.05) (frequency of activation, 40 Hz; 617-nm LED light intensity, 5 µW/mm2).
A Small Subset of NPF-Expressing Neurons Mediate Preference.
Expression pattern of NPF-GAL4 and NPF.
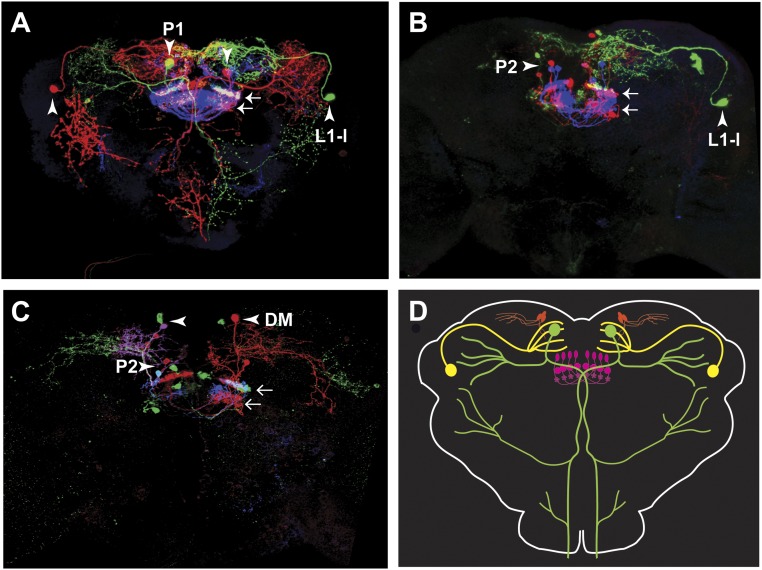
We next aimed to determine whether subsets of NPF-GAL4–expressing neurons mediate the observed preference of NPF>CsChrimson flies. Before doing so, we analyzed in detail the expression pattern of NPF-GAL4 driving expression of 20XUAS-mCD8-GFP (NPF>GFP). The NPF-GAL4 transgene used here has been described previously to mimic faithfully the endogenous NPF expression pattern (10, 19). The pattern includes two sets of large neurons named L1-l and P1 (ref. 20 and Fig. 7 A and B), and a group of ≈20 small posterior neurons, P2, that project to the fan-shaped body (FSB) of the central complex (Fig. 7 B and C). NPF-GAL4 and NPF are, in addition, expressed in two sets of four to five neurons located in the medial dorsal brain (DM, Fig. 7B) that to our knowledge have not been described. Expression of NPF>GFP in the male-specific neurons L1-s, D1, and D2 (20) was weak and variable and is not seen in the image shown in Fig. 7. We investigated the details of the global NPF-GAL4 expression pattern further using stochastic labeling with the Multi Color Flip-Out technique (ref. 31 and Fig. S8). A cartoon summary of many such stochastically labeled brains is shown in Fig. S8D. In brief, L1-l neurons project to the dorsal medial brain, P1 neurons show broad arborizations in the lateral brain, the subesophageal zone (SEZ) and the VNC, P2 neurons are local FSB interneurons, and DM neurons project laterally and ventrally from the dorsomedial and posterior location of the cell bodies (Fig. S8).
Fig. S8.
Neuroanatomy of neurons expressing NPF-GAL4. Representative multicolor flip-out (MCFO) results, showing the different types of NPF-GAL4 neurons: large dorsal medial (P1) neuron (A); large dorsal lateral (L1-l) neuron (A and B); small fan-shaped body (P2) interneurons (B and C); small dorsal medial (DM) neuron. (D) Schematic representation of the different subtypes of neurons expressing NPF-GAL4. In all images, small arrows indicate the projections from P2 neurons to the fan-shaped body, while big arrowheads indicate the neuron of interest in each panel. The male-specific neurons L1-s, D1, and D2 (20) were rarely labeled and have therefore been omitted. (Magnification: 20×.)
Restricting expression to large P1 and L1-l neurons.
To label the large neurons, we exploited the observation that the large NPF neurons coexpress the NPF receptor (NPFR), and used a FRT-FLP–mediated recombination intersection (32), where NPFR-Gal4 drives expression of UAS-STOP-CsChrimson-mVenus, while NPF-LexA drives expression of LexAop-FlpL. The STOP cassette prevents the functional expression of CsChrimson-mVenus; however, it can be removed by a flipase-mediated recombination. Thus, functional expression of CsChrimson-mVenus is achieved by coexpressing UAS-STOP-CsChrimson-mVenus and LexAop-FlpL. In our case, this happens only in those cells where the NPFR-Gal4 and NPF-LexA expression patterns overlap (Fig. 8A). Flies with CsChrimson expression in the large L1-l and P1 neurons, showed no preference for 617-nm light (Fig. 8C), indicating that these neurons are not sufficient for the preference seen upon activation of the NPF-GAL4 neurons.
Restricting expression to small P2 neurons.
The role of the small P2 FSB interneurons was investigated using a “split-GAL4” line, ss0020, specific for these neurons (Fig. 8B). Expressing CsChrimson in these neurons also failed to produce preference for photoactivation (Fig. 8C), suggesting that the P2 neurons are not sufficient for preference. It should be noted, however, that ss0020 expresses in only 80–90% of the P2 neurons.
Restricting expression to small DM neurons.
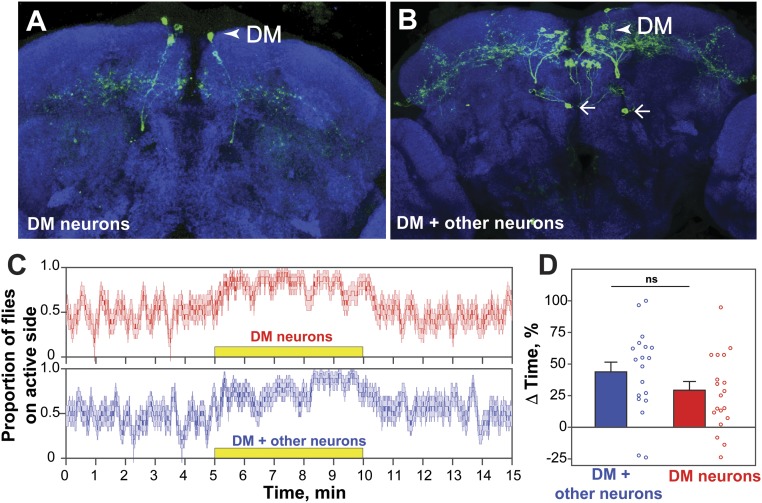
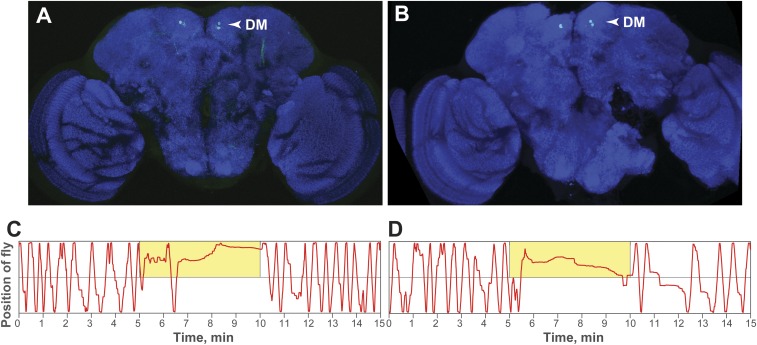
Finally, to test the contribution of the small DM neurons, we used a recently developed intersectional strategy (33) that labels all of the neurons that belong to the same cell lineage of a particular GAL4 expression pattern. The P1, L1-l, and DM NPF neurons belong to type I cell lineage; thus, we performed an intersection between type I lineage and NPF-GAL4 to express CsChrimson in subsets of NPF neurons. The stochastic nature of this intersection results in individual flies having different combinations of P1, L1-l, or DM neurons (and occasionally P2 small neurons) with CsChrimson expression (Fig. 9 A and B). Single flies were tested in the two-choice assay, and those flies that showed a clear preference for the 617-nm light were selected for subsequent CsChrimson expression analysis. Of note, all of these flies (30 individuals) had CsChrimson expression in DM neurons. Furthermore, flies with CsChrimson expression in DM neurons only had the same level of preference as flies that had expression in a combination of DM and other neurons (Fig. 9 C and D). Examples of the behavior and expression of individual flies are shown in Fig. S9. These data indicate that the small DM NPF neurons are sufficient to trigger the preference for optogenetic stimulation.
Fig. 9.
DM NPF neurons are sufficient to induce preference in the two-choice arena. (A and B) Representative brains of single flies expressing CsChrimson in DM neurons only (A), or in DM plus other neurons (B) (example shows expression in two neurons projecting to the FSB, arrows). (C) Experimental data expressed as the mean ± SE of the proportion of flies on the active side over time. The yellow box indicates the period of activation (DM neurons only, n = 19; DM plus other neurons, n = 19). (D) ΔTime (%) (preference) of flies during the activation phase, indicating no significant difference between the preference of flies with CsChrimson expression in DM neurons only or in DM plus other neurons. Female flies were used in this experiment as stochastic labeling was sparser than in males (unpaired t test; P > 0.05) (frequency of activation, 40 Hz; 617-nm LED light intensity, 5 µW/mm2). (Magnification: 40×.)
Fig. S9.
Representative examples of flies that showed expression of CsChrimson in a subset of DM NPF neurons (A and B), which also showed a clear preference response during the assay (C and D). Green: CsChrimson::mVenus. (Magnification: 20×.)
Discussion
Here, we present the characterization of a two-choice assay that employs optogenetic activation to identify neurons involved in reward processing in Drosophila. We designed this assay under the assumption that, if given the choice to avoid or occupy a side of the chambers where a specific group of neurons is activated, flies would prefer the area of activation if such an activation was perceived as rewarding, or avoid the area of activation if perceived as aversive. This assay was designed with the intent of ultimately performing a large neuronal activation screen to probe for unidentified neurons involved in reward, which would be very laborious by means of classical conditioning assays. In fact, our system consists of four groups of chambers shown in Fig. 1A, allowing the testing of up to 20 groups of flies in a single round of the two-choice experiment. It should also be noted that, since our assay does not involve a conditioning step, it is able to reveal what the flies are experiencing in real time (attraction or aversion) upon activation of a particular group of neurons.
Preference for the Activation of NPF Neurons.
Neuropeptide Y (NPY), the mammalian homolog of NPF, is a widely expressed neuropeptide (34) and is involved in regulating behaviors such as feeding (35) and alcohol consumption (36). In addition, NPY neurons in the central nucleus of the amygdala and the arcuate nucleus of the hypothalamus send projections to the nucleus accumbens (37), and intraaccumbens injections of NPY are able to produce a place preference response in rats (38). Similarly, the fly NPF neurons regulate several reward related behaviors, such as retrieval of appetitive memories (22), and alcohol preference and reward (10). In addition, thermogenetic activation of these neurons is per se rewarding (10). Given the functional similarities between the NPY system in mammals and the NPF system in flies, and considering that NPY neurons project to the nucleus accumbens, which in mammals has a central role in reward processing, we speculated that the characterization of the NPF system in Drosophila will provide valuable inroads to the study of the flies’ reward system. With this in mind, we sought to characterize our assay using optogenetic activation of this group of neurons, under the expectation that flies would show a preference for the activation of NPF neurons. Indeed, in our assay, flies expressing CsChrimson in NPF neurons, display a preference for the side of the chambers in which the 617-nm LEDs are turned on (Fig. 1 B and C). Interestingly, the preference for NPF neuron activation showed by flies resembles an “all-or-nothing” response, in that, above a certain stimulation frequency (threshold), flies show the same degree of preference (Fig. S1B). In the intracranial self-stimulation experiments from Olds and Milner, increasing levels of current applied into the stimulating electrode would progressively recruit more “reward” neurons from a given brain region, thus increasing preference at higher currents of stimulation (39). In our two-choice experiments, however, the all-or-nothing preference that we observed can be explained by considering that, during the period of activation, the entire fly brain is exposed to the 617-nm light; thus, every neuron expressing CsChrimson would be activated at the same time, provided that the appropriate frequency and 617-nm light intensity are used.
Activation of NPF Neurons in the Preferences Assay as a Rewarding Stimulus.
Activation of NPF neurons not only triggers a preference response but is also accompanied with a decrease in the fly’s locomotion (speed). This raises the following question: Is the activation of NPF neurons truly rewarding? Or, by activating the NPF neurons, is one merely reducing the speed of the flies, therefore trapping them on the active side of the chambers? Our dilemma experiment (Fig. 4) showed that flies are able to leave the side of activation, despite having experienced the activation of NPF neurons, arguing against a sole effect on locomotion. Furthermore, we reasoned that, if activation of NPF neurons in our preference assay is in fact rewarding, flies should be able to retain the memory of that reward in an olfactory conditioning assay. Indeed, this is the case for NPF neurons (Fig. 5). Moreover, while preference is negatively correlated with a reduction in locomotion, it is not necessary.
Functional Subdivision of Subsets of NPF Neurons.
The NPF-GAL4 driver used here labels two very distinctive subpopulations of NPF neurons (Fig. 7): four prominent neurons (L1-l and P1) that project to the dorsolateral and dorsoventral brain, along with several smaller NPF neurons located in the posterior brain (P2 + DM). By making use of different intersectional methods, we were able to activate specific subsets of NPF neurons in our two-choice assay. Activating neither the large NPF neurons alone nor a subset of P2 neurons was sufficient to trigger a preference response. Although it was not possible to rule out an interaction between multiple types of NPF neurons, this lack of effect suggested that the DM small NPF neurons are responsible for the preference response upon activation. By using a class-lineage intersectional strategy (33), we showed that, indeed, activation of the DM NPF neurons is sufficient to trigger a preference response. Although NPF neurons have been implicated in a wide array of different behavior such as ethanol sensitivity (19), courtship (20), aggression (40), ethanol preference and ethanol reward (10), sleep (41), and sucrose sensitivity (21), no study has analyzed the potential specific effects a particular subset of NPF neurons might have on a particular behavior. Furthermore, while only the P2 small NPF neurons have been briefly described before (20), the work presented here describes the DM small NPF neurons, both from an anatomical and behavioral perspective.
Materials and Methods
Fly Lines and Culture.
Parental lines were raised at room temperature on standard media (cornmeal/yeast/molasses/agar). Experimental flies were raised under constant darkness at 25 °C and 70% humidity on standard media containing 0.2 mM all transretinal (Sigma) and collected 0–3 d after eclosion on media containing 0.4 mM all transretinal. Flies were 3–6 d old at the time of experiments. Experimental flies were obtained by crossing NPF-GAL4 or Gr66a-GAL4 males with 20XUAS-CsChrimson-mVenus (inserted into attP40 or attP18) females. Crossing the UAS-CsChrimson females to w1118 males from the appropriate genetic background generated control flies. To intersect NFP-GAL4 with type I lineage, we crossed dpn>KDRT-stop-KDRT>Cre:PEST; NPF-GAL4; actin^LoxP-GAL80-stop-LoxP^LexA::P65, lexAop-rCD2::RFP-p10-spacer-UAS-mCD8::GFP-p10 female flies to 20XUAS-CsChrimson-mVenus; ase-KD1W male flies. The NPF-LexA, NPFR-GAL4 stocks were provided by Stefanie Hampel, Michael Texada, and Jim Truman (Janelia Research Campus). Line ss0020-GAL4 was provided by Arnim Jenett, Tanya Wolff, and Gerry Rubin (Janelia Research Campus).
Behavioral Chambers.
To allow for high-throughput assays, we built a system containing 20 independent rectangular chambers running in parallel, each of dimensions 10 × 1 × 0.3 cm. The top of each chamber is a sliding, transparent acrylic sheet with a small hole through which flies are introduced using a mouth pipet. The floor of each chamber is a 3-mm-thick white acrylic diffuser. Positioned 1 cm below the diffuser is a printed circuit board (PCB) that contains infrared (IR) LED lights for back-illumination as well as 617-nm LEDs (Luxeon Star LEDs) for CsChrimson activation. The midline of each chamber is marked with 1-mm-wide metallic strip located below the diffuser. To prevent overheating upon repeated use, the PCB board is located on top of an aluminum block connected to a water-cooling system (Fisher Scientific). Experiments are recorded with cameras (Basler AG) located above the chambers and equipped with an IR long-pass filter.
Two-Choice Experiment.
Flies were 3–6 d old when tested in the two-choice assay, which was performed at 25 °C, 50% humidity, and in the dark. Male flies were introduced into each chamber either as groups of 10–12 or as single individuals. Flies spent the first 5 min of the assay under IR light alone to measure their basal locomotor activity, followed by 5 min of optogenetic activation (617-nm LEDs on) on one randomly chosen side of the chambers, and then a 5-min recovery period (617-nm LEDs off). Throughout all experiments, flies were observed under IR light, to which flies are blind. The activation period consisted of repeated 8-ms pulses of the 617-nm LEDs followed by a variable amount of time, depending on the desired frequency (Fig. S1). The frequency as well as the light intensity used for each experiment were controlled with MATLAB via a National Instruments Data Acquisition Device (NIDaq).
Quantification of Behavior.
Fly behavior in the chambers of our system was recorded with video cameras, and the subsequent video analyzed with custom MATLAB scripts that detect the position of flies within the chamber and thereby allowed us to determine the number of flies on each side of the chamber. To quantify the distribution of the flies over the course of the experiment, for every frame of the resulting video (time point i), we calculated a preference index (PI) defined as follows:
To describe the relative preference for the activation of a certain group of neurons for a group of flies, based on the PI values obtained, we calculated an activation effect (AE) defined as follows:
For single-fly experiments, the relative distribution of flies at a specific time point (i), was expressed as the proportion of flies on the active side, which was calculated as follows:
The AE (or ΔTime %) for single-fly experiments was calculated as follows:
Conditioned Odor Preference.
Olfactory conditioning was performed in a circular arena that employs 617-nm LEDs for CsChrimson activation, coupled to an odor delivery system that sends odors to each quadrant of the arena (29). The olfactory cues used were IAA and EA. NPF neurons were stimulated using constant 617-nm LED light at an intensity of 20 µW/mm2. Flies were trained as groups of 30 individuals using a single training session consisting of 5-min exposure to air, followed by a 5-min exposure to odor A paired with NPF neuron activation, followed by a 5-min exposure to air, and finally a 5-min exposure to odor B. Memory was tested 5 min after training, during which the odors A and B were delivered to each pair of opposing quadrants. Experiments were recorded with a camera (Point Gray Research) located above the chamber and equipped with an IR long-pass filter. The subsequent video was analyzed with custom MATLAB scripts that detect the position of flies within the chamber, thereby allowing us to determine the number of flies on each quadrant of the chamber.
Natural vs. Artificial Reward Dilemma.
We used virgin females (4 d old; grouped housed) expressing CsChrimson in bitter-sensing gustatory neurons expressing Gr66a and virgin males (7 d old; single housed) expressing CsChrimson in NPF neurons or in bitter-sensing gustatory neurons expressing Gr66a. We modified the chambers by introducing a sliding acrylic divider that separated the two sides of each chamber. A single fly from a particular genotype was introduced, using a mouth pipet, into each side. During the first phase of the experiment, flies were kept isolated into its respective side for a period of 2 min, after which the middle gate was open. Flies were then given a period of 3 min (pre-Dilemma phase) to explore the entire chamber and interact with each other. During the next 5 min (Dilemma phase), the 617-nm LEDs were turned on using a frequency of 10 Hz and a light intensity of 5 µW/mm2. These conditions were determined empirically to produce relatively weak preference that could be affected by the presence of a virgin female. Afterward, the 617-nm LEDs are turned back to off, and flies are given an extra 5 min of recovery. The preference (ΔTime %) of each fly for the active side during the Dilemma phase was manually scored and calculated as the difference between the percentage of time spent on the side of activation during the last 2 min of the Dilemma and the percentage of time spent on the side of activation during the last 2 min of the pre-Dilemma phase. For each pair, the mean distance between flies was calculated as the average distance between them during the last 2 min of the Dilemma phase.
Targeting of NPF Expression.
To activate NPF neurons while down-regulating the expression of NPF using RNAi, we crossed the strain w; NPF-Gal4; 20XUAS-CsChrimson to a UAS-RNAiNPF strain, or to a w1118 strain to generate the respective positive control group. To control for the effect of extra UAS sequences on the efficacy of the GAL4 protein in driving CsChrimson, we crossed our strain w; NPF-GAL4; 20XUAS-CsChrimson with 20XUAS-mCD8-GFP flies (Fig. S7).
Immunostaining and Imaging.
Fly brains were dissected in cold 1× PBS and fixed in 2% paraformaldehyde made in 1× PBS at 4 °C overnight on a nutator, washed four times for 20 min each in PAT (1× PBS, 0.5% PBS Triton, 1% BSA) at room temperature, blocked for 1 h at room temperature with blocking buffer (PAT plus 3% normal goat serum), and incubated with primary antibodies, diluted in blocking buffer, overnight on a nutator at 4 °C. The primary antibodies used were as follows: mouse-GFP (Sigma-Aldrich; G6539; 1:500 dilution), rabbit-DsRed (Clontech; 632496; 1:500 dilution), rabbit-NPF (RayBiotech; RB-19-0001; 1:200 dilution), rat anti-mCD8 (Life Technologies; MCD0800; 1:100 dilution), mouse anti-Bruchpilot, nc82 monoclonal antibody (DSHB; 1:50 dilution), and rat-DN-cadherin (Hybridoma Bank DSHB; DNEX#8) (1:50). This was followed by four washes for 20 min each in PAT, and incubation overnight on a nutator at 4 °C with secondary antibodies diluted in blocking buffer. The secondary antibodies used were as follows: Alexa Fluor 488 anti-rabbit (Molecular Probes; A11034; 1:500 dilution), Alexa Fluor 568 anti-mouse (Molecular Probes; A11031; 1:500 dilution), Alexa Fluor 488 anti-rat (Molecular Probes; A11006; dilution, 1:200), Alexa Fluor 633 anti-mouse (Molecular Probes; A21052; 1:500 dilution), and Alexa Fluor 633 anti-rat (Molecular Probes; A21094; 1:500 dilution). Brains were then washed four times for 20 min each in PAT at room temperature, one time for 20 min in 1× PBS, and mounted with Vectashield mounting medium (H-1000; Vector Laboratories). Brains were imaged on a Zeiss 880 confocal laser-scanning microscope.
Statistical Analysis.
To determine the statistical significance of our data, we used MATLAB (R2015a) or GraphPad Prism (version 6) software package, to perform unpaired t test or one-way ANOVA followed by Tukey’s multiple-comparison post hoc test. The significance of the correlations shown in Fig. 3 was tested using the built-in corrcoef function from MATLAB (R2015a). Data are expressed as the mean ± SE, along with a scatterplot of the data points. In all figures, ***P < 0.001, **P < 0.01, and *P < 0.05.
Acknowledgments
We thank Reza Azanchi (Brown University), Karla Kaun (Brown University), Galit Shohat-Ophir (Bar-Ilan University), and Carmen Robinett (Janelia Research Campus) along with current members of the U.H. Laboratory for advice on experimental design and the manuscript. We thank Vivek Jayaraman, Arnim Jenett, Tanya Wolff, Gerry Rubin, Michael Texada, and Jim Truman (Janelia Research Campus) for sharing reagents prior to publication. For design, construction, and implementation of the two-choice assay system, we thank Tanya Tabachnik, Steven Sawtelle, Lakshmi Ramasamy, Igor Negrashov, and Spencer Taylor (Instrument, Design, and Fabrication, Janelia Research Campus), and Ben Arthur (Scientific Computing, Janelia Research Campus). We thank members of the Janelia Fly Core for invaluable technical support.
Footnotes
The authors declare no conflict of interest.
This article contains supporting information online at www.pnas.org/lookup/suppl/doi:10.1073/pnas.1710552114/-/DCSupplemental.
References
- 1.Olds J, Milner P. Positive reinforcement produced by electrical stimulation of septal area and other regions of rat brain. J Comp Physiol Psychol. 1954;47:419–427. doi: 10.1037/h0058775. [DOI] [PubMed] [Google Scholar]
- 2.Olds J. Pleasures centers in the brain. Sci Am. 1956;195:105–116. [Google Scholar]
- 3.Kelley AE, Berridge KC. The neuroscience of natural rewards: Relevance to addictive drugs. J Neurosci. 2002;22:3306–3311. doi: 10.1523/JNEUROSCI.22-09-03306.2002. [DOI] [PMC free article] [PubMed] [Google Scholar]
- 4.Perry CJ, Barron AB. Neural mechanisms of reward in insects. Annu Rev Entomol. 2013;58:543–562. doi: 10.1146/annurev-ento-120811-153631. [DOI] [PubMed] [Google Scholar]
- 5.Scaplen KM, Kaun KR. Reward from bugs to bipeds: A comparative approach to understanding how reward circuits function. J Neurogenet. 2016;30:133–148. doi: 10.1080/01677063.2016.1180385. [DOI] [PMC free article] [PubMed] [Google Scholar]
- 6.Tempel BL, Bonini N, Dawson DR, Quinn WG. Reward learning in normal and mutant Drosophila. Proc Natl Acad Sci USA. 1983;80:1482–1486. doi: 10.1073/pnas.80.5.1482. [DOI] [PMC free article] [PubMed] [Google Scholar]
- 7.Tully T, Quinn WG. Classical conditioning and retention in normal and mutant Drosophila melanogaster. J Comp Physiol A Neuroethol Sens Neural Behav Physiol. 1985;157:263–277. doi: 10.1007/BF01350033. [DOI] [PubMed] [Google Scholar]
- 8.Lin S, et al. Neural correlates of water reward in thirsty Drosophila. Nat Neurosci. 2014;17:1536–1542. doi: 10.1038/nn.3827. [DOI] [PMC free article] [PubMed] [Google Scholar]
- 9.Kaun KR, Azanchi R, Maung Z, Hirsh J, Heberlein U. A Drosophila model for alcohol reward. Nat Neurosci. 2011;14:612–619. doi: 10.1038/nn.2805. [DOI] [PMC free article] [PubMed] [Google Scholar]
- 10.Shohat-Ophir G, Kaun KR, Azanchi R, Mohammed H, Heberlein U. Sexual deprivation increases ethanol intake in Drosophila. Science. 2012;335:1351–1355, and erratum (2012) 337:799. doi: 10.1126/science.1215932. [DOI] [PMC free article] [PubMed] [Google Scholar]
- 11.Agmo A, Berenfeld R. Reinforcing properties of ejaculation in the male rat: Role of opioids and dopamine. Behav Neurosci. 1990;104:177–182. doi: 10.1037//0735-7044.104.1.177. [DOI] [PubMed] [Google Scholar]
- 12.Agmo A, Federman I, Navarro V, Padua M, Velazquez G. Reward and reinforcement produced by drinking water: Role of opioids and dopamine receptor subtypes. Pharmacol Biochem Behav. 1993;46:183–194. doi: 10.1016/0091-3057(93)90339-u. [DOI] [PubMed] [Google Scholar]
- 13.Agmo A, Galvan A, Talamantes B. Reward and reinforcement produced by drinking sucrose: Two processes that may depend on different neurotransmitters. Pharmacol Biochem Behav. 1995;52:403–414. doi: 10.1016/0091-3057(95)00128-j. [DOI] [PubMed] [Google Scholar]
- 14.Ciccocioppo R, Panocka I, Froldi R, Quitadamo E, Massi M. Ethanol induces conditioned place preference in genetically selected alcohol-preferring rats. Psychopharmacology (Berl) 1999;141:235–241. doi: 10.1007/s002130050830. [DOI] [PubMed] [Google Scholar]
- 15.Liu C, et al. A subset of dopamine neurons signals reward for odour memory in Drosophila. Nature. 2012;488:512–516. doi: 10.1038/nature11304. [DOI] [PubMed] [Google Scholar]
- 16.Burke CJ, et al. Layered reward signalling through octopamine and dopamine in Drosophila. Nature. 2012;492:433–437. doi: 10.1038/nature11614. [DOI] [PMC free article] [PubMed] [Google Scholar]
- 17.Huetteroth W, et al. Sweet taste and nutrient value subdivide rewarding dopaminergic neurons in Drosophila. Curr Biol. 2015;25:751–758. doi: 10.1016/j.cub.2015.01.036. [DOI] [PMC free article] [PubMed] [Google Scholar]
- 18.Yamagata N, et al. Distinct dopamine neurons mediate reward signals for short- and long-term memories. Proc Natl Acad Sci USA. 2015;112:578–583. doi: 10.1073/pnas.1421930112. [DOI] [PMC free article] [PubMed] [Google Scholar]
- 19.Wen T, Parrish CA, Xu D, Wu Q, Shen P. Drosophila neuropeptide F and its receptor, NPFR1, define a signaling pathway that acutely modulates alcohol sensitivity. Proc Natl Acad Sci USA. 2005;102:2141–2146. doi: 10.1073/pnas.0406814102. [DOI] [PMC free article] [PubMed] [Google Scholar]
- 20.Lee G, Bahn JH, Park JH. Sex- and clock-controlled expression of the neuropeptide F gene in Drosophila. Proc Natl Acad Sci USA. 2006;103:12580–12585. doi: 10.1073/pnas.0601171103. [DOI] [PMC free article] [PubMed] [Google Scholar]
- 21.Inagaki HK, Panse KM, Anderson DJ. Independent, reciprocal neuromodulatory control of sweet and bitter taste sensitivity during starvation in Drosophila. Neuron. 2014;84:806–820. doi: 10.1016/j.neuron.2014.09.032. [DOI] [PMC free article] [PubMed] [Google Scholar]
- 22.Krashes MJ, et al. A neural circuit mechanism integrating motivational state with memory expression in Drosophila. Cell. 2009;139:416–427. doi: 10.1016/j.cell.2009.08.035. [DOI] [PMC free article] [PubMed] [Google Scholar]
- 23.Klapoetke NC, et al. Independent optical excitation of distinct neural populations. Nat Methods. 2014;11:338–346. doi: 10.1038/nmeth.2836. [DOI] [PMC free article] [PubMed] [Google Scholar]
- 24.Brand AH, Perrimon N. Targeted gene expression as a means of altering cell fates and generating dominant phenotypes. Development. 1993;118:401–415. doi: 10.1242/dev.118.2.401. [DOI] [PubMed] [Google Scholar]
- 25.Moon SJ, Köttgen M, Jiao Y, Xu H, Montell C. A taste receptor required for the caffeine response in vivo. Curr Biol. 2006;16:1812–1817. doi: 10.1016/j.cub.2006.07.024. [DOI] [PubMed] [Google Scholar]
- 26.Keene AC, Masek P. Optogenetic induction of aversive taste memory. Neuroscience. 2012;222:173–180. doi: 10.1016/j.neuroscience.2012.07.028. [DOI] [PMC free article] [PubMed] [Google Scholar]
- 27.Ramdya P, et al. Mechanosensory interactions drive collective behaviour in Drosophila. Nature. 2015;519:233–236. doi: 10.1038/nature14024. [DOI] [PMC free article] [PubMed] [Google Scholar]
- 28.Lihoreau M, Clarke IM, Buhl J, Sumpter DJ, Simpson SJ. Collective selection of food patches in Drosophila. J Exp Biol. 2016;219:668–675. doi: 10.1242/jeb.127431. [DOI] [PubMed] [Google Scholar]
- 29.Aso Y, Rubin GM. Dopaminergic neurons write and update memories with cell-type-specific rules. Elife. 2016;5:e16135. doi: 10.7554/eLife.16135. [DOI] [PMC free article] [PubMed] [Google Scholar]
- 30.van den Pol AN. Neuropeptide transmission in brain circuits. Neuron. 2012;76:98–115. doi: 10.1016/j.neuron.2012.09.014. [DOI] [PMC free article] [PubMed] [Google Scholar]
- 31.Nern A, Pfeiffer BD, Rubin GM. Optimized tools for multicolor stochastic labeling reveal diverse stereotyped cell arrangements in the fly visual system. Proc Natl Acad Sci USA. 2015;112:E2967–E2976. doi: 10.1073/pnas.1506763112. [DOI] [PMC free article] [PubMed] [Google Scholar]
- 32.Bischof J, Basler K. Recombinases and their use in gene activation, gene inactivation, and transgenesis. Methods Mol Biol. 2008;420:175–195. doi: 10.1007/978-1-59745-583-1_10. [DOI] [PubMed] [Google Scholar]
- 33.Ren Q, Awasaki T, Huang YF, Liu Z, Lee T. Cell class-lineage analysis reveals sexually dimorphic lineage compositions in the Drosophila brain. Curr Biol. 2016;26:2583–2593. doi: 10.1016/j.cub.2016.07.086. [DOI] [PubMed] [Google Scholar]
- 34.Reichmann F, Holzer P. Neuropeptide Y: A stressful review. Neuropeptides. 2016;55:99–109. doi: 10.1016/j.npep.2015.09.008. [DOI] [PMC free article] [PubMed] [Google Scholar]
- 35.Aponte Y, Atasoy D, Sternson SM. AGRP neurons are sufficient to orchestrate feeding behavior rapidly and without training. Nat Neurosci. 2011;14:351–355. doi: 10.1038/nn.2739. [DOI] [PMC free article] [PubMed] [Google Scholar]
- 36.Pleil KE, et al. NPY signaling inhibits extended amygdala CRF neurons to suppress binge alcohol drinking. Nat Neurosci. 2015;18:545–552. doi: 10.1038/nn.3972. [DOI] [PMC free article] [PubMed] [Google Scholar]
- 37.Borkar CD, Upadhya MA, Shelkar GP, Subhedar NK, Kokare DM. Neuropeptide Y system in accumbens shell mediates ethanol self-administration in posterior ventral tegmental area. Addict Biol. 2016;21:766–775. doi: 10.1111/adb.12254. [DOI] [PubMed] [Google Scholar]
- 38.Josselyn SA, Beninger RJ. Neuropeptide Y: Intraaccumbens injections produce a place preference that is blocked by cis-flupenthixol. Pharmacol Biochem Behav. 1993;46:543–552. doi: 10.1016/0091-3057(93)90542-2. [DOI] [PubMed] [Google Scholar]
- 39.Olds J. Self-stimulation of the brain; its use to study local effects of hunger, sex, and drugs. Science. 1958;127:315–324. doi: 10.1126/science.127.3294.315. [DOI] [PubMed] [Google Scholar]
- 40.Dierick HA, Greenspan RJ. Serotonin and neuropeptide F have opposite modulatory effects on fly aggression. Nat Genet. 2007;39:678–682. doi: 10.1038/ng2029. [DOI] [PubMed] [Google Scholar]
- 41.He C, Yang Y, Zhang M, Price JL, Zhao Z. Regulation of sleep by neuropeptide Y-like system in Drosophila melanogaster. PLoS One. 2013;8:e74237. doi: 10.1371/journal.pone.0074237. [DOI] [PMC free article] [PubMed] [Google Scholar]
- 42.Nicolaï LJJ, et al. Genetically encoded dendritic marker sheds light on neuronal connectivity in Drosophila. Proc Natl Acad Sci USA. 2010;107:20553–20558. doi: 10.1073/pnas.1010198107. [DOI] [PMC free article] [PubMed] [Google Scholar]
- 43.Zhang YQ, Rodesch CK, Broadie K. Living synaptic vesicle marker: Synaptotagmin-GFP. Genesis. 2002;34:142–145. doi: 10.1002/gene.10144. [DOI] [PubMed] [Google Scholar]


