Abstract
Two-hundred and twenty seven satellite-tracked drifters were deployed in the Gulf of Maine (GoM) from 1988 to 2007, primarily during spring and summer. The archive of tracks includes over 100,000 kilometers logged thus far. Statistics such as transit times, mean velocities, response to wind events, and preferred pathways are compiled for various areas of the coastal GoM. We compare Lagrangian flow with Eulerian estimates from near-by moorings and evaluate drifter trajectories using Ekman theory and 3-D ocean circulation models.
Results indicate that the Gulf of Maine Coastal Current is a strong and persistent feature centered on the 94 ± 23 meter isobath, but that particles: a) deviate from the seasonal-mean core fairly regularly, and are often re-entrained; b) follow a slower (9 cm/s), less-constrained path in the western portion off the coast of Maine relative to the eastern (16 cm/s) section; and c) can be affected by wind events and small scale baroclinic structures. Residence times calculated for each ½ degree grid cell throughout the GoM depict some regions (Eastern Maine and Western Nova Scotia) as being relatively steady, flow-through systems, while others (Penobscot, Great South Channel) have more variable, branching pathways. Travel times for drifters that are retained within the coastal current along the entire western side of the Gulf of Maine are typically less than two months (55 days).
Keywords: Lagrangian drifting buoys, coastal current measurement, transport processes, drogues, Gulf of Maine, Georges Bank
1. Introduction
A variety of scientific questions concerning the role of the coastal currents in transporting materials such as plankton and pollutants around the Gulf of Maine have been investigated during the last two decades. How these constituents are dispersed and delivered along the entire coast of New England has important commercial and ecological consequences. What regulates the apparent temporal and geographic variability?
Much of the focus has been on the mid-coast region in the vicinity south of Penobscot Bay. Two projects, the Ecology and Oceanography of Harmful Algal Blooms – Gulf of Maine (ECOHAB-GOM; Anderson et al., 2005a) and the Monitoring and Event Response for Harmful Algal Blooms (MERHAB; He et al., 2005), have examined processes associated with delivering particles toward Casco Bay and the intervening estuaries. The effects of river plumes, upwelling/downwelling, and upstream source waters have been considered. The bifurcation of flow off several key locations, such as near the mouth of Penobscot Bay, is a topic of common interest (Pettigrew et al., 2005). How often does the transport of the Eastern Maine Coastal Current (EMCC), for example, flow through and impact near-shore in the southwestern section of the coast? How often does the EMCC take a “short circuit” to Georges Bank instead, as first documented in the mid-1990’s (Pettigrew et al., 2005) and on other occasions more recently?
Other parts of the GoM have been examined as well. The Environmental Monitors on Lobster Traps (eMOLT) project documented the potential pathways of lobster larvae along the entire Western GoM during the summer of 2004 (Manning, 2006). Both the Woods Hole Center for Oceans and Human Health (WHCOHH, Anderson et al., 2005b) and the Gulf of Maine Toxicity (GOMTOX) projects have followed up the HAB studies in recent years with drifter deployments in the Bay of Fundy, Mid-Coast Maine, and Mass Bay region. The SCOPEX project (Limeburner and Beardsley, 1996) tracked the distribution of zooplankton in the more-southern end of the region in the late 1980’s. Other studies in this southern region include: a) the Mass Bays Project (Geyer et al., 1992) evaluating the Boston sewage disposal site in the early 1990’s; and b) NOAA’s recent return to SCOPEX topics studying the distribution of right whale-prey in the Great South Channel. Other smaller projects (as listed in Table 1) have also contributed to the drifter archive (Figure 1).
Table 1.
Archived Drifter Data
| Project | Region | Primary Purpose | Years | Months deployed | Number of drifters | Drogue Depths (m) | Satellite system |
|---|---|---|---|---|---|---|---|
|
| |||||||
| SCOPEX | G.S. Channel | Calanus spp., Whales | 1988–9 | 3,6 | 34 | 5,50 | ARGOS |
| Mass Bays | Mass Bay | Nutrients | 1990–1 | 2–10 | 6 | 6 | ARGOS |
| RMRP | Eastern GoM | Circulation patterns | 1994–6 | 4,5,8 | 16 | 10,40 | ARGOS |
| ECOHAB | Mid-coast | Alexandrium | 1998–2001 | 5,6 | 37 | 1 | ARGOS |
| NATO | Mass Bay | Model validation | 2001 | 6 | 6 | 1 | ARGOS |
| MERHAB | Mid-coast | Alexandrium | 2003–4 | 5,6 | 19 | 1,13 | GPS |
| eMOLT | GoM | Lobster | 2003–4 | 5,6 | 16 | 1 | GPS |
| WHCOHH | GoM & BoF | Alexandrium | 2005 | 5,6 | 18 | 1,15 | GPS |
| NEC | Mid-Coast | Lobster | 2005 | 7,8 | 16 | 5 | GPS |
| USCG | NE Shelf | Search& Rescue | 2005–6 | 2,3,8,12 | 5 | 1 | ARGOS |
| NOAA | G.S. Channel | Calanus spp., Whales | 2005–7 | 4,5 | 17 | 1 | GPS |
| GOMTOX | GoM & BoF | Alexandrium | 2007 | 5–7 | 37 | 1,15 | GPS |
| TOTAL | 227 | ||||||
SCOPEX=South Channel Ocean Productivity Experiment
RMRP=Regional Marine Research Program
ECOHAB= Ecology and Oceanography of Harmful Algal Blooms
NATO=North Atlantic Trade Organization
MERHAB=Monitoring and Event Response for Harmful Algal Blooms
eMOLT= Environmental Monitors on Lobster Traps
WHCOHH= Woods Hole Center for Oceans and Human Health
NEC= Northeast Consortium
NOAA= National Oceanic and Atmospheric Administration
GOMTOX=Gulf of Maine Toxicity
Figure 1.
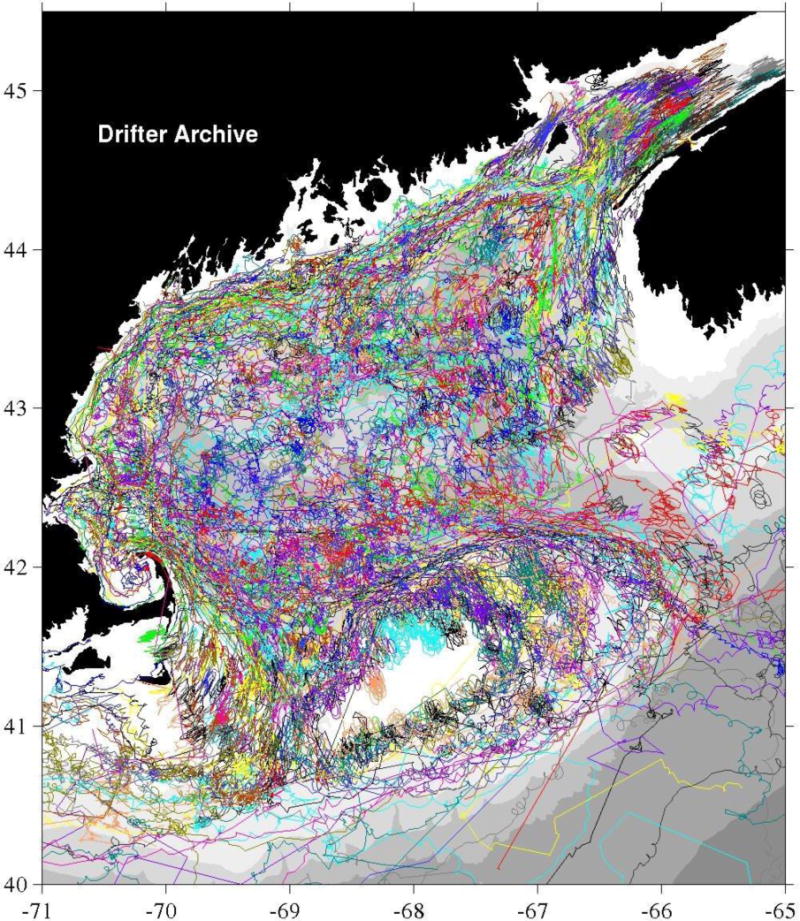
Tracks of drifters deployed in the Gulf of Maine, 1988-present.
An additional motivation and application of the various drifter deployments was to evaluate and calibrate numerical simulations. Several modeling studies have attempted to simulate the many time and space scales associated with these systems. Beginning with Brooks et al. (1994) investigating the spring time flow patterns in the EMCC, subsequent studies by Lynch et al. (1997), Xue et al., (2000), and Chen et al., (2006) examine the seasonal flow fields. More focused studies of river effects (Fong et al., 1997; Geyer et al., 2004; Hetland and Signell, 2005), assimilation of sea surface elevation (He et al., 2005; Bogden et al., 1996), advection of larvae (Incze and Naimie, 2000; Huret, 2007, Xue et al. 2008), and the Bay of Fundy Gyre (Aretxabaleta et al., 2008a and 2008b) provide detailed description of specific processes.
The primary objective here is to review the Lagrangian observations as a whole, to introduce the growing web-served GoM drifter archive (Figure 1), to estimate flow statistics including transit times, and to delineate persistent pathways. Since the flow around Georges Bank has been addressed elsewhere (Brink et al., 2003; Limeburner and Beardsley, 1996; Naimie et al., 2001, and Manning and Churchill, 2005), our focus here is instead on the Gulf of Maine Coastal Current (GMCC) with the goal of characterizing the Lagrangian flow field.
2. Drifters
While drifter electronic technology has developed substantially over the last few decades, the mechanical designs have remained essentially the same. Surface drifters and holey-socked drogues designed in the early 1980’s are still used today. Prior to 2002, most of the drifters summarized in this report used the ARGOS satellite communication system with fixes provided several times per day at 300m accuracy. Beginning in 2003, the majority of deployments in this study were made with recently-developed, low-cost, GPS devices (as denoted in the last column of Table 1). The new surface drifters (Figure 2, denoted as 1m “drogue depth” in Table 1), first deployed in 2004, are made with a 1.3 meter long 2-inch diameter PVC cylinder (conventional pipe material) that supports two pairs of fiberglass rods. The rods are mounted radially and orthogonally to hold a set of four vinyl cloth sails. The cylinder is ballasted so that only the GPS antenna and a small portion are exposed to the wind. While the design is essentially the same as the commercially-available Davis-style (“CODE”) surface drifters (Davis, 1984) used in our studies prior to 2004, the electronics were replaced with new technology used for tracking vehicles on highways. The units were set to report every 0.5–2 hours and communicate via the GLOBALSTAR satellite system.
Figure 2.
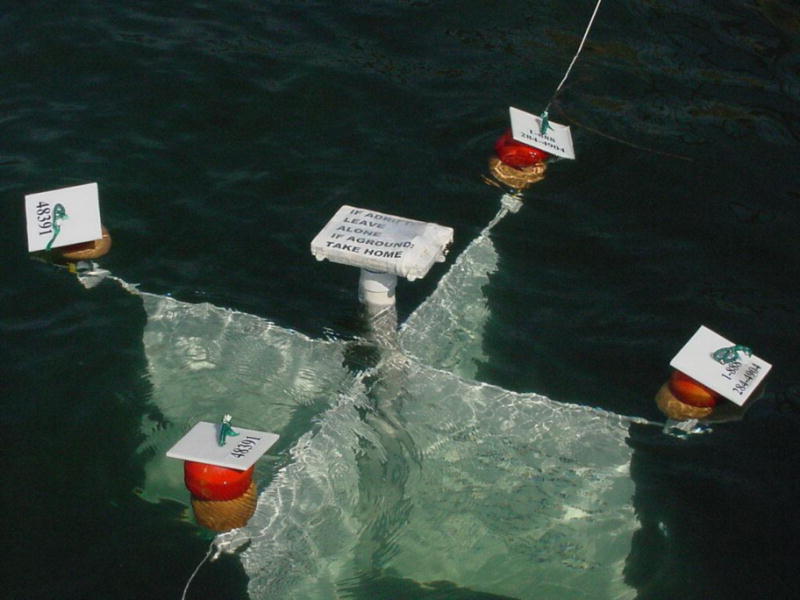
eMOLT/SMCC surface drifter first deployed in 2004
As noted in Table 1, some drifters were drogued at greater than 1m. Except for most of the SCOPEX and RMRP units, all drogues were centered in the top 15m of the water column. While drifters drogued at shallow depths are often referred to as “surface drifters”, they obviously have different water-following characteristics than the CODE-style surface drifters pictured in Figure 2. Most of the drogues used in these studies (and all of them after 2002) comply with the World Ocean Circulation Experiment specifications of 40:1 drag ratios. The drogued units deployed on the GPS units had either 6m×1.6m or 9m×1m holey-sock drogues centered at 13 or 15 meters, respectively. Data were removed from our analysis in a few cases where the trajectories changed dramatically, indicating possible drogue loss. This topic is discussed more fully below.
3. Data and Methodology
Processed drifter position data were submitted to the archive in a variety of ascii formats and, in most cases, were further processed to eliminate obvious bad points. Methods used to eliminate the erroneous points were similar to those reported by Hansen and Poulain (1996). Editing was conducted based on spikes in both the velocity and acceleration time series. A routine was developed to loop through tracks in order to pause and view cases of velocity > 200 cm/s and absolute accelerations > 0.0005 cm2/s. Some points were also eliminated subjectively. In some cases, time series had to be shortened where drifters had obviously lost their drogue, gone aground, or tangled with fixed gear. A log of edited points documents approximately 3% of raw fixes being removed. The majority of these edits were applied to the less-accurate ARGOS data. The final edited archive has been loaded into a web-served ORACLE database and is now available via the Open-source Project for a Network Data Access Protocol (OPeNDAP) at http://www.nefsc.noaa.gov/epd/ocean
In order to document the characteristics of flow for particular sections of coastline, the coastal current was divided into six regions. The regions chosen are fairly arbitrary, but the upstream sides of each are generally associated with deployment transects in recent years. The along-isobath length of each region was standardized to 100km. The inner and outer boundaries of each region were defined, respectively, by the 30m and 170m isobaths in order to span the core of the coastal current. The bounding isobaths were computed from a gridded-bathymetry database (Roworth and Signell, 1998). Statistics, such as mean velocity and transit times (along with multiple measures of variability), were calculated for each region. “Transit times”, the time required to move through the region in the alongshore dimension, were calculated for drifters that traversed at least 75% of the region and these times were adjusted when they did not pass through the entire box. Statistics were kept for all drifters on “percentage loss” to both the inshore and offshore sides of each box. Our objective was to estimate the degree of loss from the coastal current to the estuaries and mid-gulf, respectively. The calculations of velocity and transit times were conducted on the drifter’s longest period of time within the boundary of the region (ie the drifter may have entered the polygon multiple times but only the longest segment is used). The water column depth on entry to the box was stored for each drifter and the average depth of “flow-through” cases was calculated for each box. This last calculation was done to estimate the mean isobath of the GMCC.
In order to investigate smaller scale processes and, in particular, to quantify regions of retention (ie areas of long residence times), an alternative analysis was conducted on 0.5 degree grid of the entire gulf. Calculations of residence times and velocities were made for each grid cell and averaged over all drifters passing through the cell. Data were included in the calculations only if a drifter track spanned at least a quarter of the grid size and included at least 3 fixes. To prevent bias associated with partial tidal periods, calculations of speed and “sub-tidal” speed were only conducted on multiples of the M2 period. In the regions where the data density was particularly high, these same calculations were conducted with a smaller grid cell (0.2–0.25 degrees) in order to resolve more detailed structure in the mean flow.
The Western Gulf of Maine is fairly well instrumented with Eulerian current measurements, enabling comparisons with our Lagrangian observations (Figure 3). Only drifters passing “nearby” were included, which we defined by isobaths that were within ± 20 meters of the depth of the mooring location (that is, for a mooring in 85 m of water, we accepted drifter data from drifters passing over bottom depths from 65 to 105 m). The alongshore dimension varied for each mooring depending on the topography. In the case of mooring “A” in Massachusetts Bay, for example, the alongshore dimension was limited due to the complex bathymetry in that area. Mooring statistics were compiled for periods concurrent with the drifter’s time within the polygon.
Figure 3.
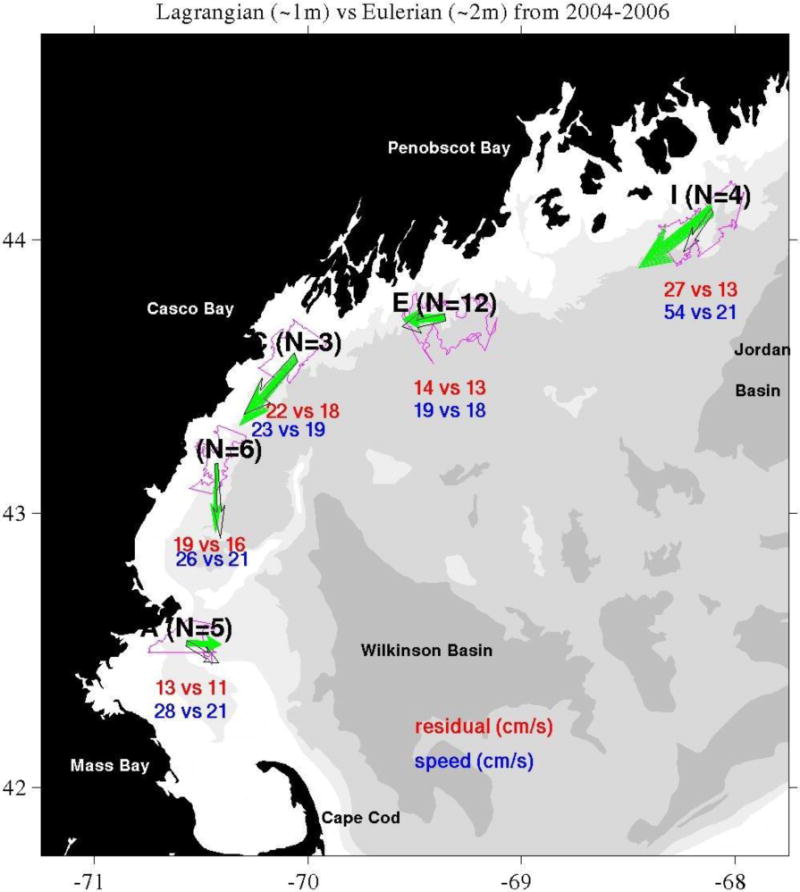
Lagrangian (green arrows) vs Eulerian (black arrows) residual (average over tidal periods) velocity. Values are posted in red along with the mean speeds in blue. Some of the geographic features referred to in the text are posted on this plot as well.
As in any observational study of this nature, an analysis of specific events often provides insights into aspects of the data not revealed by statistics alone. A number of individual drifter tracks could be singled out and associated with particular processes. Some of them, for example, documented drifters: a) often remaining in certain retention zones; b) reacting to small-scale density structures visible in satellite SST imagery; or c) reacting to episodes of wind-driven upwelling and downwelling.
Finally, it is instructive to test a few models against the observed drifter tracks. First, the surface flow can be estimated with a simple factor times the wind speed (m/s), as Ekman himself observed (see equation 9.12 of Pond & Pickard, 1983). Given the latitude of this study, a linear coefficient of 0.015 m/s current per m/s of wind is suggested by theory. After some experimentation on several cases, we found that a coefficient of 0.009 was a better fit for the study area. The anomalous wind as measured at the GoMOOS mooring “E” (off Mid-Coast Maine) drives the current directed 45 degrees to the right of the wind. It is “anomalous” in that we have removed the monthly mean wind (calculated from observations at NOAA buoy 44005, Figure 3) and interpolated to specific year-days. This anomalous-wind-driven flow was then added to the mean climatology as follows:
The purpose of this exercise was to determine how much of the floats meandering could be predicted based solely on the region’s Lagrangian climatology and an added wind effect.
Numerical particles were also tracked through a time-varying 3-d flow field generated by a state of the art coastal ocean model (Xue at al., 2000). In contrast to the overly-simplified Ekman solutions, the Princeton Ocean Model is a three-dimensional, non-linear primitive equation circulation model that also predicts, temperature, salinity, and density fields. Frictional closure of the equations is achieved by the Mellor and Yamada level 2.5 turbulent closure sub-model. It is forced by: a) surface fluxes (wind stress and heat fluxes) from the National Center for Environmental Prediction’s 32-km “Eta” model; and b) boundary forcing from several rivers as well as subtidal elevations offshore (derived from NCEP’s Regional Ocean Forecast System). While there are a number of 3-d models being used to study the Gulf of Maine with various techniques and forcings, the POM application has been run operationally, as part of GoMOOS, since 2001 (Xue et al., 2005).
4. Results
4.1 Regional Flow Statistics
Flow statistics for each of the six regions (Table 2) indicate a deceleration of surface flow from eastern Maine (Cutler) toward Massachusetts (Mass) Bay, some acceleration of flow on the east side of Cape Cod, and then another deceleration near the Great South Channel. The mean residual velocities downstream of Cutler in the Eastern Maine Coastal Current (EMCC) typically run near 16 centimeters per second (cm/s) and quickly decrease to roughly 9 cm/s in the WMCC. The nineteen drifters that entered the NE side of the box off Cutler Maine (Figure 4) recorded the strongest flows with typical transit times to the Penobscot region of approximately a week (7.3 day mean).
Table 2.
Regional Flow Statistics.
| Region | No. of drifters | Mean Speeda (cm/s) |
Mean Direction deg True | Mean transit time (d) |
Transit Std_Dev (d) |
Flow-through (%) |
Isobathb (m) |
|---|---|---|---|---|---|---|---|
|
| |||||||
| Cutler | 48 | 16.3 | 234 | 7 | 2 | 100 | 82 |
| Penobscot | 120 | 9.6 | 233 | 12 | 5 | 70 | 100 |
| Casco | 62 | 12.5 | 219 | 12 | 10 | 75 | 96 |
| Stellwagen | 106 | 14.1 | 139 | 13 | 8 | 69 | 67 |
| Cape Cod | 72 | 20.3 | 144 | 7 | 3 | 26 | 84 |
| WNS | 38 | 8.9 | 11.1 | 9 | 3 | 100 | 133 |
| Mean | 93 | ||||||
residual
mean isobath of entry to the region for drifters that flowed through.
Figure 4.
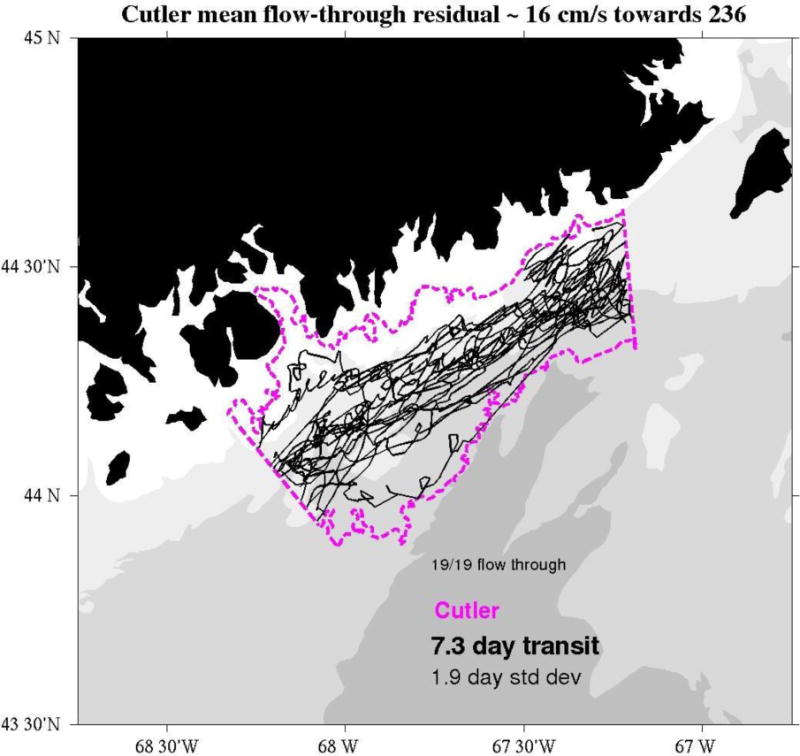
Drifters entering waters offshore Cutler Maine and heading SW in the Eastern Main. Note that, in this region, all the units that enter the polygon from the northeast side exit the southeast side.
Drifters deployed off the Isle au Haut and those that entered this region upstream of Penobscot from the northeast are shown in Figure 5. In this region, where data coverage is significantly greater than other regions, a calculation of drifter losses to both the inshore and offshore sides of the coastal current shows that very few (~5%) get into the inshore region while a relatively large percentage (~25%) is ejected offshore. The dashed lines indicate those units that exited the box on the offshore side and were not included in the 12 day mean transit time.
Figure 5.
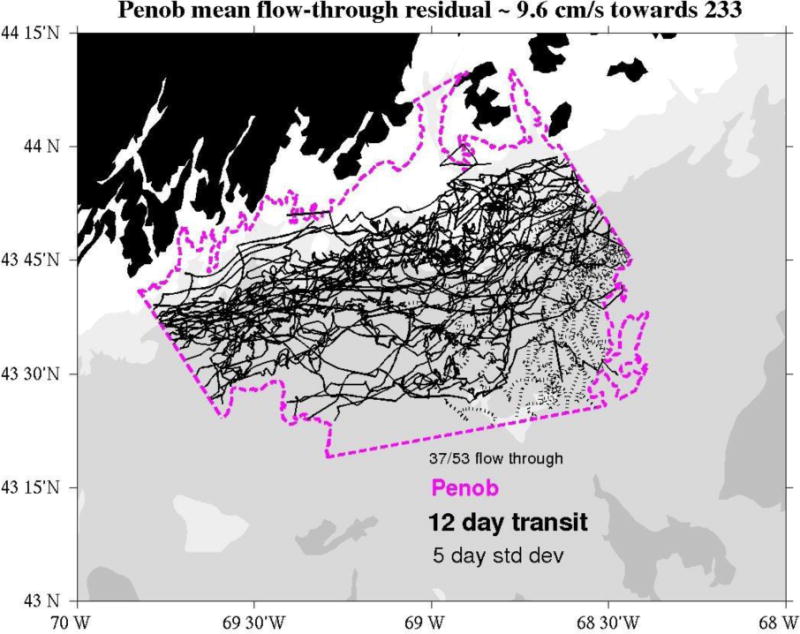
Drifters entering the NE side of a box off the mouth of Penobscot Bay (mid-coast Maine). Note that a significant portion (~30%) of the units exit the polygon (denoted by dashed lines) on offshore side.
The variability of flow increases in the downstream direction in that trajectories off southern Maine are less consistent and often include excursions away from the coastal current core. On many occasions, drifters in the WMCC Casco region (Figure 6) were ejected from the primary current and meandered about before being re-entrained into the southwestward flow. Drifters closer to shore have a more direct and persistent flow SW of Casco Bay. As suggested by Keafer et al. (2005), this more persistent inshore band, which they refer to as the Gulf of Maine Coastal Plume, may be separate from the WMCC, but the distinction here is very subtle and hard to quantify. The percentage of flow-through cases was nearly the same here as in the Penobscot region, but a few more escaped to the inshore side in the Casco case. The standard deviation of flow- through time in the Casco box is nearly as large as the mean.
Figure 6.
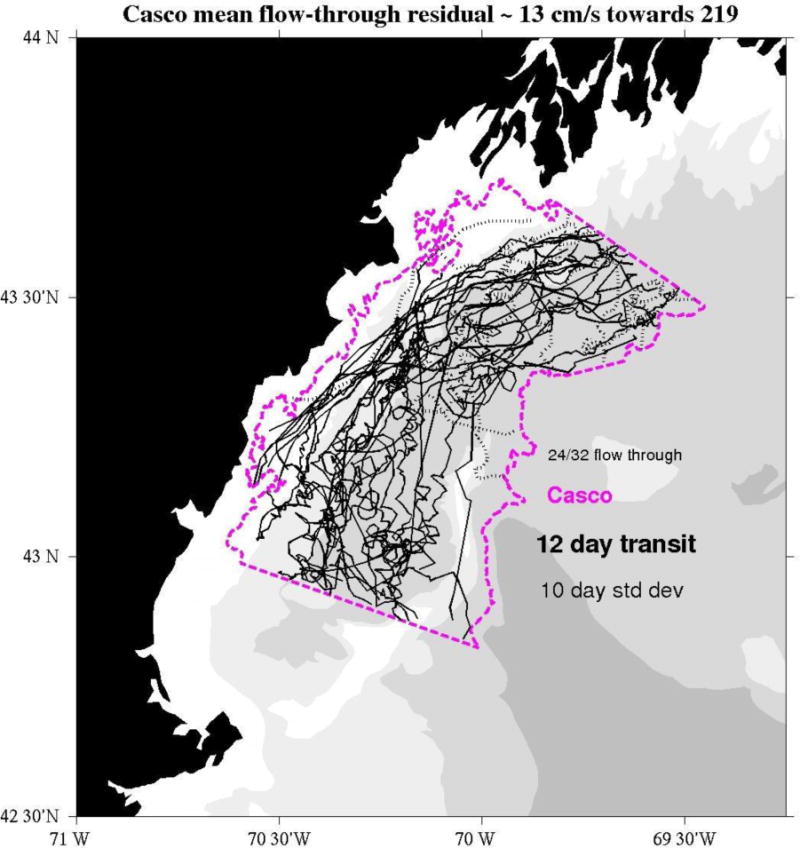
Drifters entering through a transect NE of Casco Bay. In this case, a few drifters exit the inshore side as well as the offshore side.
Pathways farther down the coast in the area of Mass Bay were more complex (Fig. 7). Only a few of the drifters that entered through the northern border of the box were advected toward shore, but the trajectories were highly variable until drifters passed the northeast corner of Cape Cod and headed toward the Great South Channel. While most of these drifters eventually flowed through the system, the standard deviation of flow- through time (8 days) was nearly as large as the 12-day mean.
Figure 7.
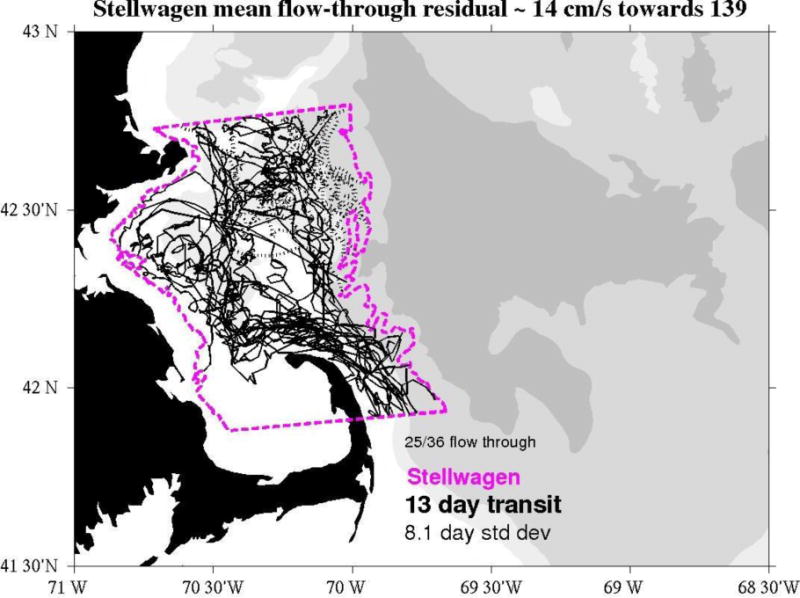
Drifters entering the NW side of a box over Stellwagen Bank.
On the eastern side of Cape Cod (Figure 8), only a few drifters come ashore and one enters Nantucket Sound, most continue in the along-isobath direction toward the GSC. The majority of these, however, evidently then cross isobaths heading more directly toward Georges Bank. This region had the largest percentage of units advected across-isobath to the “offshore” side. The quick transit times in this case (7.1 days) were similar to the Cutler region.
Figure 8.
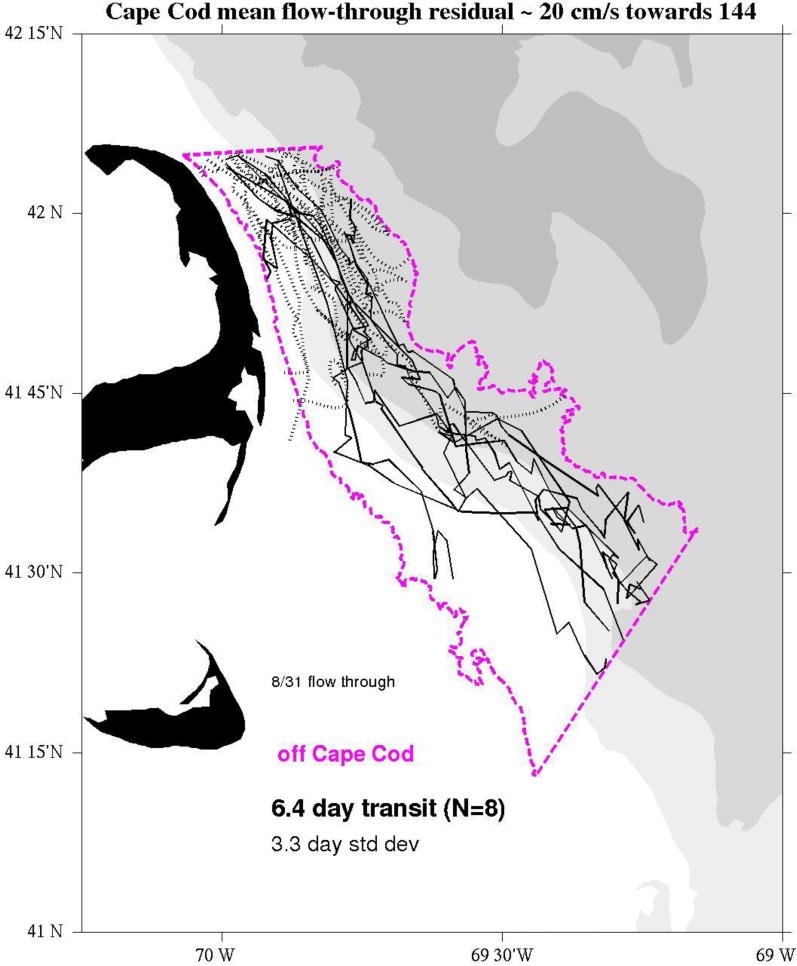
Drifters entering the northern side of a box on the eastern side of Cape Cod.
Finally, the area to the west of Nova Scotia (WNS) had a fairly constant northward flow toward the Bay of Fundy, with little or no export to the east or west (Figure 9). As obvious from the figure, the majority of these tracks originate in the western side of the gulf (where they were often deployed) and are then transported east before entering the box.
Figure 9.
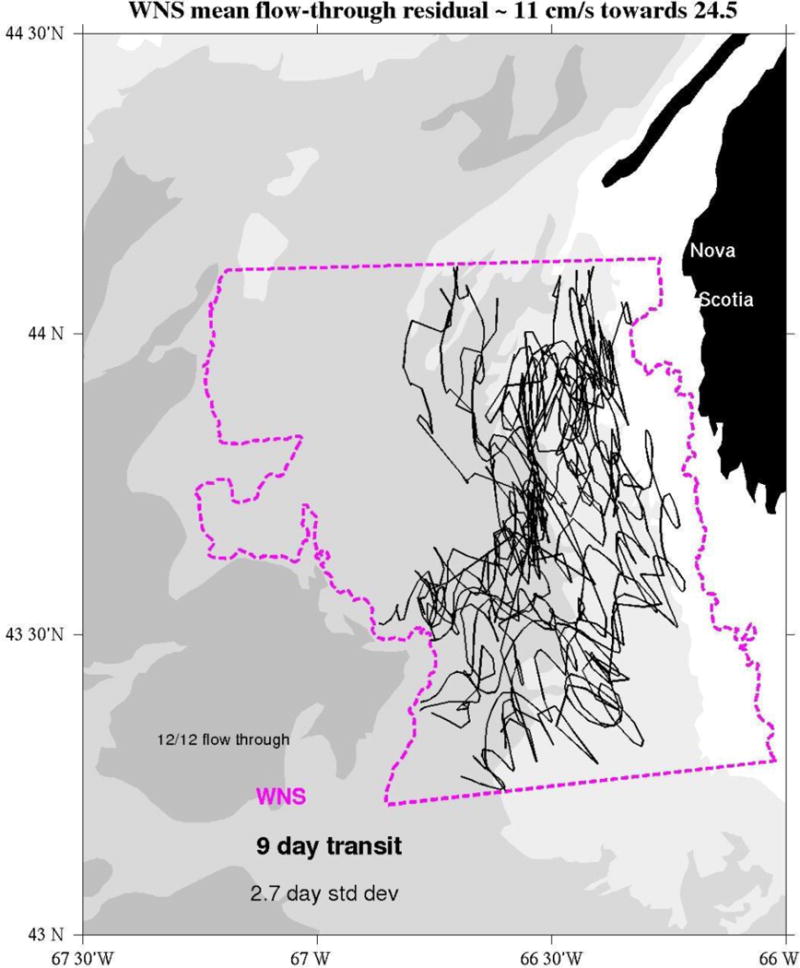
Drifters entering the southern side of a box off the West Coast of Nova Scotia
The isobath associated with “flow through” cases averaged over all six regions was 94 meters. This figure varied with each region and was shallower (86 +/− 13 m) if WNS was excluded (note in Table 2 that the polygon for WNS had a deeper average depth than the other regions). While these figures may be biased towards depths of deployments, the overall mean of 94 m can be considered an average isobath for the Gulf of Maine Coastal Current based on our Lagrangian observations.
The along-shelf connectivity between these six regions is presented in Figure 10. The statistics show that 72% of the drifters that entered the Cutler box subsequently entered the Penobscot box, while only 28% made it into the Casco Region. Note that no time constraints were considered in these calculations. Since the drifters’ life spans were less than the transit time estimated for the entire coastal current system, the statistics likely underestimate connectivity between distant polygons. Even with this limitation, our data show a high degree of connectivity between WNS and the coast of Maine, with 38% of the drifters from WNS passing through both Cutler and Penobscot regions.
Figure 10.
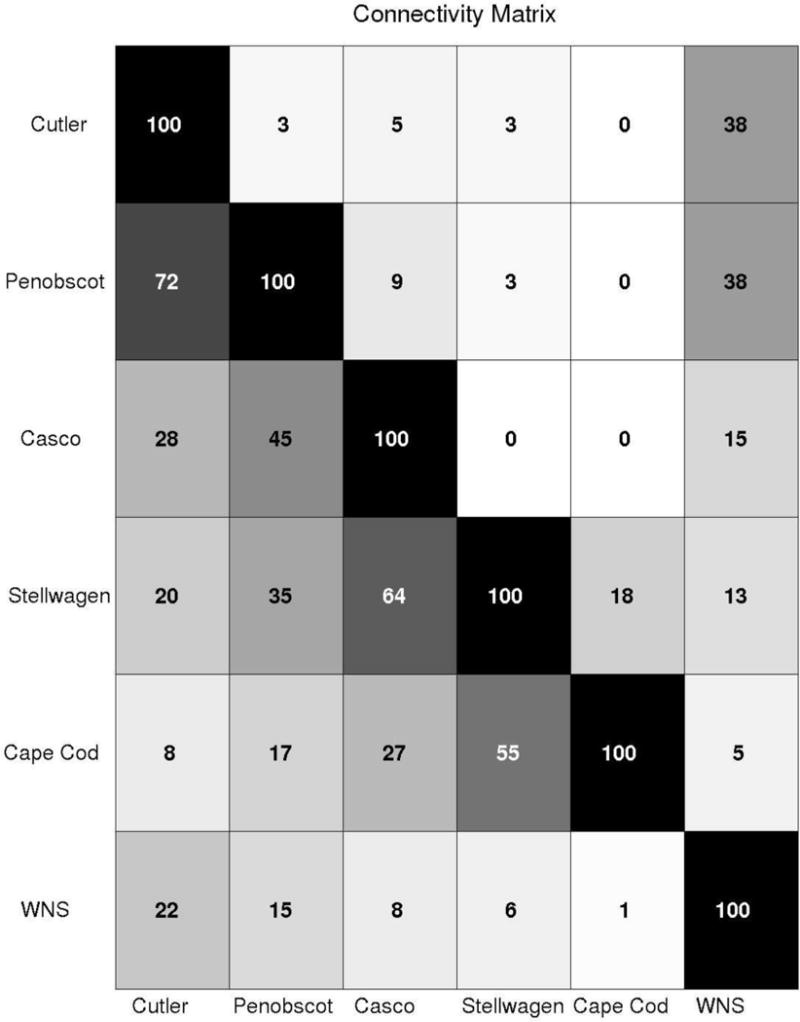
Connectivity matrix documenting the percent tracks emanating from one region(x axis) and arriving in another (y axis)
Additional statistics derived in each ½ degree grid are shown in Figure 11. While it is difficult to compare flow from one grid cell to the next due to the difference in the number of observations in the individual cells, there nevertheless appear to be zones of little net flow where drifters appear trapped in localized areas. The Great South Channel area, for example, appears to be an area of extended residence times despite being a very tidally dominated region. Residence times in the GSC are nearly double those in grid cells immediately upstream. The northern half of Jordan Basin is another retentive area. In some areas like the Bay of Fundy gyre, where the retention zone is larger than the grid cell, an analysis of this type is misleading. Aretxabaleta et al. (2008a) show, for example, that particles can be retained in the gyre during the late spring season for nearly a month.
Figure 11.
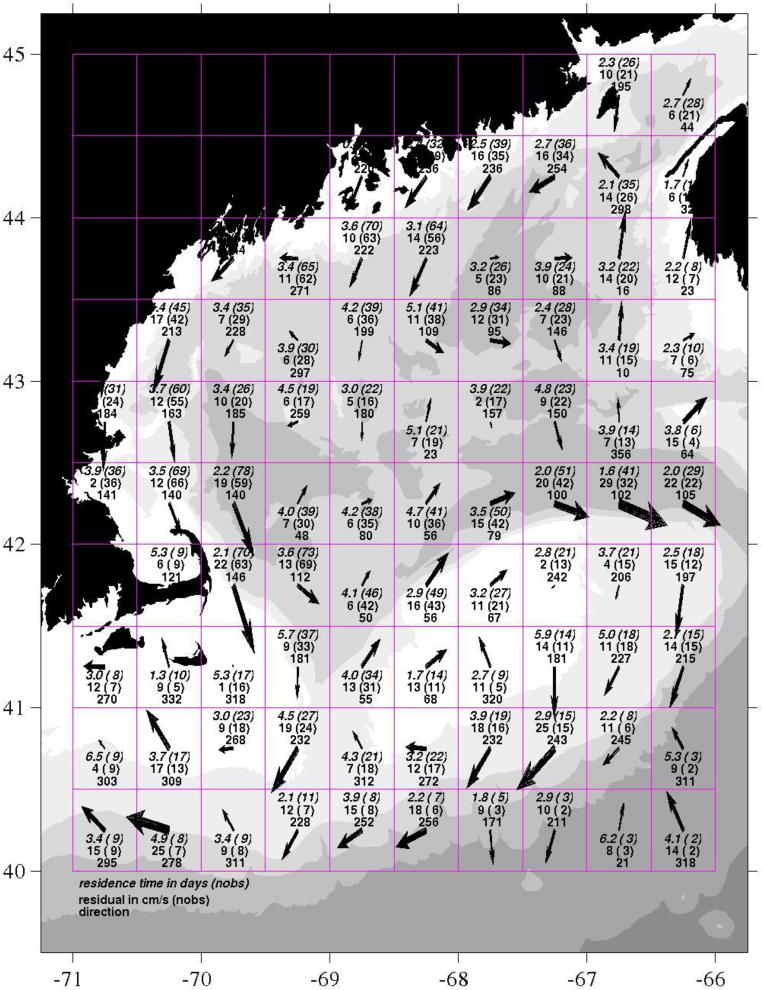
Gulf of Maine Lagrangian statistics for 1/2 degree grid cells. Residence times in days (italic), and low frequency speed (cm/s) and direction (degrees True) are posted for each cell where statistics are possible. The number of observations (nobs) appears in parentheses after each statistic.
We have increased the resolution for two areas where we had a large number of drifters: the GSC and the mid-coast Maine regions. The residual flow down the eastern side of Cape Cod, for example, was nearly 20 cm/s but was reduced to half that at the northern section of the GSC (Fig. 12). Residence times were often greater than 2 days for some cells in the GSC, the Nantucket Shoals, and the southern edge of Wilkinson Basin. In the mid-coast Maine region, flow entering the region was also on the order of 20 cm/s but was nearly half that rate in the region south and west of Penobscot Bay (Fig. 13). The flow was seen to turn off shore in the mean sense at a few cells south of the Isle au Haut at a longitude of 68.5W.
Figure 12.
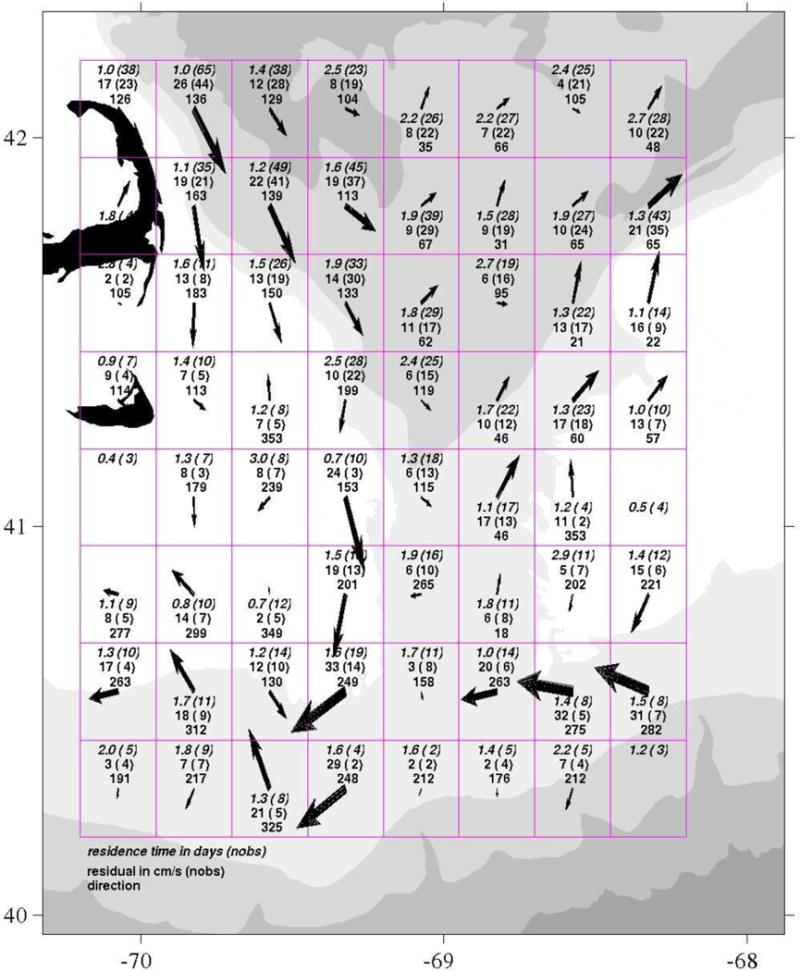
Great South Channel Lagrangian Statistics on ¼ degree grid; data same as in Fig. 11 but the area associated with each cell is about a quarter of those in Figure 11.
Figure 13.
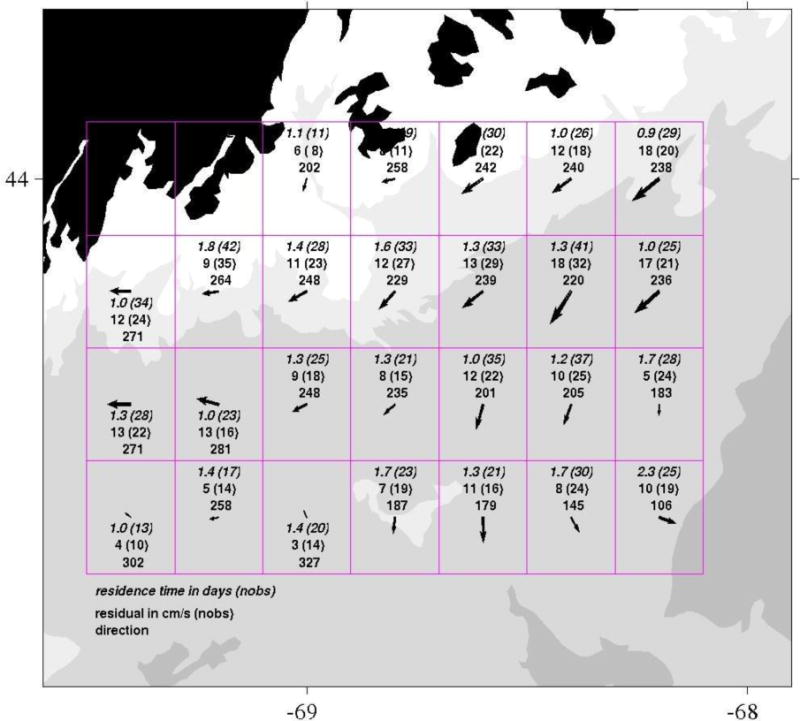
Mid-coast Maine Lagrangian statistics on 0.2 degree cells; data as in Fig. 11 but the area associated with each cell is about a quarter of those in Figure 11.
4.2 Temporal Variability
Finally, there are several cases where four or more drifters were deployed at the same location (within a tidal excursion distance of a nominal position) and at different times. (Fig. 14). Four drifters deployed off Isle of Haut (top left panel, summer 2004), for example, traveled very different paths. Those deployed at the Mass Bay outfall site (summer 2005) also resulted in very different paths, though the depth of the drogues varied slightly between deployments. Single site releases of off Cape Small and Gloucester further illustrate the variations in trajectories that can exist. The lower left panel shows results from a smaller scale experiment in between the islands of Matinicus and Metinic near Penobscot in mid-summer 2005 where drifters were deployed at the same spot only days apart. The thin lines in this panel show tracks covered in susbsequent years 2006–2007. While there is considerable variability of the wind in the Gulf of Maine region (Manning and Strout, 2001) that explains much of this temporal variability, changes in the baraclinc structure and meandering path of the coastal current could be equally important for many of these cases.
Figure 14.
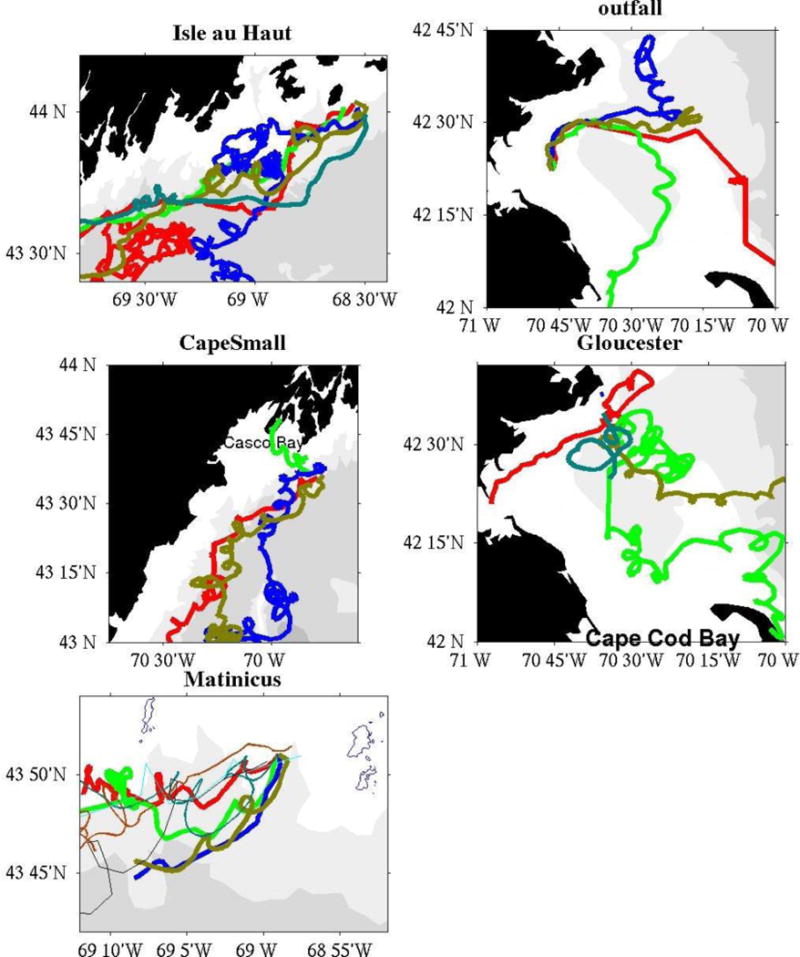
Drifters deployed at same locations but at different times (see text for explanation).
4.3 Modeled Trajectories
To conduct model simulations on each and every track in the archive is beyond the scope of this report but some representative examples are plotted in Figure 15. These plots show observed tracks, climatology, and model hindcasts for drifter deployment locations off mid-coast Maine in May 2004 when there was a significant component of anomalous winds from the northeast that tended to drive the drifters closer to shore. In some cases the simple Ekman calculation did well (panels a and b) and in other cases the full 3-d model did best (panels c and f). The climatology alone (based purely on the empirical statistics displayed in Figure 11) provided the best estimate (panels d and e). It is clear that no one model does consistently better than others in these limited applications but a lot more work is required to evaluate the results from various models.
Figure 15.
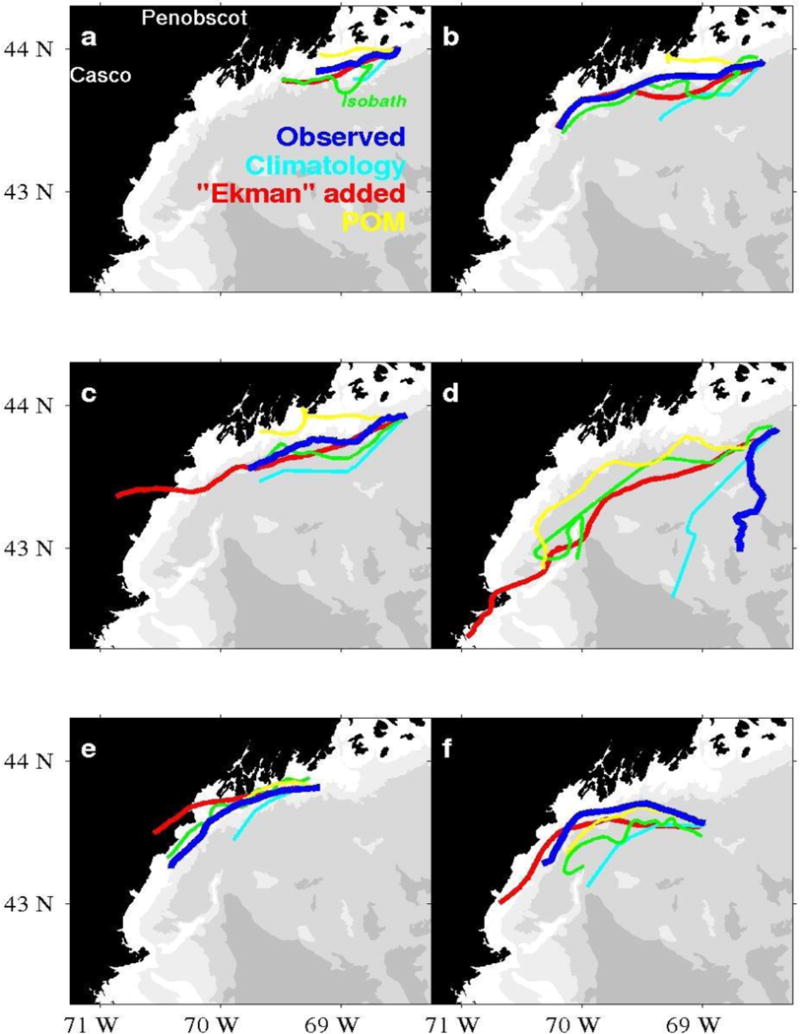
Examples of hindcasting particle tracks using both simple and sophisticated (3-d) models for May 2004, when there was an anomalous wind from the northeast. Tracks are detided and the isobaths are smoothed to reduce clutter. Ekman-derived tracks actually went ashore in some cases (c, d, and e).
5. Discussion
5.1 Drogued vs surface drifters
While most of the deployments in the database involve single drifters tracking a single layer of the water-column, there were a few exceptions. In May 2004, for example, drogued drifters (centered at 13 m) were diverted offshore relative to surface drifters that were deployed at the same locations (within a few hundred meters) and time. While satellite imagery is limited in the Gulf of Maine, there were periods of clear skies that helped in the interpretation of these tracks. As depicted in Figure 16, the coastal current in this mid-coast region is especially complicated and often diverges into a series of eddies on the surface that may not represent the deeper flow field. These complexities make it difficult to infer depth-averaged transport on the basis of surface information alone.
Figure 16.
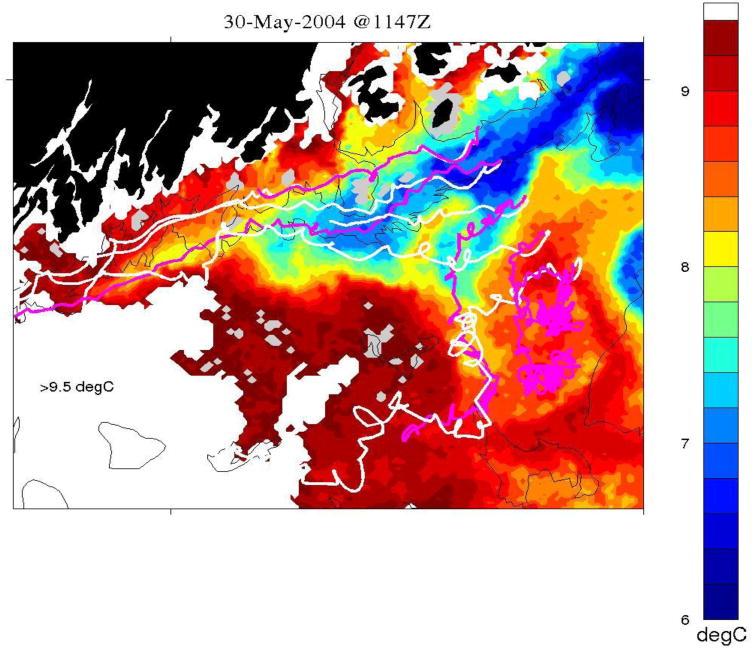
Example of surface (white) and drogued (black) drifters diverging at mid-transect stations off Penobscot in 2004. Trajectories demonstrate complexity of the baroclinic structure in both the horizontal and vertical dimensions
The drogued RMRP drifters deployed in the mid-90’s were generally diverted offshore and some “short-circuited” to Georges Bank. This short circuiting has been observed on many occasions since then with both surface and drogues drifters. (Figure 17). It occurred several times in 2006, only once in 2007, and several times in 2008 but the time scale associated with these modes is not clear.
Figure 17.
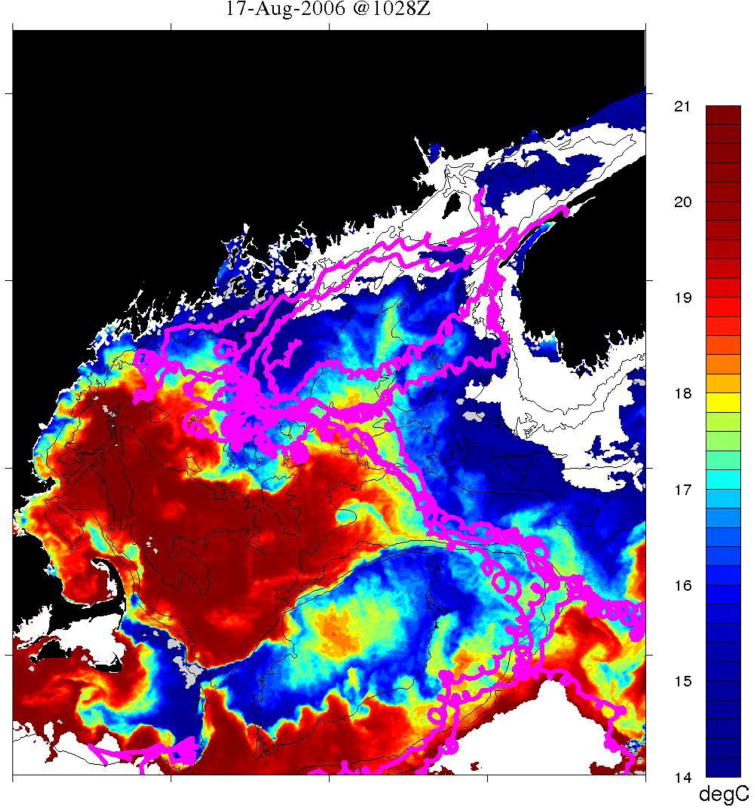
Example of “short circuit” trajectories to Georges Bank. (Note: The 2008 tracks, denoted by dashed lines, were not included in any other analysis/statistics of this report.) The black circles represent the starting locations of each track.
It is hoped that more drogued drifters can be deployed at multiple-depths in the future to better document the vertical shear (especially in areas not already monitored by moored instrumentation). To do so adequately will require the addition of drogue-loss sensors that were not standard equipment on most of the drogued units described herein. Since the timing of drogue loss is uncertain, drifters found with drogues lost were archived as having drogue-depth equal zero. As in Pazan and Niiler (2001) and Brugge and Dengg (1991), sensitivity tests were conducted on the statistics resulting from both drogued and undrogued units in order to investigate the potential biases associated with this problem. The general conclusions regarding pathways and transit times still hold. While the differences are insignificant, it is difficult to quantify with any certainty. More drogued units will need to be deployed to ascertain the real differences in flow field statistics.
5.2 Eulerian vs Lagrangian velocities
Eulerian and Lagrangian velocities (in cases where drifters were close enough to the mooring locations) compared well (Figure 3). The slightly larger Lagrangian values at all five locations might be expected since: a) the drifters are more apt to be entrained in a relative narrow jet that does not necessarily pass over the mooring location; and b) most are measuring the flow in the top 1 m whereas the moored data are taken from the 2-m current meter. The velocity differences, however, are likely within the error of such a rough comparison. Given the topographic complexity off the coast of Maine, there is significant uncertainty in extrapolating the flow characteristics much beyond the specific mooring locations. However, this comparison lends credibility to the results of Figures 11~13. The flow statistics as measured by relatively inexpensive drifters can be obtained over the entire gulf given the collective archive from multiple projects. Lagrangian statistics can now be derived for any user-specified polygon in the region.
Individual drifter tracks, deployed at critical locations, are valuable in their own right for documenting flows at particular times. Given the difficulties involved in properly initializing the density structure of the Gulf of Maine circulation models (Pringle, 2006), low-cost drifters deployed on a regular/operational basis can help document much of the fine-scale processes that occur on a less-than seasonal cycle.
5.3 Cross-shelf and along-shelf variability of the coastal current
Results of the regional statistics listed in Table 2 are obviously sensitive to the polygon specified. In order to document this sensitivity, a section of the coast is examined where the mean flow is shown to be a function of the depth zone (Figure 18). Three different zones are examined 20–80, 60–120, and 100–160 to show that the mean flow varies depending on the isobaths (meters) chosen to bound the region. This result supports the earlier finding that the coastal current core is centered at 94 m. The inshore-most and offshore-most depth zones have velocities less than the core. The results of the regional analysis are also sensitive to the along-shelf position of the polygon. This may be especially the case for the Western Nova Scotia shelf, for example. If the latitudinal boundaries of WNS were positioned farther north we might see a significant portion of tracks escape “offshore” toward the west as they head toward the WMCC.
Figure 18.
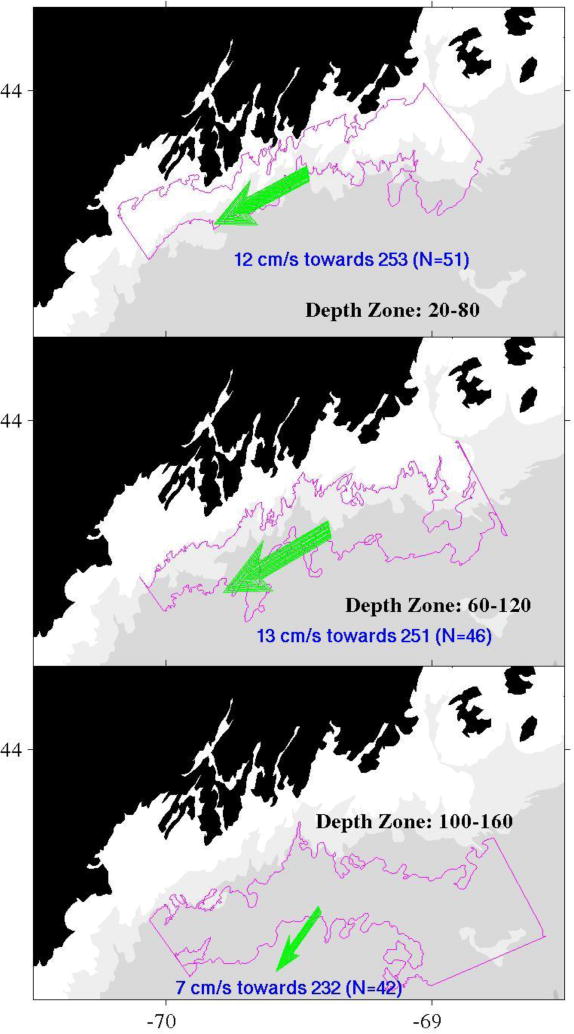
Mean speeds and directions of drifters off Penobscot as a function of shelf depths (intervals are listed within each panel). The offshore boundary in the lowermost panel is constrained to minimize the disproportionate amount of mid-gulf area associated with the 160m isobath
5.4 Modeled vs Observed Particle Tracks
In general, the model results demonstrate the difficulty of making predictions for single particle trajectories in the Gulf of Maine, and the need for data assimilation and continued model development. One reason for the significant discrepancies in the various tracks is that different particle tracking techniques were used. For the POM tracks, for example, the NOAA oil spill “GNOME” tracking routines were used to advect particles. The yellow lines (Figure 15) are the result of an ensemble of runs where a 10% random factor was applied to the velocity vectors in each of the individual runs and a mean track was derived from the ensemble. But, since drifters, especially the drogued drifters in panels c and d, obviously do not move in the same way an oil spill might, it is not surprising to find a discrepancy. A complete evaluation of model-derived vs. observed drifter tracks is underway and a subject of a subsequent manuscript.
6. Summary
The growing number of drifter deployments in recent years makes it possible to generate statistics on the Lagrangian flow fields for particular regions of the Gulf of Maine. Both the surface and deeper (drogued) drifters generally remained within the coastal current where most of them were deployed. There were many instances, particularly in certain sections of the coast (off Penobscot Bay and on the eastern side of Cape Cod, for example), where drifters crossed isobaths and left the core of the current. Some regions, particularly in the northern sections of the gulf, can be characterized as “flow through” systems where there is a less variable and more constrained coastal current that approaches 20 cm/s in the mean for these measurements (spring and summer). The overall mean transit time from the Bay of Fundy to the Great South Channel was less than two months (55 days) and the overall mean location of the core of the coastal current, as defined by drifter trajectories, was the 94 m isobath (86 m outide of WNS).
The temporal variability of tracks emanating from the same locations is shown to be significant, which supports the need for more numerical modeling of the underlying processes. Neither a simple Ekman model nor a full scale 3-d model consistently explained the cross-isobath excursions that are probably caused by baroclinic perturbations and possibly local variations in the wind.
Now that the archive of GoM drifter tracks is in place, and a general description of the entire collection is presented here, investigators can begin to examine the variety of processes that govern both the mean and the variability of the advective pathways around the gulf. These web-served data (see http://www.nefsc.noaa.gov/epd/ocean and click on “data”) can be used to evaluate model simulations. The most-recent underway tracks are posted at http://www.nefsc.noaa.gov/drifter.
Acknowledgments
The authors thank students at Southern Maine Community College for building hundreds of drifters over the past few years, lobstermen all along the New England coast for deploying many drifters, all the mariners and beach-walkers who have assisted in reporting and recovering units, the officers and crews of the multiple research vessels involved in drifter-deployment and recovery operations. We thank the staff of the Physical Oceanography group of the University of Maine and the GoMOOS organization for maintaining the mooring array, the US Coast Guard Search and Rescue Group, the Northeast Fisheries Science Center’s Protected Species Branch, Rich Signell, Richard Limeburner, and Rocky Geyer for providing drifter data, Huijie Xue for providing model output, Maureen Taylor and Changsheng Chen for providing reviews of the manuscript, and the multiple funding agencies listed in Table 1 for providing support.
References
- Anderson DM, Townsend DW, McGillicuddy DJ, Turner JT, editors. The Ecology and Oceanography of Toxic Alexandrium Blooms in the Gulf of Maine. Deep-Sea Research II. 2005a;52:19–21. [Google Scholar]
- Anderson DM, McGillicuddy DJ, Keafer BA, Michelson M, Keay K, Libby PS, Manning JP, Mayo C, Whittaker D, Hickey JM, He R, Lynch D, Smith K. Initial Observations of the 2005 Alexandrium fundyense bloom in southern New England. Deep Sea Research II. 2005b;52(19–21):2856–2876. [Google Scholar]
- Aretxabaleta A, McGillicuddy DJ, Smith KW, Lynch DR. Model Simulations of the Bay of Fundy Gyre: 1. Climalogical Results. Journal of Geophysical Research. 2008a doi: 10.1029/2007JC004480. submitted. [DOI] [PMC free article] [PubMed] [Google Scholar]
- Aretxabaleta A, McGillicuddy DJ, Smith KW, Manning J. Model Simulations of the Bay of Fundy Gyre: 2. Hindcasts for 2005–2007 Reveal Interannual Variability in Retentiveness. 2008b doi: 10.1029/2008JC004948. In prep. [DOI] [PMC free article] [PubMed] [Google Scholar]
- Bogden PS, Malanotte-Rizzoli P, Signell R. Open-ocean boundary conditions from interior data: Local and remote forcing of Massachusetts Bay. Journal of Geophysical Research. 1996;101(C3):6487–6500. [Google Scholar]
- Brink KH, Limeburner R, Beardsley RC. Properties of flow and pressure over Georges Bank as observed with near-surface drifters. Journal of Geophysical Research. 2003;108(NO. C11) doi: 10.1029/2001JC001019. [DOI] [Google Scholar]
- Brooks DA. A model study of the buoyancy-driven circulation in the Gulf of Maine. Journal of Physical Oceanography. 1994;24(11):2387–2412. [Google Scholar]
- Brugg B, Dengg J. Differences in drift behavior between drogued and undrogued satellite-tracked drifting buoys. Journal of Geophysical Research. 1991;96(C4):7249–7263. [Google Scholar]
- Chen C, Beardsley RC, Cowles G. An unstructured grid, finite-volume coastal ocean model (FVCOM) system. Special Issue entitled “Advance in Computational Oceanography’. Oceanography. 2006;19(1):78–89. [Google Scholar]
- Davis R. Drifter Observations of Coastal Surface Currents During CODE: The Method and Descriptive View. Journal of Geophysical Research. 1985;90:4741–4755. [Google Scholar]
- Fong DA, Geyer WR, Signell RP. The wind-forced response on a buoyant coastal current: Observations of the western Gulf of Maine plume. Journal of Marine Systems. 1997;12(1–4):69–81. [Google Scholar]
- Geyer WR, Gardner GB, Brown WS, Irish J, Butman B, Loder T, Signell R. Physical oceanographic investigation of Massachusetts and Cape Cod Bays. Boston: Massachusetts Bays Program Report MBP-92-03; 1992. [Google Scholar]
- Geyer WR, Signell RP, Fong DA, Wang J, Anderson DM, Keafer BA. The freshwater transport and dynamics of the western Maine coastal current. Continental Shelf Research. 2004;24(12):1339–1357. [Google Scholar]
- Hansen DV, Poulain PM. Quality control and interpolation of WOCE/TOGA drifter data. Journal of Atmospheric and Oceanic Technology. 1996;13:900–909. [Google Scholar]
- He R, McGillicuddy DJ, Lynch DR, Smith KW, Stock CA, Manning JP. Data assimilative hindcast of the Gulf of Maine coastal circulation. Journal Geophysical Research. 2005;110:C10011. doi: 10.1029/2004JC002807. [DOI] [Google Scholar]
- Hetland R, Signell R. Modeling coastal current transport in the Gulf of Maine. Deep Sea Research II. 2005;52(19–21):2430–2449. [Google Scholar]
- Huret M, Runge JA, Chen C, Cowles G, Xu Q, Pringle JM. Dispersal modeling of fish early life stages: Application to Atlantic cod in the western Gulf of Maine. Marine Ecology Progress Series. 2006 doi: 10.3354/meps06983. [DOI] [Google Scholar]
- Incze LS, Naimie CE. Modelling the transport of lobster (Homarus americanus) larvae and postlarvae in the Gulf of Maine. Fisheries Oceanography. 2000;9:99–113. [Google Scholar]
- Keafer BA, Churchill JH, McGillicuddy DJ, Jr, Anderson DM. Bloom development and transport of toxic Alexandrium fundyense population within a coastal plume in the Gulf of Maine. Deep Sea Research II. 2005;52:2674–22697. [Google Scholar]
- Limeburner R, Beardsley RC. Near-surface recirculation over Georges Bank. Deep Sea Research II. 1996;43(7–8):1547–1574. [Google Scholar]
- Lynch DR, Holboke MJ, Naimie CE. The Maine Coastal Current. Continental Shelf Research. 1997;17(6):605–634. [Google Scholar]
- Manning JP, Strout G. Georges Bank winds: 1975–1997. Deep Sea Research. 2001;48(1–3):115–135. [Google Scholar]
- Manning JP, Churchill JH. Estimates of dispersion from clustered-drifter deployments on the southern flank of Georges Bank. Deep Sea Research II. 2006 doi: 10.1016/j.dsr2.2006.08.004. [DOI] [Google Scholar]
- Manning J. Environmental Monitors on Lobster Traps: Phase IV Drifters. Final Report to the Northeast Consortium. 2006 WWW Page. http://www.nefsc.noaa.gov/epd/ocean/MainPage/lob/driftfinal.pdf.
- Namie CE, Limeburner R, Hannah CG, Beardsley RC. On the geographic and seasonal patterns of the near-surface circulation on Georges Bank: from real and simulated drifters. Deep Sea Research II. 2001;48:501–518. [Google Scholar]
- Pazan SE, Niiler PP. Recovery of near-surface velocity from undrogued drifters. Journal of Atmospheric and Oceanic Technology. 2001;18:476–489. [Google Scholar]
- Pettigrew NR, Churchill JH, Janzen CD, Mangum LJ, Signell RP, Thomas AC, Townsend DW, Wallinga JP, Xue H. The kinimatics and hydrographic structure of the Gulf of Maine Coastal Current. Deep Sea Research II. 2005;52(19–21):2369–2391. [Google Scholar]
- Pond S, Pickard GL. Introductory Dynamical Oceanography. Pergamon Press; New York: 1983. [Google Scholar]
- Pringle J. Sources of variability in Gulf of Maine circulation and the observations needed to model it. Deep Sea Research II. 2006;53(23–24):2457. [Google Scholar]
- Roworth E, Signell R. Construction of Digital Bathymetry for the Gulf of Maine. US Geological Survey Open-File Report. 1998:98–801. URL: http://pubs.usgs.gov/of/1998/of98-801/index.htm.
- Xue H, Chai F, Pettigrew N. A Model study of the seasonal circulation in the Gulf of Maine. Journal of Physical Oceanography. 2000 doi: 10.1175/1520-0485(2000)030<1111:AMSOTS>2.0CO;2. [DOI] [Google Scholar]
- Xue H, Shei L, Cousins S, Pettigrew NR. The GoMOOS nowcast/forecast system. Continental Shelf Research. 2005;25:2122–2146. [Google Scholar]
- Xue H, Incze L, Xu D, Wolff N, Pettigrew N. Connectivity of lobster populations in the coastal Gulf of Maine. Part 1: Circulation and larval transport potential. Journal of Ecological Modeling. 2008 doi: 10.1016/j.ecolmodel/2007.07.024. [DOI] [Google Scholar]


