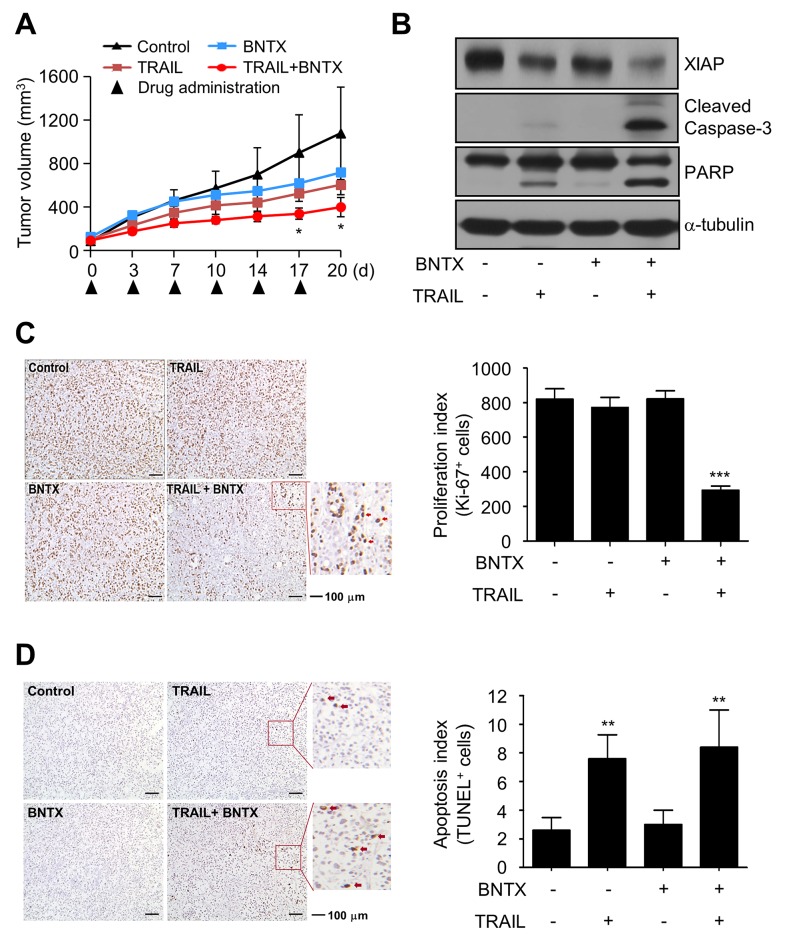
Figure 6. Combined treatment with BNTX and TRAIL induces tumor regression in a xenograft model.
(A) The mean tumor volumes in each treatment group. Asterisks indicate significant differences compared with the control (* P < 0.05). (B) The expression of XIAP, cleaved caspase-3, and PARP in protein extracts from tumor xenografts were analyzed by western blot analysis. (C, D) Representative images of tumor sections examined by immunohistochemical analysis (Ki-67 and TUNEL staining). The associated histograms show the number of immunopositive cells by the Ki-67 or TUNEL assay. Values are the mean ± SD (n = 5). Asterisks indicate significant differences compared with the control (** P < 0.01, *** P < 0.001).

