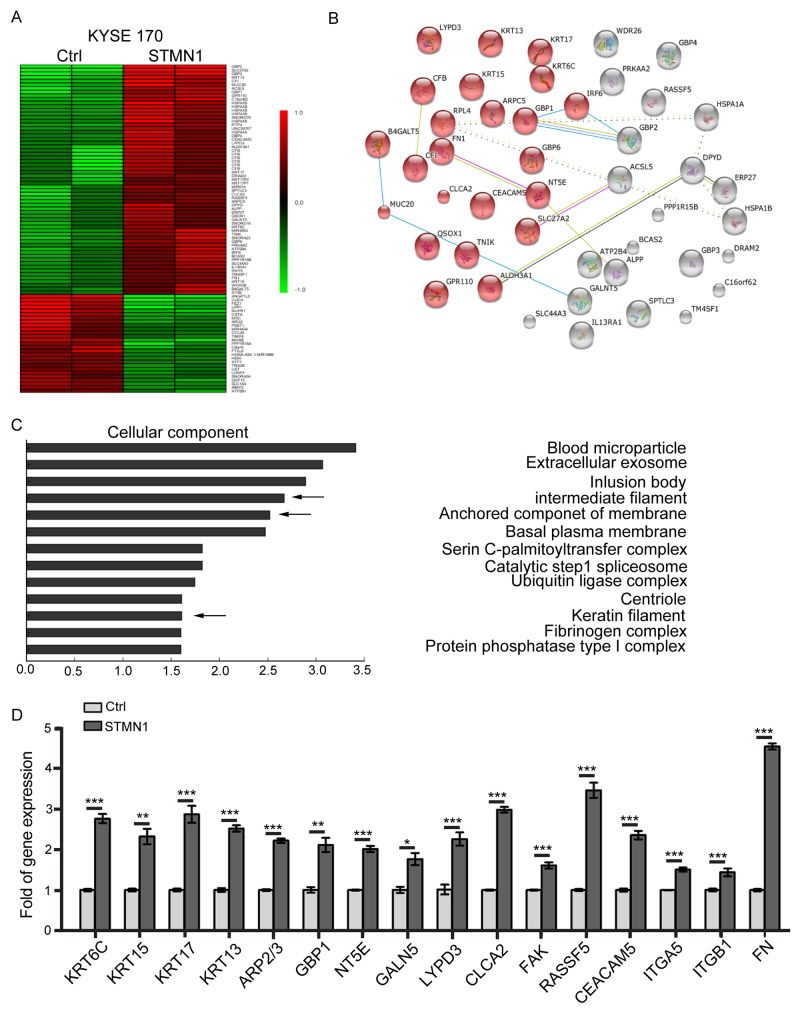
Figure 3. Gene expression changes in stathmin-overexpressing ESCC cells.
(A) Heatmap representation of 90 genes showing significant differential expression between the STMN1 group and the control group. A color scale for the normalized expression data is shown on the right side of the microarray heatmap (green represents downregulated genes, whereas red represents upregulated genes). (B) The gene changes were functionally analyzed using the online tool STRING. (C) The upregulated genes were functionally classified based on their cellular components using the DAVID functional annotation clustering tool. (D) The mRNA levels of candidate genes were determined using real-time PCR. The data represent the mean±SD of relative mRNA levels versus control cells. (*, P<0.05; **, P<0.01; ***, P<0.001).

