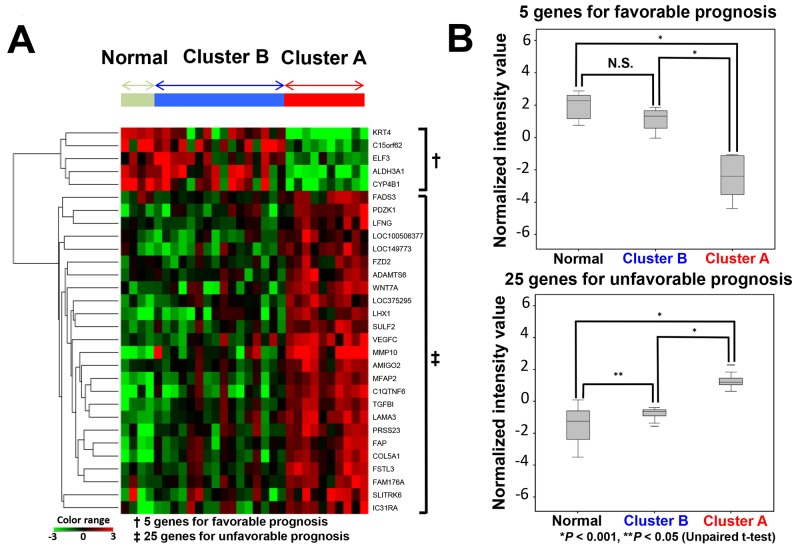
Figure 2. Relationship of the expression of 30 genes between cluster A, cluster B and normal tissues.
(A) Hierarchical cluster analysis of 30 samples (26 carcinoma tissues, 4 matched normal tissues) derived from 26 patients based on 30 gene expression patterns. (B) Normalized intensity values of predictive candidate genes of normal, cluster A and cluster B subgroups. Upper graph: five genes associated with a favorable prognosis. Lower graph: 25 genes associated with an unfavorable prognosis.

