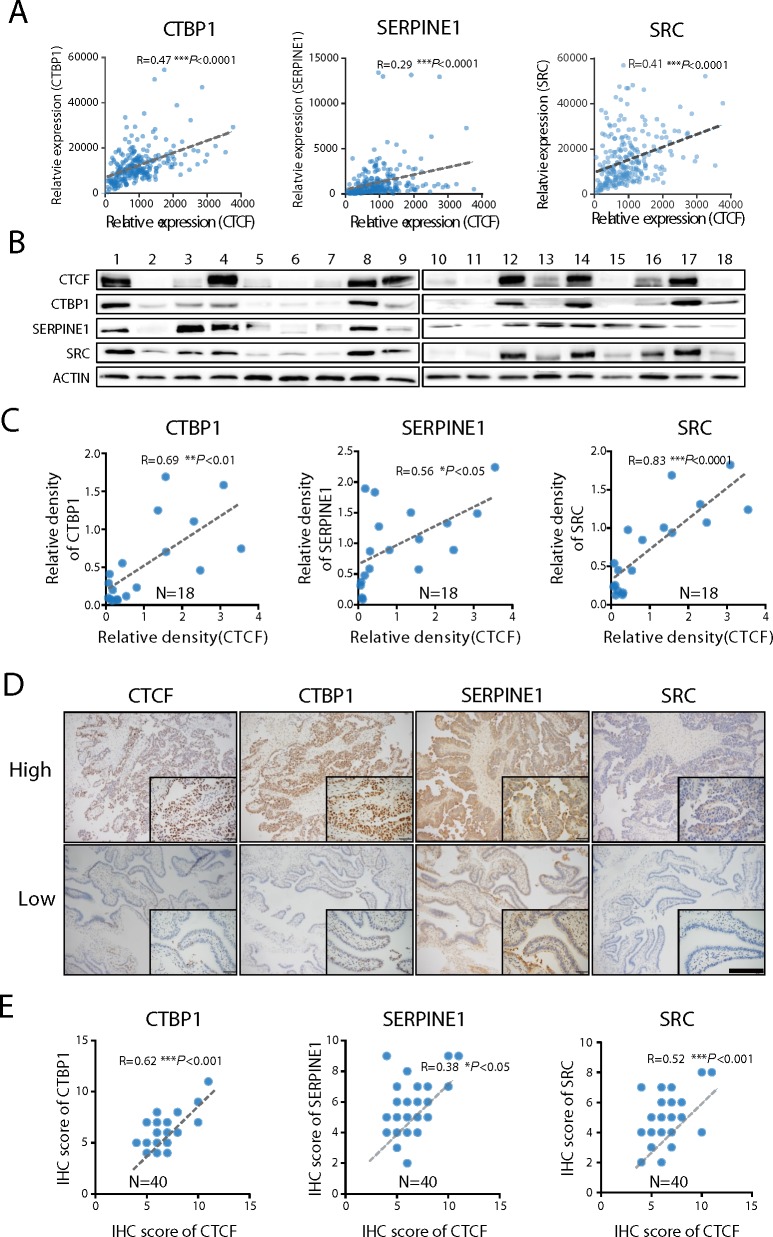
Figure 6. CTCF expression is directly correlated with CTBP1, SERPINE1 and SRC expression.
(A) The correlations between CTBP1, SERPINE1, SRC and CTCF in ovarian cancer specimens obtained from the GEO database (GSE13876) were analyzed. (B) The expression of CTBP1, SERPINE1, SRC and CTCF in 18 ovarian cancer specimens was determined by Western blot analysis. Representative data from 3 independent experiments are shown. (C) The correlations between CTCF expression and CTBP1, SERPINE1 and SRC protein expression in (B) were analyzed. (D) The expression of CTBP1, SERPINE1, SRC and CTCF was evaluated by IHC analysis of ovarian cancer specimens from a different cohort comprising 40 patients. Representative images are shown (scale bar, 50 μm). (E) The IHC scores were used to analyze the correlations.

