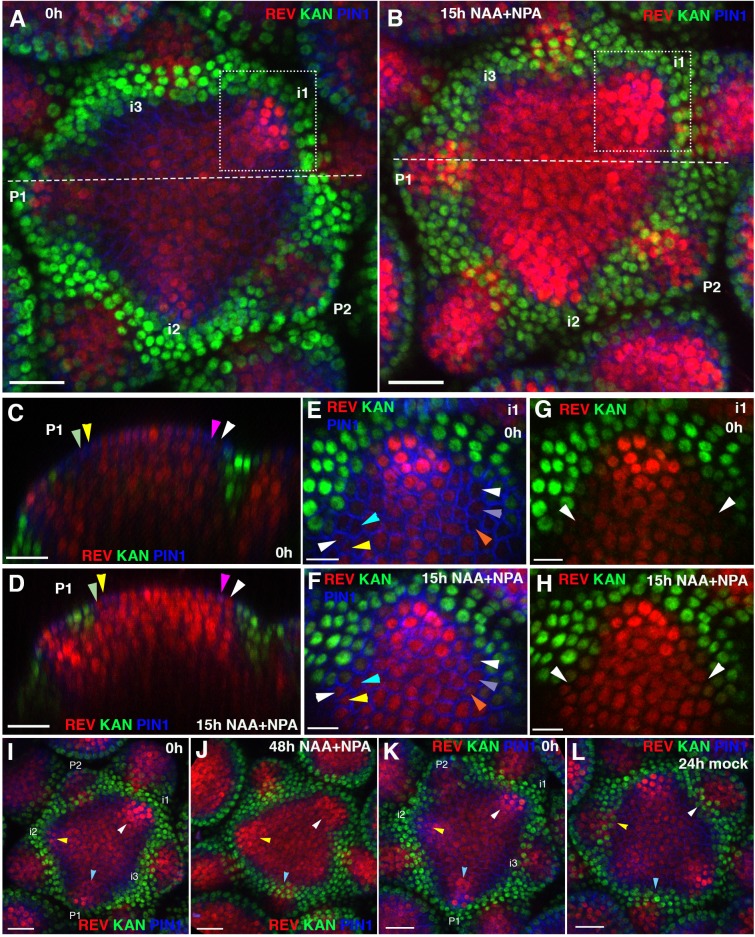
Figure 10. Effect of auxin on the expression patterns of REV and KAN1 in the inflorescence meristem.
(A and B) Confocal projections of the IMs showing expression pattern of REV-2 × YPet (red), KAN1−2 × GFP (green) and PIN1-CFP (blue) before (A) and 15 hr after the combined application of 5 mM NAA and 100 μM NPA (B). Primordium (P) and incipient primordium (i) stages are numbered from i3-P2 based on convention described in (Heisler et al., 2005). Note up regulation and expansion of REV expression 15 hr after the combined application of NAA and NPA (n = 6). (C and D) Longitudinal optical sections along the dashed white lines in (A) and (B) respectively. Note the presence of REV expression in the epidermal cells marked by arrowheads in (D) and a corresponding absence or weak level of expression in (C). Similar colored arrowheads mark the same cells tracked over 15 hr. (E and F) Magnified views of the surface of i1, outlined by dotted rectangles in (A and B) showing expression pattern of REV-2 ×YPet (red), KAN1−2 × GFP (green) and PIN1-CFP (blue) before (E) and 15 hr after the combined application of 5 mM NAA and 100 μM NPA (F). Note the presence of REV in the cells marked by arrowheads in (F) and their absence in (E). Similar colored arrowheads mark the same cells tracked over 15 hr in (E and F). (G and H) Same as (E and F) but showing REV and KAN1 expression only. Note the presence of a gap between REV and KAN1 expression in (G) but its absence in (H), marked by white arrowheads in (G and H). (I–L) Confocal projections of IMs showing expression of REV-2 ×YPet (red), KAN1−2 × GFP (green) and PIN1-CFP (blue) before (I) and 48 hr after the combined application of 5 mM NAA and 100 μM NPA (J), and before (K) and 24 hr after treatment with mock solution (L). Initially for both control and treated meristems, KAN1 expression is absent between the meristem center and P1 (blue arrowheads), i1 (white arrowheads) and i2 (yellow arrowheads) (I and K). Under mock treatment, KAN1 expression appears in all three corresponding regions (marked by the same arrowheads) 24 hr later (L). However for the meristem treated with NAA and NPA, KAN1 expression is absent in regions previously corresponding to i1 (white arrowheads) and i2 (yellow arrowheads) but not P1 (blue arrowheads), even after 48 hr (J). Scale bars 20 μm (A–D, I–L) and 10 μm (E–H).


