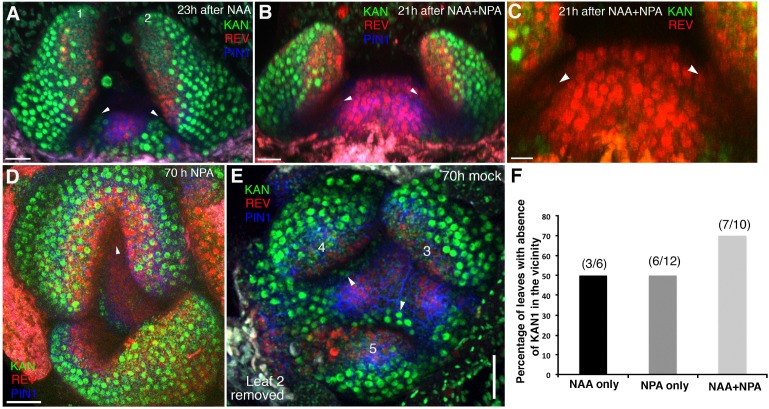
Figure 11. High auxin levels prevent new KAN1 expression in the leaf axils.
(A–E) Confocal projection of the VM showing expression pattern of REV-2 × YPet (red), KAN1−2 × GFP (green) and PIN1-CFP (blue) 23 hr after the treatment with 5 mM NAA (A), 21 hr after combined treatment with NAA and NPA (B and C); panel (C) showing close-up view of the meristem in (B) with REV (red) and KAN (green) expression only, 70 hr after treatment with NPA alone (D) and 70 hr after treatment with mock (E). White arrowheads mark the presence of KAN1 expression in the cells adjacent to the grown out leaves in (A) and (E) and absence in (B–D). Note that REV expression (red) expanded towards leaves axils in (B–D). However also note that REV expression appears faint in the leaf axils in (B and C) compared to (D). This is due to the reason that the combined application of NAA and NPA resulted in the leaves growing at an acute angle to the meristem, which caused shading and made it difficult to reach leaf axils while imaging. (F) A bar graph showing percentages of leaves lacking KAN1 expression in their vicinity upon treatment with NAA, NPA and NAA + NPA. Scale bars 20 μm (A and B), 10 μm in (C) and 30 μm (D and E).

