. 2017 Sep 12;6:e28409. doi: 10.7554/eLife.28409

Figure 1. An intragenic suppressor screen for mutations that disrupt the lethality induced by Syt1C2BD1,2N or Syt1C2BD3,4N expression.

(A) View of key residues in the Syt1 C2B Ca2+ binding pocket. The Ca2+ binding loops 1 and 3 are highlighted in blue, the negatively charged Ca2+-binding residues in green, and Ca2+ ions in red. Neuronal overexpression of Syt1C2BD416,D418N (D1,2N) or Syt1C2BD356,D362N (D3,4N) results in pharate adult lethality. (B) Representative evoked excitatory junctional currents (eEJCs) recorded in 0.2 mM extracellular Ca2+ in control white larvae (black trace), elavC155-GAL4; UAS-Syt1 wildtype (OE WT SYT, blue trace) and elavC155-GAL4; UAS-Syt1C2BD1,2N (OE D1,2N SYT, magenta trace). (C) Quantification of mean eEJC amplitude in the indicated genotypes: control, 116.0 ± 8.7 nA, n = 27; OE WT Syt1, 95.0 ± 9.4 nA, n = 24; OE D1,2N Syt1, 15.9 ± 3.5 nA, n = 10. (D) Representative postsynaptic current recordings of spontaneous release in the indicated genotypes. (E) Quantification of average mini frequency for the indicated genotypes: control, 2.6 ± 0.3 Hz, n = 19; OE WT Syt1, 2.7 ± 0.5 Hz, n = 9; OE D1, 2N Syt1, 5.7 ± 0.8 Hz, n = 15. (F) Crossing scheme used for EMS screening of suppressors of Syt1C2BD1,2N or D3,4N-induced lethality. (G) Location of identified suppressors (point mutant - yellow asterisks, stop codon - white asterisks, deletion - grey asterisks) on the Syt1 secondary structure. C2A is indicated blue and C2B in magenta. (H) View of identified point mutant alleles (yellow) in the DSyt1 homology model. For all remaining structural images, the C2A domain is colored blue and the C2B domain is colored magenta, while the Ca2+ binding loops are highlighted in green. (I) Suppressor point mutants (yellow) located in a space-filling model of DSyt1. (J) Suppressor mutations (yellow) located on the opposite face of the DSyt1 structure compared to panel I. Statistical significance was determined using one-way ANOVA (nonparametric) with post hoc Sidak’s multiple comparisons test. N.S. = no significant change, *p<0.05, **p<0.01, ***p≤0.0005, ****p<0.0001. All error bars are standard error of the mean (SEM).

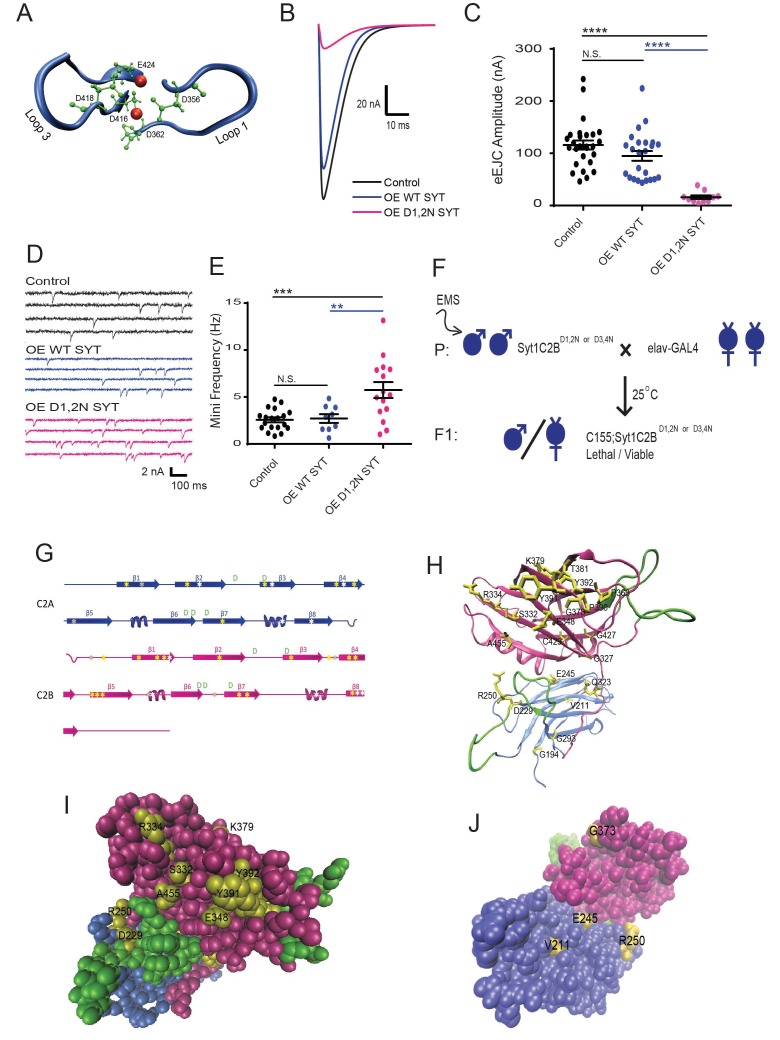
Figure 1—source data 1. Sample size (n), mean, SEM, and One-way Anova (and nonparametric) Sidak's multiple comparisons test are presented for the data in Figure 1C and Figure 2C,G,K,O.
DOI: 10.7554/eLife.28409.004
Figure 1—source data 2. Sample size (n), mean, SEM, and One-way Anova (and nonparametric) Sidak's multiple comparisons test are presented for the data in Figure 1E and Figure 2D,H,L and P.
DOI: 10.7554/eLife.28409.005
Figure 1—source data 3. Sample size (n), mean, SEM, and Student's t test are presented for the data in Figure 1—figure supplement 1B, C and E.
DOI: 10.7554/eLife.28409.006

Figure 1.

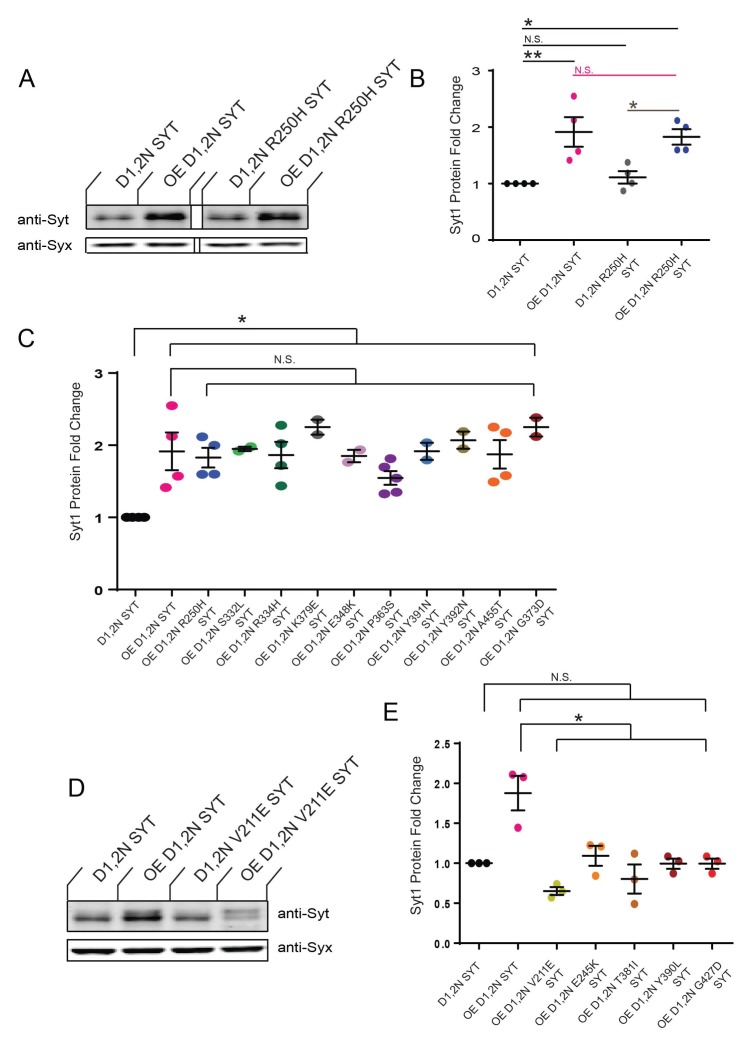
Figure 1—figure supplement 1. Summary of Western analysis of Syt1 alleles that suppress lethality following overexpression of Syt1C2BD1,2N or Syt1C2BD3,4N.

Figure 1—figure supplement 1.

(A) Western of overexpressed Syt1 mutant proteins in head extracts of elavC155-GAL4; UAS-Syt1C2BD1,2N/+ (OE D1,2N SYT), control UAS-Syt1C2BD1,2N/+without a driver (D1,2N SYT), elavC155-GAL4; UAS-Syt1C2BD1,2N R250H (OE D1,2N R250H SYT) and control UAS-Syt1C2BD1,2N R250H/+without a driver (D1,2N R250H SYT. The top panel shows anti-Syt1 immunoreactivity, while the bottom panel shows anti-Syntaxin (anti-Syx) immunoreactivity as a loading control. Note the overexpressed R250H protein is stable and not degraded. (B) Quantification of fold-change of Syt1 protein expression in the indicated genotypes normalized to control UAS-Syt1C2BD1,2N/+without a driver (D1,2N SYT) and the loading control (anti-Syx). The following genotypes were tested: OE D1,2N SYT, 1.9 ± 0.3 (n = 4); D1,2N R250H SYT, 1.1 ± 0.1 (n = 4); OE D1,2N R250H SYT, 1.8 ± 0.1 (n = 4). (C) Quantification of fold change for Syt1 expression for the indicated genotypes that show stable overexpression. Protein levels were normalized as indicated above. The following genotypes were tested: OE D1,2N SYT, 1.9 ± 0.3 (n = 4); OE D1,2N R250H SYT, 1.8 ± 0.1 (n = 4); OE D1,2N S332L SYT, 1.9 ± 0.03 (n = 2); OE D1,2N R334H SYT, 1.9 ± 0.1 (n = 3); OE D1,2N K379E SYT, 2.3 ± 0.1 (n = 2); OE D1,2N E348K SYT, 1.9 ± 0.1 (n = 2); OE D1,2N P363S SYT, 1.5 ± 0.1 (n = 3); OE D1,2N Y391N SYT, 1.9 ± 0.1 (n = 2); OE D1,2N Y392N SYT, 2.1 ± 0.1 (n = 2); OE D1,2N A455T SYT, 1.9 ± 0.2 (n = 4); OE D1,2N G373D SYT, 2.3 ± 0.1 (n = 2). (D) Western of overexpressed Syt1 mutant proteins in head extracts of elavC155-GAL4; UAS-Syt1C2BD1,2N/+ (OE D1,2N SYT), control UAS-Syt1C2BD1,2N/+without a driver (D1,2N SYT), elavC155-GAL4; UAS-Syt1C2BD1,2N V211E (OE D1,2N V211E SYT) and control UAS-Syt1C2BD1,2N V211E/+without a driver (D1,2N V211E SYT). The top panel shows anti-Syt1 immunoreactivity, while the bottom panel shows anti-Syntaxin (anti-Syx) immunoreactivity as a loading control. Note the overexpressed V211E protein is degraded, and only the endogenous Syt1 protein is still detected. (E) Quantification of fold change for Syt1 expression for the indicated genotypes that fail to show stable overexpression. Protein levels were normalized as indicated above. The following genotypes were tested: OE D1,2N SYT, 1.9 ± 0.2 (n = 3); OE D1,2N V211E SYT, 0.7 ± 0.05 (n = 3); OE D1,2N E245K SYT, 1.1 ± 0.1 (n = 3);= OE D1,2N T381I SYT, 0.8 ± 0.2 (n = 3); OE D1,2N Y390L SYT, 1.0 ± 0.1 (n = 3); OE D1,2N G427D SYT, 0.7 ± 0.04 (n = 3). For panels B-C and E, statistical significance was determined using one-way ANOVA (nonparametric) with post hoc Sidak’s multiple comparisons test. N.S. = no significant change (p>0.05), *p<0.05, **p<0.01 Error bars represent SEM.