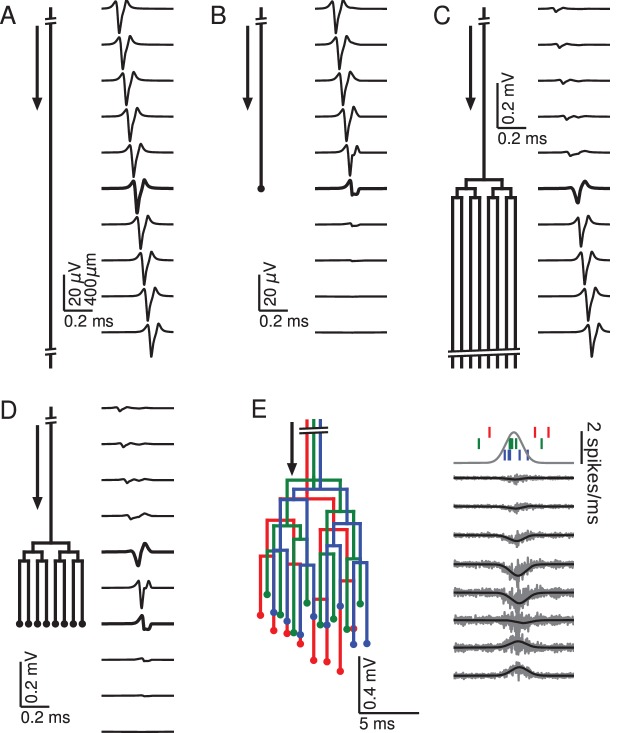
Figure 1. Relationship between axon morphology and extracellular potential.
Multi-compartment simulations of action potentials traveling along axons with varying morphologies, as indicated by the diagram on the left-hand side of each subfigure. Action potential propagation direction indicated by arrow. Waveforms, shown on the right-hand side of each subfigure, were recorded at a horizontal distance of 150 µm from the axons. The vertical depth is indicated by the plot position, spaced by 400 µm. Horizontal plot location and distances between axons are for illustration only, all axons were simulated to lie on a straight line. (A) Action potential in a quasi-infinitely long, straight axon. (B) Terminating axon. Action potential waveform closest to the termination thickened for emphasis. (C) Branching axon. The axon branches multiple times within of 200 µm. Thicker waveform at the center of the bifurcation zone. (D) Combined bifurcations and terminations. Note the larger voltage scales in C and D, which correspond to the different number of fibers. (E) Response in a population of 100 randomized morphologies, three of which are shown schematically (colored). Activity consists of spontaneous background activity (100 spikes/s) superimposed with a brief Gaussian pulse of heightened spike rate (2000 spikes/s). Spike rate and example spike times for the three morphologies are shown at the top. Right: gray lines show activity of full population averaged over 40 trials, while the black lines show the low-pass (<1 kHz) component. Note that the time and voltage scales are different from A-D. In all graphs, spatial scales are the same, as indicated by the scale bar in A.

