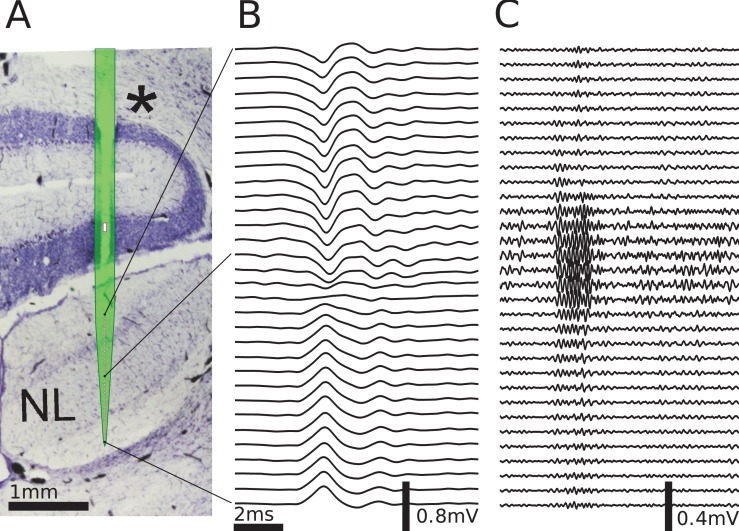
Figure 4. Multielectrode recordings in the barn owl show dipolar axonal EFPs.
(A) Photomicrograph of a 40 µm thick transverse Nissl stained section through the dorsal brainstem, containing a superimposed, to scale, diagram of the multielectrode probe. The probe produced a small slit in a cerebellar folium overlying the IVth ventricle (*), and penetrated into the nucleus laminaris (NL). The recordings were made in NL, and electrodes extended to both sides of the nucleus. The outline of the probe is shown in light green, with the recording electrodes indicated by magenta dots, and the reference electrode as a magenta rectangle. The low-frequency (<1 kHz) component (B) and the high-frequency (>2.5 kHz) component (C) are ordered in the same way as the electrodes, with three examples connected to their recording sites by black lines. The time scales in B and C are identical (indicated by scale bar). Traces were averaged over 10 repetitions. Voltage scales are indicated by individual scale bars.

