Abstract
Skeletal muscle is a key organ in energy homeostasis owing to its high requirement for nutrients. Heterotrimeric G proteins converge signals from cell-surface receptors to potentiate or blunt responses against environmental changes. Here, we show that muscle-specific ablation of Gα13 in mice promotes reprogramming of myofibers to the oxidative type, with resultant increases in mitochondrial biogenesis and cellular respiration. Mechanistically, Gα13 and its downstream effector RhoA suppressed nuclear factor of activated T cells 1 (NFATc1), a chief regulator of myofiber conversion, by increasing Rho-associated kinase 2–mediated (Rock2-mediated) phosphorylation at Ser243. Ser243 phosphorylation of NFATc1 was reduced after exercise, but was higher in obese animals. Consequently, Gα13 ablation in muscles enhanced whole-body energy metabolism and increased insulin sensitivity, thus affording protection from diet-induced obesity and hepatic steatosis. Our results define Gα13 as a switch regulator of myofiber reprogramming, implying that modulations of Gα13 and its downstream effectors in skeletal muscle are a potential therapeutic approach to treating metabolic diseases.
Keywords: Metabolism, Muscle Biology
Keywords: Diabetes, G-proteins, Obesity
Introduction
Skeletal muscle is a major contributor to systemic energy homeostasis because of its large mass relative to other tissues and its high rate of fuel consumption. Mammalian skeletal muscles are composed of a mixture of oxidative and nonoxidative myofiber types. They differ with respect to their metabolic properties and are interconvertible. Reprogramming of myofiber types alters overall metabolic capacity; endurance exercise training is linked to an increase in oxidative fibers, along with mitochondrial respiration and fatty acid oxidation (1). In contrast, individuals suffering from obesity or type 2 diabetes mellitus have fewer oxidative myofibers (2–5). Hence, identifying the molecules or components responsible for reprogramming the myofiber phenotype can have a profound impact on the understanding of muscle dysfunction and the consequent pathophysiology of metabolic diseases.
Studies using transgenic mice (6–8) or pharmacological agents (9, 10) have ignited interest in developing exercise mimetics. As a result, mice ectopically overexpressing certain proteins (e.g., PGC1α) have been reported to have an endurance skeletal muscle phenotype, although many of them conversely exhibit increased adiposity with insulin resistance on a whole-body level (7, 11). Previous identification of exercise-mimetic regulators mainly focused on intrinsic triggers such as ATP turnover and redox balance. However, the vast majority of signals come from outside the cell. In addition to the numerous exogenous stimuli introduced into the bloodstream, many endogenous ligands are secreted from other organs such as the gut, liver, adipose tissue, and brain. Signaling molecule levels fluctuate respectively, and each of them binds to specific receptor(s) to transmit a mixture of cell-surface signals. Therefore, it is crucial to identify the signaling node that converts the external environmental changes to cellular metabolic control.
Myofibers may recognize environmental changes through cell-surface receptors and reprogram the fiber type. Many different G protein–coupled receptors (GPCRs), which represent the largest (~800) group of receptors, recognize a mixture of external molecules (12). Although GPCRs and their downstream pathways have been studied in various indications, with regard to mimicking exercise, a single receptor is unlikely to bring about the myriad metabolic adaptations and the consequent benefits. Heterotrimeric G proteins (Gα, Gβ, and Gγ subunits) reside at the intracellular side to propagate GPCR signaling. Of these, only Gα proteins directly bind to the GPCRs and serve as a major signal switch through distinct downstream effectors (13). Despite the size and diversity, GPCRs interact with a relatively small number of Gα proteins to initiate intracellular signaling cascades (14); only 16 genes encode Gα proteins, which implies the crucial nature of the Gα protein as a molecular bottleneck of signal transduction, potentiating or blunting downstream biological responses to environmental changes. Therefore, discovering the specific Gα protein(s) and the underlying molecular cascade is crucial to unraveling the physiology of muscle fiber remodeling.
Among Gα proteins, we focused on Gα13 because of its expressional predominance in skeletal muscle. The role of Gα13 in regulating skeletal muscle function is scarcely known. Studies investigating Gα13 have been limited, because mice with the gene KO are embryo lethal (15). We generated skeletal muscle–specific Gα13 KO (Gα13-MKO) mice, with the aim of understanding the role of Gα13 in muscle phenotype and function and of finding the muscle-type switch that regulates energy metabolism. We report here that ablation of Gα13 drives exercise-mimetic reprogramming of skeletal muscles and identify Gα13 as a metabolic switch. This study also reveals Rock2-mediated inhibitory phosphorylation of NFATc1 (p-NFATc1) as the underlying molecular basis. Furthermore, our results show that Gα13 deficiency in muscle improves systemic energy homeostasis, with an increased fatty acid and glucose turnover that is most likely attributable to the reprogramming of skeletal muscle to the oxidative type.
Results
Gα13 expression is coupled with metabolic alterations in skeletal muscle.
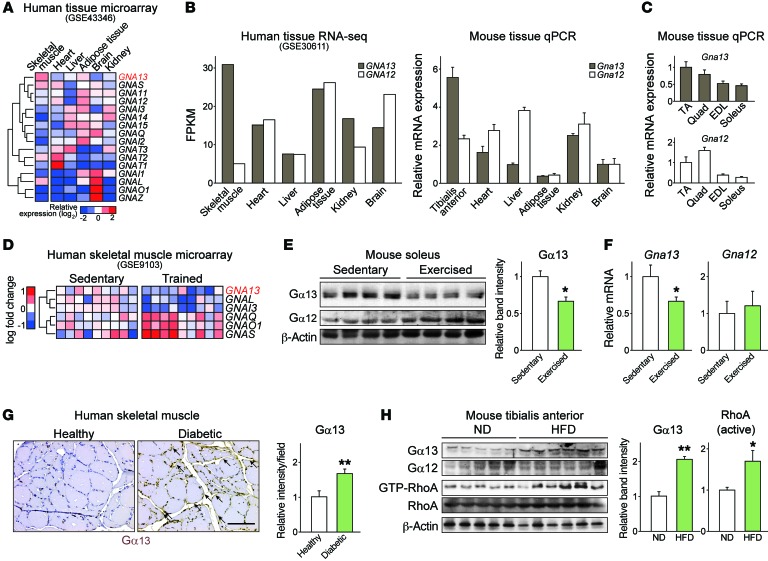
In an effort to find the metabolic Gα protein switch in skeletal muscle, we first analyzed the gene expression profiles of human tissues (NCBI Gene Expression Omnibus [GEO] database accession no. GSE43346) (16). This analysis revealed GNA13 (encoding Gα13) to be one of the genes predominantly expressed in muscles compared with its expression in other highly metabolically active organs (Figure 1A). GNA12 (encoding Gα12), despite its sequence homology with GNA13, did not show this specific distribution. In an RNA-sequencing (RNA-seq) data set (GEO GSE30611), only skeletal muscle showed a distinct predominance of Gα13 over Gα12 in human tissues. In the mouse, quantitative PCR (qPCR) analysis of representative tissues also showed skeletal muscle–dominant expression of Gna13 (Figure 1B). Among different skeletal muscle tissues, those with a lower oxidative capacity (e.g., tibialis anterior and quadriceps) mostly showed higher expression of GNA13 and GNA12 compared with expression levels in highly oxidative muscle such as the soleus (Figure 1C). Next, we tested whether Gα13 levels in skeletal muscle are altered under different metabolic conditions. Microarray analysis (GSE9103) (17) showed GNA13 downregulation in an exercise-induced state of energy depletion (Figure 1D), which was confirmed in mice forced to run until exhaustion (Figure 1, E and F). In contrast, Gα13 levels were higher in the skeletal muscle of a patient with type 2 diabetes than in that of a healthy individual (Figure 1G). Consistent with these results, Gα13 levels in muscle were elevated in obese mice fed a high-fat diet (HFD), with concomitant activation of downstream effector RhoA (Figure 1H and Supplemental Figure 1; supplemental material available online with this article; https://doi.org/10.1172/JCI92067DS1).
Figure 1. Skeletal muscle Gα13 expression correlates with metabolic alterations.
(A) Tissue distribution of Gα (GNA) subunits in microarray and RNA-seq experiments using human tissues. The data were extracted from GEO GSE10347 and GSE30611. FPKM, fragments per kilobase of transcript per million mapped reads. (B and C) qPCR analysis of Gα13 in mouse tissues. C57BL/6 mice were fasted overnight prior to sacrifice (n = 3 each). Different sets of mice were used in B and C. TA, tibialis anterior; EDL, extensor digitorum longus; Quad, quadriceps. (D) Relative expression of Gα subunits in human quadriceps before or after exercise. Data were extracted from GEO GSE9103. (E and F) Levels of Gα13 protein (E) and transcripts (F) in soleus muscle before and 4 hours after 1 hour of exercise (n = 4 each). (G) Immunostaining for Gα13 in skeletal muscles of a healthy volunteer and a diabetic patient. Scale bar: 100 μm. (H) Immunoblots for Gα13 and GTP-bound RhoA in tibialis anterior muscles from mice fed a normal diet (ND) or a HFD for 13 weeks (n = 5–6 each). For E and H, each blot was obtained from samples run on parallel gels. For B, C, and E–H, data represent the mean ± SEM. *P < 0.05 and **P < 0.01, by Student’s t test.
Ablation of Gα13 reprograms myofiber types toward the oxidative phenotype.
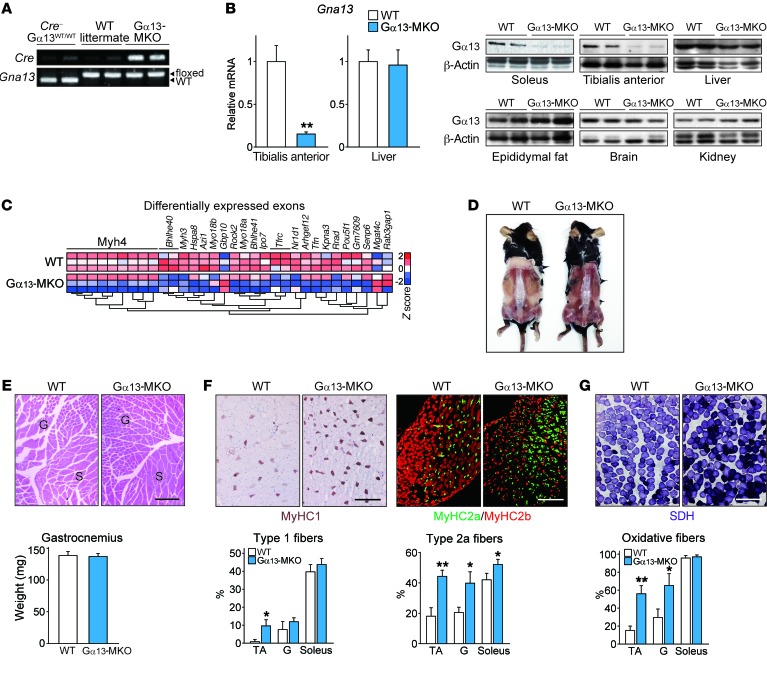
To define the role of Gα13 in skeletal muscle physiology, we deleted Gα13 in a myocyte-specific manner using Gna13fl/fl Ckmm-Cre mice (hereafter referred to as Gα13-MKO mice). As flanking Gα13 with loxP sites had no effect on Gα13 expression or on other phenotypes, WT littermates carrying only Gna13fl/fl with no detectable Cre gene were used as controls (Figure 2, A and B). The Gα13-MKO mice were born at Mendelian frequencies and survived more than 1 year, without apparent gross abnormalities. We then examined global RNA expression in muscles of Gα13-MKO and WT mice using exon microarrays (Figure 2C and Supplemental Table 1). Expression of exons comprising Myh4, a molecular marker of type 2b nonoxidative myofiber, was mostly downregulated in Gα13-MKO mice, whereas other genes associated with lipid and/or glucose metabolism and muscle contraction were also affected by Gα13 KO (Supplemental Table 1). These changes were confirmed by qPCR assays, as shown by significantly lower Myh4 expression, along with correspondingly higher levels of Myh7 and Myh2 (type 1 and 2a oxidative myofiber markers, respectively), implying that changes in myofibers to a more oxidative phenotype by Gα13 KO had occurred (Supplemental Figure 2A). Consistently, muscles of the KO strain were redder from a gross morphological perspective, indicative of the characteristics of oxidative muscle (Figure 2D and Supplemental Figure 2B). The size of individual myofibers and the weight of isolated muscles were comparable between the KO and WT mice (Figure 2E). Immunohistological examination showed a dramatic increase in myosin heavy chain isoforms of type 1 and 2a oxidative fibers in the tibialis anterior, with a corresponding decrease in the population of type 2b fibers upon Gα13 ablation (Figure 2F). Increases in oxidative myofibers by succinate dehydrogenase (SDH) activity staining also confirmed this finding (Figure 2G). The myofiber type conversion also occurred in gastrocnemius and soleus muscles.
Figure 2. Loss of Gα13 causes a skeletal muscle switch to the oxidative phenotype.
(A) PCR analysis using tail genomic DNA from WT C57BL/6 mice, WT littermates (Gna13fl/fl), and Gα13-MKO (Ckmm-Cre+ Gna13fl/fl) mice. (B) qPCR analyses of 3 samples each and immunoblots for Gα13 in the indicated tissues. Twelve-week-old mice were fasted overnight prior to sacrifice. (C) Global gene expression analysis. RNA was isolated from soleus muscles from mice of the indicated genotypes and hybridized to Affymetrix exon arrays. (D) Dorsal view of skinned WT and Gα13-MKO mice 35 weeks after birth. Enhanced larger images are shown in Supplemental Figure 1B. (E) H&E staining and wet weight of hind limb muscles. G, gastrocnemius; S, soleus. (F) Representative immunohistochemical images of tibialis anterior muscles from 12-week-old WT or Gα13-MKO mice using specific antibodies for each of the fiber types (n = 3). Myofiber types in the indicated tissues were quantified. (G) Representative histochemical staining of SDH enzymatic activity in tibialis anterior muscles (n = 3–4 per genotype). Myofibers with high SDH activity were quantified. Scale bars: 200 μm (E–G). For B and E–G, data represent the mean ± SEM. *P < 0.05 and **P < 0.01, by Student’s t test. G, gastrocnemius.
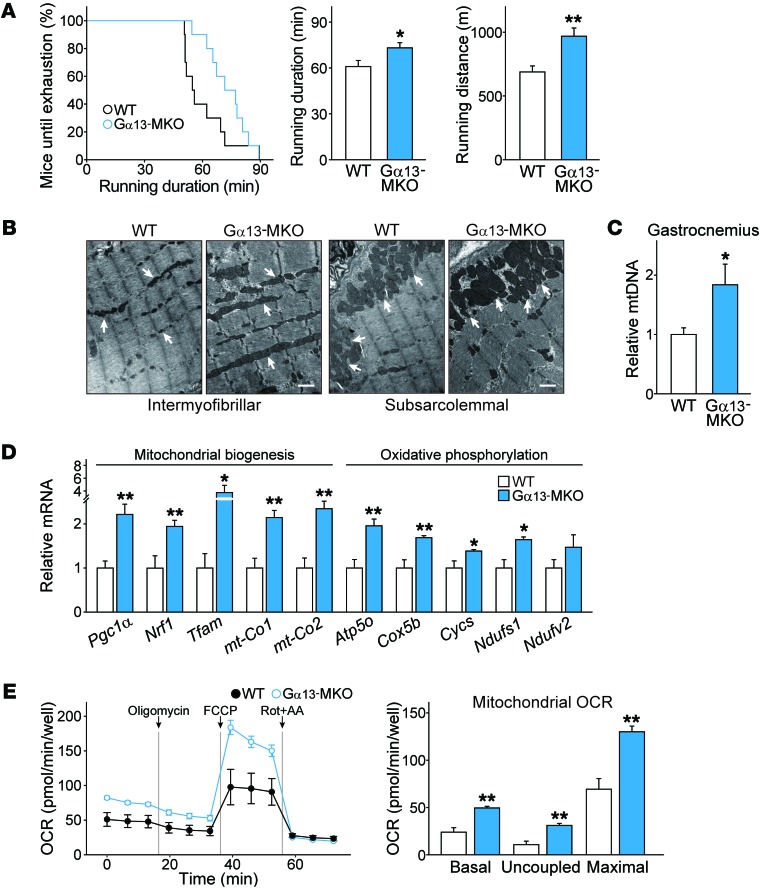
Muscles composed of more oxidative fibers confer higher fatigue resistance. Gα13-MKO mice displayed significantly greater endurance than did WT mice, even without prior training, as indicated by 20% and 30% longer running times and distance, respectively (Figure 3A). Electron microscopic analysis of skeletal muscles from Gα13-MKO mice showed larger and denser mitochondria in the intermyofibrillar and subsarcolemmal regions (Figure 3B). The mitochondrial population in the intermyofibrillar regions was also higher. Consistent with these findings, mitochondrial DNA content in gastrocnemius muscle was 2-fold higher (Figure 3C). We also found that transcript levels of genes associated with mitochondrial biogenesis and oxidative phosphorylation were all higher in Gα13-MKO mice (Figure 3D).
Figure 3. Loss of Gα13 results in higher endurance exercise capacity and mitochondrial function.
(A) Endurance capacity of Gα13-MKO mice compared with that of WT mice. Percentage of mice running until exhaustion and maximum running duration and distance in endurance exercise tests (n = 10 per genotype). (B) Transmission electron micrographs of longitudinal sections of soleus muscle. Arrows point to mitochondria. Scale bars: 1 μm. (C) Quantification of mitochondrial DNA (mtDNA) content (n = 3 each). The copy number ratio of mitochondrial/nuclear DNA was measured by qPCR analysis for Mt-co2 and Nrip1 using total DNA isolated from gastrocnemius muscles. (D) qPCR assays. Tibialis anterior muscles were prepared from mice that had been fasted overnight (n = 6–8 each). (E) Respiration assay. The OCR of primary satellite cell–derived myotubes from mice of each genotype. The OCRs of basal, uncoupled (by addition of oligomycin), maximal (with FCCP), and nonmitochondrial respiration (with rotenone plus antimycin A [Rot+AA]) were determined using an XFp Extracellular Flux Analyzer. Real-time triplicate readings (left) and calculated mitochondrial respiration rates (right) are shown (n = 3 each). For A and C–E, data represent the mean ± SEM. *P < 0.05 and **P < 0.01, by Student’s t test.
We measured cellular oxygen consumption rates (OCRs) as a functional assay of mitochondrial fuel consumption. To rule out the possible contribution of nonparenchymal cells present in the muscle tissue (e.g., endothelial cells, adipocytes, fibroblasts, and immune cells) to this function, primary satellite cells were isolated from hind limb muscles and fully differentiated into myotubes prior to the assay (Supplemental Figure 3A). The cells from Gα13-MKO muscles did not express Gα13 seven days after differentiation and had no abnormalities in growth or fusion patterns (Supplemental Figure 3, B and C). The cells from Gα13-MKO mice indeed had a more oxidative metabolic phenotype after differentiation, as indicated by the transcription pattern of genes involved in energy metabolism (Supplemental Figure 3D). Moreover, myotubes deficient in Gα13 exhibited 2-fold increases in the rates of basal, uncoupled, and maximal oxygen consumption (Figure 3E). Although studies have been using primary myotubes and C2C12 myotubes as surrogate systems to examine fiber type conversion in vitro (18, 19), primary myotubes express lower levels of adult myosin heavy chain isoforms than do intact muscles. The results thus suggest that Gα13 not only regulates myosin expression but also promotes oxidative metabolism, which may represent the events accompanied by fiber type conversion. Differences in body temperature in the basal state or during exposure to cold temperatures were negligible between the 2 genotypes (Supplemental Figure 4).
Our results showed that basal Gα13 levels in cardiac muscle were much lower than those in skeletal muscle (Figure 1, A and B). A secondary decrease in Gα13 was observed in the heart muscles of Gα13-MKO mice, but this change was marginal as compared with that observed in skeletal muscle (Supplemental Figure 5A). In addition to the comparable heart–to–body weight ratios, histological assessment revealed no apparent signs of cardiac hypertrophy or other defects (Supplemental Figure 5, B and C). Consistently, transcript levels of the genes representing mitochondrial biogenesis and oxidative phosphorylation showed no differences between WT and Gα13-MKO mice (Supplemental Figure 5D). Thus, skeletal muscle–specific deletion of Gα13 using Ckmm-Cre seemed to have a minimal effect on cardiac muscle phenotype and function. These results confirm that loss of Gα13 leads to an increase in oxidative myofibers, thereby enhancing exercise performance and oxidative capacity in skeletal muscle.
Gα13 inhibits NFATc1 activity and regulates muscle oxidative capacity.
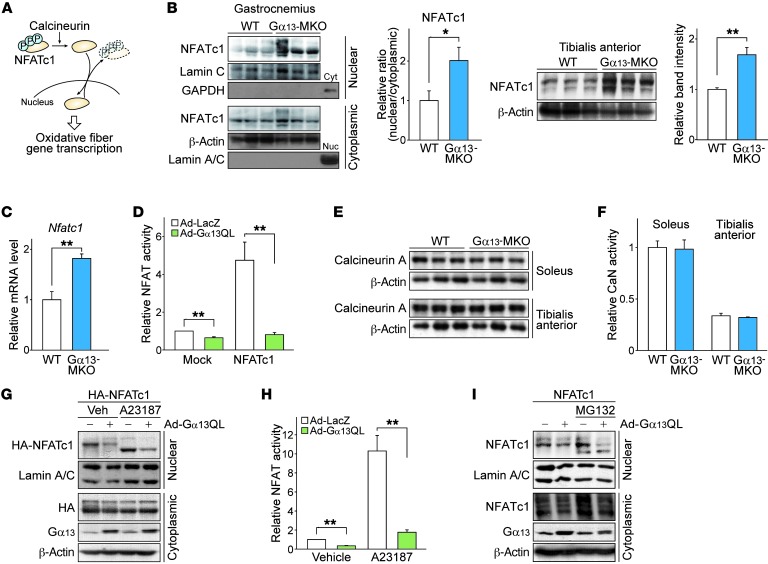
Nuclear factor of activated T cells 1 (NFATc1) signaling is necessary and sufficient to transform fibers into oxidative type fibers (20–22). Therefore, we narrowed our focus to NFATc1 as a potential primary regulator of the phenotype transition resulting from Gα13 ablation. Intracellular localization determines NFATc1 activity and is tightly controlled by its phosphorylation status (Figure 4A). In Gα13-MKO muscles, nuclear NFATc1 was significantly higher, indicative of Gα13 as a negative regulator of NFATc1 (Figure 4B, left). Total NFATc1 content was also higher in KO muscles, presumably as a result of autoinduction (Figure 4B, right), a distinct feature of NFATc1 among different NFAT isoforms (23), since mRNA expression was also higher in the KO muscles (Figure 4C). To confirm the effect of Gα13 on NFATc1 activity more directly, we performed reporter assays using a luciferase construct with a concatemerized (3 copies) high-affinity NFAT-binding site. In contrast to the activation of NFATc3 by Gα13 in fibroblasts (24), adenoviral infection of myotubes with a constitutively active Gα13 (Q229L mutant, hereafter referred to as Gα13QL) robustly inhibited the basal luciferase activity as well as that enhanced by ectopically overexpressed NFATc1 (Figure 4D). Among NFAT proteins, NFATc1 is the predominant isoform expressed in adult skeletal muscle (22, 25). So, it is conceivable that alterations in NFATc1 mainly contribute to overall NFAT activity downstream of Gα13.
Figure 4. Gα13 signaling inhibits NFATc1 independently of calcineurin.
(A) Schematic diagram of the NFATc1 signaling pathway. Translocation is controlled by (de)phosphorylation at multiple sites. Nuclear NFATc1 mediates the oxidative conversion of myofibers. (B and C) Effect of Gα13 on intracellular localization and total expression levels of NFATc1 (n = 3 each). (B) Left: Immunoblot for NFATc1 in mouse gastrocnemius muscle. Mice were fasted overnight, before sacrifice. Nuc, nuclear fraction; Cyt, cytoplasmic fraction. Right: Immunoblot for NFATc1 in the total lysate of mouse tibialis anterior muscle. (C) Nfatc1 transcript levels in tibialis anterior muscle. (D) NFATc1 transcriptional activity assays (n = 3 each). A luciferase reporter construct with 3 NFAT binding sites upstream of a transcription start site was transfected into C2C12 myotubes with NFATc1-expressing or control vector. Myotubes were then infected with adenovirus expressing the indicated genes, and luciferase activity was assayed 48 hours later. Gα13QL, a CA Q229L mutant of Gα13. (E) Immunoblots for calcineurin A in the indicated skeletal muscles from mice fasted overnight. (F) Calcineurin (CaN) phosphatase activity was measured using an RII substrate peptide on the same skeletal muscles as in E. The relative activity represents the difference between total phosphatase activity and that in the presence of EGTA, as normalized by protein content in the lysates. (G and H) Immunoblotting (G) and transcriptional activity assays (H) for NFATc1. C2C12 myotubes were transfected with HA-tagged NFATc1 expression vector, followed by adenoviral infection of LacZ or Gα13QL. Vehicle (Veh) or A23187 was added 12 hours before the assay. (I) Immunoblots for NFATc1. After adenoviral infection, C2C12 myotubes were treated with MG132 (10 μM) for 12 hours. Ad, adenovirus. For B, G, and I, each blot was obtained from samples run on parallel gels. For B–D, F, and H, data represent the mean ± SEM. *P < 0.05 and **P < 0.01, by Student’s t test.
Additionally, Gα13 gene KO changed neither the expression levels of calcineurin, a direct upstream regulator of NFATc1, nor its catalytic activity (Figure 4, E and F). Nonetheless, Gα13QL robustly inhibited nuclear localization of NFATc1 and, thereby, its transcriptional activity (Figure 4, G and H). This event also occurred in the presence of A23187, a calcium ionophore (i.e., enforced calcium influx), further supporting the contention that Gα13 regulates NFATc1 independently of the change in intracellular calcium signaling. Moreover, the possibility that Gα13 signaling facilitates NFATc1 degradation, thereby lowering nuclear levels, was ruled out, since treatment with a proteasome inhibitor had no effect on nuclear NFATc1 levels (Figure 4I).
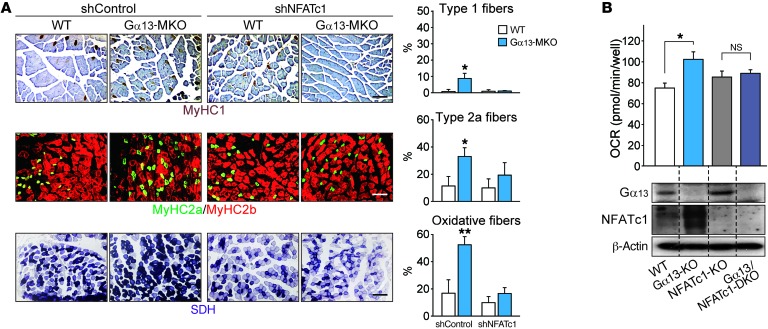
To test whether NFATc1 mediates Gα13-induced myosin heavy chain conversion and fiber-type specification, we used an electroporation-based gene transfer technique to deliver NFATc1 shRNA in vivo. As reported in previous studies (26), the plasmids encoding shRNA and GFP together were readily transfected, regardless of myofiber types, without affecting fiber type distribution (Supplemental Figure 6). Two weeks after electroporation, NFATc1 shRNA abrogated the effect of Gα13 KO on the myofiber type switch, as indicated by changes in myosin heavy chain isoform composition and oxidative metabolism (Figure 5A). More important, enhancement of the OCR, which was achieved by CRISPR-mediated deletion of Gα13 (27), was blunted by ablation of NFATc1 (Figure 5B). Our results show that Gα13-mediated myofiber type conversion depends on NFATc1.
Figure 5. NFATc1 mediates the oxidative conversion of myofibers by Gα13 ablation.
(A) Immunostain images for myosin heavy chains and histochemical assays for SDH activity of tibialis anterior muscles 14 days after electroporation-mediated gene delivery. Each mouse of the indicated genotype received a control shRNA vector in 1 limb and a plasmid expressing shNFATc1 in the contralateral limb. Type 1 and 2a myofibers and those with high SDH activity were quantified. Scale bars: 200 μm. (B) Respiration assay and immunoblots. Basal OCRs were determined in C2C12 myotubes of the indicated genotypes, which were prepared by CRISPR-mediated gene editing (n = 3 each). Blots were obtained from samples run on parallel gels. DKO, double-KO. All data represent the mean ± SEM. *P < 0.05 and **P < 0.01, by Student’s t test.
NFATc1 physically associates with Rock2 downstream of Gα13.
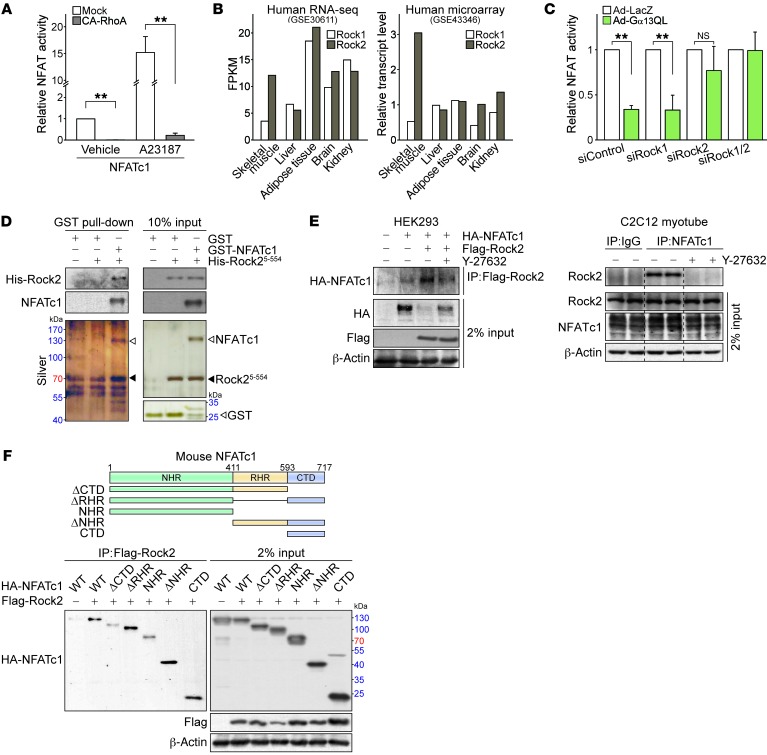
Intriguingly, we found that a constitutively active (CA) Q63L mutant of RhoA, the primary node in the canonical Gα13 pathway, exerted the same effect as Gα13QL did, showing nearly complete inhibition of NFATc1 (Figure 6A). Rho-associated kinases (i.e., Rock1 and Rock2) are key downstream effectors contributing to the progression of RhoA-mediated diseases (28). In humans and rodents, skeletal muscles predominantly express Rock2, but not Rock1, and show a distinct Rock isoform distribution (29). Both RNA-seq and microarray profiles confirmed the predominant expression of Rock2 in human skeletal muscles (Figure 6B). As expected, Rock2 knockdown prevented the ability of Gα13 to inhibit NFATc1, whereas Rock1 knockdown had no effect (Figure 6C). Our results indicate that Rock2 predominantly regulates NFATc1 downstream of Gα13 in skeletal muscle.
Figure 6. Rock2 associates with NFATc1 and inhibits its activity.
(A) NFATc1 transcriptional activity assays (n = 3 each). Using C2C12 myotubes, NFAT activity luciferase- and NFATc1-expressing constructs were cotransfected with CA-RhoA or a control vector. Luciferase activity was assayed 48 hours after transfection. (B) Tissue distribution of Rho kinase (Rock) isoforms in RNA-seq and microarray data obtained from human samples. The data were extracted from GEO GSE30611 and GSE43346. (C) NFATc1 transcriptional activity assays (n = 3 each). An NFATc1 activity reporter construct was transfected into C2C12 myotubes with siRNAs against Rock1 or Rock2 (or with control siRNA) for 36 hours. The cells were then infected with adenovirus encoding LacZ or Gα13QL for another 36 hours. (D) GST pull-down assays. Recombinant GST or GST-NFATc1 fusion proteins were immobilized on glutathione-agarose beads and incubated with His-tagged recombinant human Rock2 fragment (5-554 residue). Silver staining and immunoblotting was performed to assess the interaction. (E) Immunoprecipitation assays. Left: HEK293 cells were transfected with HA-tagged NFATc1 and/or Flag-tagged Rock2. Right: Untransfected C2C12 cells were differentiated for 72 hours. Y-27632 (3 μM) was added 12 hours prior to the assay. (F) Schematic representation of N-terminal HA-tagged full-length NFATc1 (WT) along with its deletion mutants. Immunoprecipitation assays for HEK293 cells transfected with the indicated NFATc1 constructs along with Flag-tagged Rock2 for 24 hours; lysates were subjected to a pull-down assay. For A and C, data represent the mean ± SEM. **P < 0.01, by Student’s t test.
To further delineate the basis of Rock2 regulation of NFATc1, we performed in vitro glutathione S-transferase (GST) pull-down assays using human recombinant proteins and found specific interaction between the active Rock2 fragment (fragment 5-554) and NFATc1 (Figure 6D). We also confirmed this using cell-based assays (Figure 6E). Rock2 was recruited to NFATc1 in immunoprecipitates, which was diminished by the Rock2 inhibitor Y-27632, suggesting that Rock2 kinase activity is critical in the interaction of Rock2 and NFATc1. Either the ectopically expressed proteins or the endogenous proteins showed physical interactions with each other in the cell. Next, we conducted systematic NFATc1 deletion experiments. Among 5 fragments of NFATc1, Rock2 bound with 2 regulatory sites of NFATc1, including the NFAT homology region (NHR) and C-terminal domain (CTD) (Figure 6F). Although all of the fragments tested bound to Rock2, the binding affinities were different. First, compared with full-length NFATc1, the binding diminished only in the fragments without the CTD (i.e., ΔCTD and NHR). Thus, CTD seemed to be responsible for the Rock2-NFATc1 interaction. However, the CTD-deleted fragments also showed weak interactions, suggesting that the NHR may have some affinity for Rock2. Rel homology region (RHR) did not affect the binding intensity, indicating that the domain does not contribute to the binding.
Rock2 directly phosphorylates NFATc1 at the Ser243 residue.
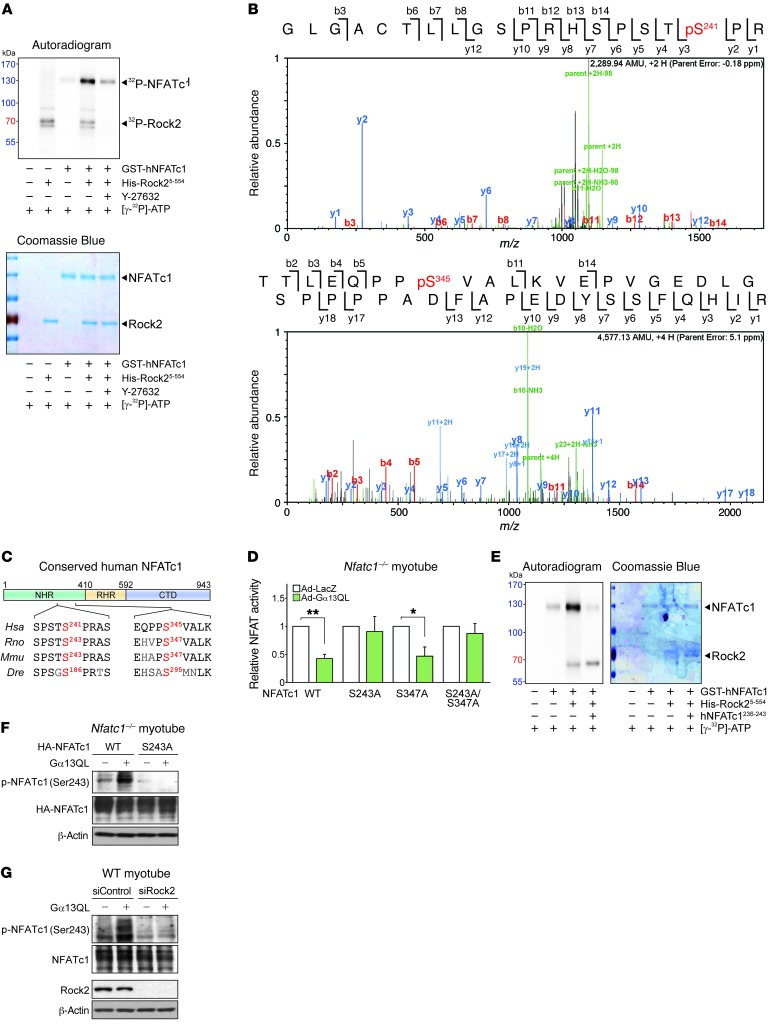
Since Rock2 is a serine-threonine kinase, we determined whether Rock2 phosphorylates NFATc1 at serine or threonine residues. NFATc1 phosphorylation was augmented by Gα13QL or CA-Rock2 (C-terminus–truncated Rock2) at serine residue(s), supporting the ability of Rock2 to phosphorylate NFATc1 downstream of Gα13 (Supplemental Figure 7A). The ability of Rock2 to phosphorylate NFATc1 was corroborated in the in vitro kinase assay. As expected, Rock2 directly phosphorylated NFATc1, which was reversed by the addition of Y-27632 to the reaction buffer (Figure 7A). We found that autophosphorylation of Rock2 was also inhibited. In order to identify specific Rock2 phosphorylation site(s), we performed liquid chromatography tandem mass spectrometry (LC-MS/MS) after in vitro phosphorylation and found that Rock2 phosphorylated human NFATc1 at Ser241 and Ser345 residues (homologous with mouse Ser243 and Ser347, respectively) (Figure 7B). Ser241 was particularly worthy of notice, because the amino acids around this residue were highly conserved across the species examined, whereas those around Ser345 were not (Figure 7C). To examine the site-specific function of the phosphorylation, we cloned constructs with a serine-to-alanine mutation of mouse NFATc1 at Ser243 and/or Ser347 and transfected them into C2C12 myoblasts. For this experiment, we used NFATc1-KO cells to eliminate artifacts of the autoinduction effect. Substituting Ser243 of NFATc1 with alanine (S243A) abolished the inhibitory effect of Gα13 on NFATc1, whereas the S347A mutation had no effect (Figure 7D). In addition, an 8-mer oligopeptide mimicking the putative target site (residues 236-243) abrogated Rock2 phosphorylation of NFATc1, without affecting the autophosphorylation of Rock2 (Figure 7E). We then verified Ser243-specific phosphorylation using a custom-made antibody (Figure 7F). The lack of band intensity amplification in NFATc1-KO C2C12 myotubes expressing S243A-NFATc1 validated the antibody specificity. To confirm Rock2 as a bona fide NFATc1 kinase, we performed a loss-of-function study using siRNA against Rock2 (Figure 7G). As expected, we found that Gα13QL failed to elicit Ser243 phosphorylation of NFATc1 in the absence of Rock2.
Figure 7. Rock2 phosphorylates NFATc1 at Ser243.
(A) In vitro kinase assay. Recombinant proteins and [γ-32P]-ATP were incubated with or without Y-27632 (10 μM), and phosphorylation was visualized by autoradiography. (B) LC-MS/MS analysis of human NFATc1 after incubation with human Rock25-554. (C) Schematic illustration of NFATc1 protein domains and sequence comparisons of positive hits among different species. (D) NFATc1 transcription activity assay. NFATc1-KO C2C12 myotubes were transfected with an NFATc1 reporter plasmid in combination with a WT or serine-to-alanine mutant NFATc1 plasmid (n = 3 each). Data represent the mean ± SEM. *P < 0.05 and **P < 0.01, by Student’s t test. (E) In vitro kinase assay. An 8-mer peptide (hNFATc1236-243) surrounding the Ser241 residue was added to the reaction mixture where indicated. Kinase activity was determined by incorporation of the [γ-32P]-ATP label. (F and G) Immunoblots for phosphorylated NFATc1 (p-NFATc1) (Ser243). (F) NFATc1-KO C2C12 myotubes were transfected with a plasmid encoding WT NFATc1 or its S243A mutant. Adenoviral infection of Gα13QL was done 12 hours after the transfection, and samples were prepared 24 hours later. (G) C2C12 myotubes were transfected with siRNA against Rock2 or with control siRNA. After 12 hours, Gα13QL was transfected via adenovirus, and the samples were prepared 12 hours later.
Ser243 phosphorylation of NFATc1 is coupled with Gα13 expression in vivo.
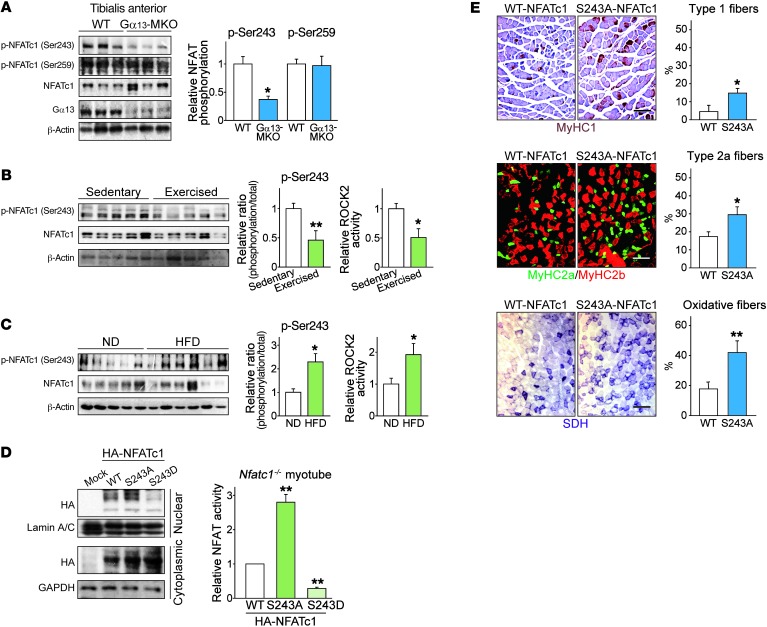
Our next step was to extend our understanding of the functional significance of Ser243 phosphorylation of NFATc1 to in vivo models. Of note, loss of Gα13 strongly lowered Ser243 phosphorylation in tibialis anterior muscle (Figure 8A), in contrast with the increase in total NFATc1 levels. On the other hand, the phosphorylation of NFATc1 at Ser259, a previously known phosphorylation site, was comparable between the genotypes. Exercise training, a condition that inhibits Gα13 levels, also repressed NFATc1 phosphorylation at the Ser243 residue in skeletal muscle, which was consistent with the decrease in Rock2 activity (Figure 8B). By contrast, p-NFATc1 (Ser243) levels were higher in the muscles of HFD-fed obese mice, which paralleled Rock2 activity and Gα13 levels (Figure 8C). Phosphorylation levels appeared to be slightly higher in a patient with type 2 diabetes than levels in a healthy individual (Supplemental Figure 7B).
Figure 8. Phosphorylation at Ser243 affects NFATc1 activity in vivo.
(A) Immunoblots for p-NFATc1 (Ser243). Twelve-week-old mice of each genotype were fasted overnight before sacrifice (n = 3 each). Each blot was obtained from samples run on parallel gels. (B and C) Immunoblots for p-NFATc1 (Ser243) and assays for Rock2 activity. A recombinant MYPT1 substrate peptide was used to determine the activity of Rock2 immunoprecipitated from tissue homogenates. (B) Mice were subjected to 1 hour of exercise and rested for 4 hours before sacrifice. Soleus muscles were used (n = 5 each). (C) Mice were fed a ND or a HFD for 13 weeks and were fasted overnight before sacrifice (n = 4–6 each). (D) Immunoblots and NFATc1 transcriptional activity assays. Left: C2C12 myotubes were transfected with mock or the plasmid encoding for WT NFATc1 or mutants, and subcellular fractions were collected 24 hours after transfection. Right: NFATc1-KO C2C12 myotubes were similarly cotransfected along with an NFAT reporter construct. Luciferase activity was assayed 48 hours after transfection (n = 4). (E) Immunostain images for myosin heavy chains and histochemical assays to determine SDH activity in tibialis anterior muscles, 14 days after electroporation-mediated gene delivery. Each mouse of the indicated genotype received a WT NFATc1 vector in 1 limb and a plasmid encoding S243A-mutant NFATc1 in the contralateral limb. Type 1 and 2a myofibers and those with high SDH activity were quantified. Scale bars: 200 μm. Data represent the mean ± SEM. *P < 0.05 and **P < 0.01, by Student’s t test.
To further evaluate the impact of Ser243 phosphorylation on NFATc1 activity, we examined the subcellular localization and transcriptional activities of NFATc1 using nonphosphorylatable or phospho-mimetic (Ser243-to-alanine or -aspartate, respectively) NFATc1 mutants (Figure 8D). As expected, the alanine mutant exhibited notably higher degrees of nuclear translocation and activity, whereas the aspartate mutant exerted the opposite effects, corroborating the functional importance of Ser243 phosphorylation. Consistently, the S243A mutant had a greater ability to promote myofiber type conversion in vivo than did WT NFATc1 (Figure 8E). These results demonstrate that Rock2 inhibits NFATc1 downstream of Gα13 through Ser243 phosphorylation, which is diminished by exercise but is increased in conditions of metabolic dysfunction, delineating the pathophysiological impact of Rock2 as an NFATc1 kinase.
Gα13-MKO diminishes whole-body adiposity as a result of increased energy expenditure.
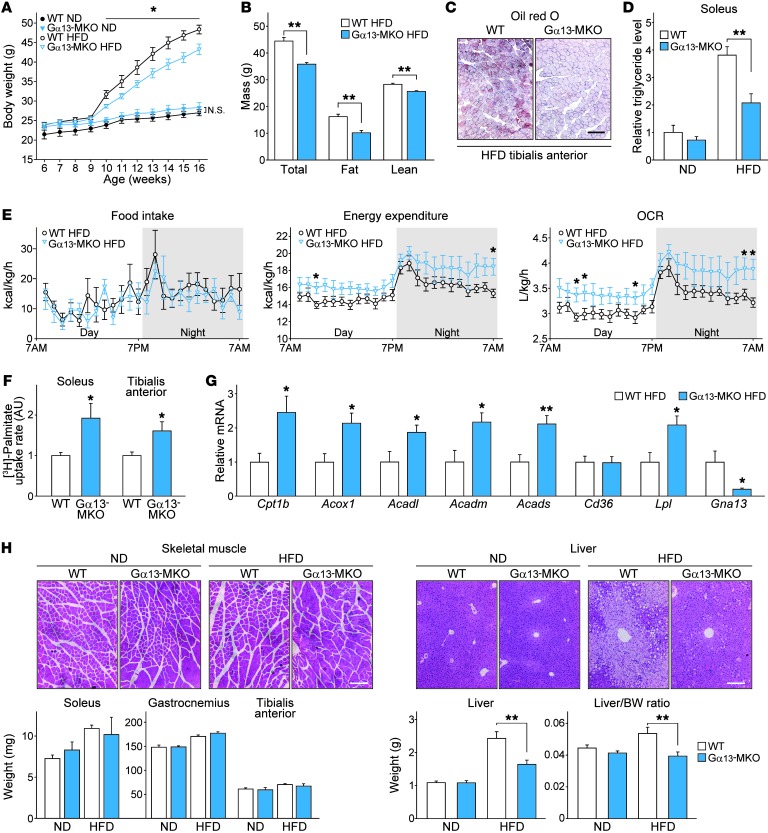
Factors that affect muscle fiber type distribution and oxidative capacity can lead to alterations in whole-body lipid catabolism (30, 31). Under basal conditions, Gα13-MKO mice had lower fat mass than did WT mice of the same body weight, presumably due to the conversion of skeletal muscles to oxidative type fibers (Supplemental Figure 8A). Therefore, we studied whether Gα13-MKO has the beneficial effect of preventing weight gain in animals fed a HFD for 9 weeks. From the very first week, Gα13-MKO mice resisted weight gain, maintaining at least 10% lower weights compared with WT mice until the end of the experiment (Figure 9A). Lower fat mass mostly accounted for the lower body weight gains in Gα13-MKO mice (Figure 9B). More important, we observed lower accumulations of intramyocellular lipid droplets (Figure 9C). Consistent with these results was the significantly lower level of triglycerides detected in soleus muscle (Figure 9D). A small difference in serum cholesterol levels was observed, whereas no significant difference was observed in serum triglyceride levels (Supplemental Figure 8B). In order to assess energy balance, food intake and whole-body energy expenditure were measured using a comprehensive laboratory animal monitoring system (CLAMS). Energy expenditure and OCRs were greater in Gα13-MKO mice over the time periods examined, although food intake and locomotor activity were comparable to or even lower than those of WT mice (Figure 9E and Supplemental Figure 8C). In skeletal muscles, fatty acid uptake rates were higher, and the genes encoding for the proteins associated with lipid catabolism were all highly expressed upon Gα13 MKO (Figure 9, F and G), indicating that a deficiency of Gα13 in skeletal muscles accelerates energy expenditure, with enhanced lipid clearance from the bloodstream and subsequent catabolism.
Figure 9. Gα13-MKO protects mice from diet-induced adiposity with increased fatty acid metabolism.
(A–H) Nine-week-old WT or Gα13-MKO mice were fed a ND or a HFD. After 9 weeks of HFD feeding, the mice were fasted overnight and then sacrificed. (A) Body weight gains (n = 6–8 each). (B) Determination of fat and lean mass in HFD-fed WT and Gα13-MKO mice using nuclear magnetic resonance (n = 8 each). (C) Oil red O staining of tibialis anterior after HFD feeding. Scale bar: 200 μm. (D) Relative triglyceride levels in mouse soleus muscles normalized with protein levels (n = 6–8 each). (E) In vivo energy balance. Food intake, energy expenditure, and OCR were analyzed in mice housed in individual metabolic cages (n = 8 each). (F) Ex vivo fatty acid uptake assay (n = 3 each). Muscles were freshly isolated from mice of each genotype, incubated in a medium containing [3H]-palmitate acid for 30 minutes, and lysed for scintillation counting. (G) qPCR assays for transcripts of the genes associated with lipid uptake and oxidation (n = 6–8 each). (H) H&E-stained images of skeletal muscles and liver and data on skeletal muscle and liver weights and liver/body weight ratios (n = 6–8 each). Scale bars: 200 μm. For A, B, and D–H, data represent the mean ± SEM. *P < 0.05 and **P < 0.01, by Student’s t test.
Interestingly, Gα13-MKO mice resisted hepatic steatosis, even after 9 weeks of HFD feeding, although neither skeletal muscle nor adipose tissue showed differences upon histological examination (Figure 9H and Supplemental Figure 8D). Lipid droplet accumulation was suppressed in Gα13-MKO mice, and, more important, an increase in the liver–to–body weight ratio was completely prevented. The difference in alanine amino transferase levels was not statistically significant (Supplemental Figure 8E). These results provide evidence that the beneficial outcomes of Gα13 deletion include not only an increase in lipolytic capacity in muscles but also a decrease in whole-body lipid accumulation.
Loss of Gα13 enhances muscle glucose metabolism and systemic insulin sensitivity.
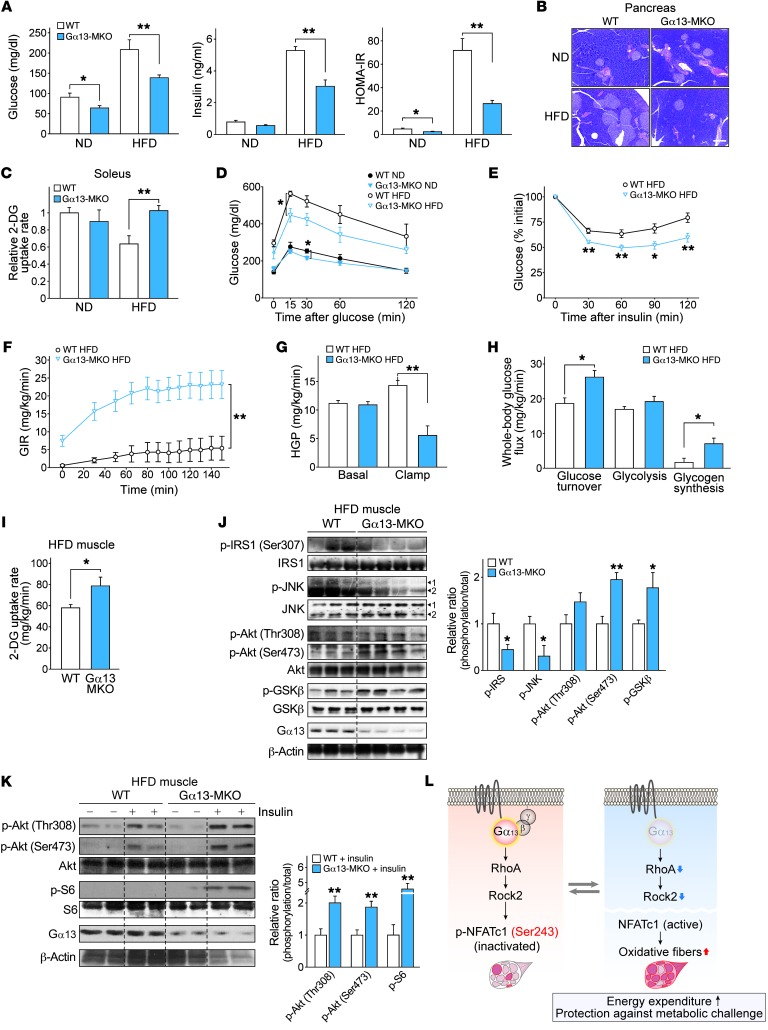
Intramyocellular lipid has been a primary contributor to insulin sensitivity in humans (32–34). Impaired mitochondrial function and reduced oxidative capacity in skeletal muscle strongly correlate with insulin resistance (35–37). Gα13-MKO mice showed diminished fasting hyperglycemia and hyperinsulinemia in the HFD-fed mouse model (Figure 10A). This was supported by adaptive changes in the size of pancreatic islets (Figure 10B). In the ex vivo assays, Gα13-MKO muscles were resistant to diet-induced impairment of insulin-stimulated glucose uptake (Figure 10C). In addition, both whole-body glucose (2 g/kg) and insulin tolerance (0.75 U/kg) were improved (Figure 10, D and E). These data prompted us to monitor insulin sensitivity more precisely.
Figure 10. Gα13-MKO protects mice from diet-induced insulin resistance.
(A–C) Nine-week-old WT and Gα13-MKO mice were fed a ND or a HFD. After 9 weeks of HFD feeding, the mice were fasted overnight and then sacrificed (n = 6–8 each). (A) Fasting serum glucose and insulin levels. Homeostasis model assessment of insulin resistance (HOMA-IR) was calculated from both parameters. (B) Representative H&E staining of pancreatic islets. Scale bar: 200 μm. (C) Maximal 2-deoxyglucose (2-DG) uptake assay using isolated soleus muscles. (D) Glucose tolerance test and (E) insulin tolerance test. Following overnight fasting, mice fed a ND or a HFD for 7 weeks were subjected to blood glucose measurement immediately after i.p. injection of glucose or insulin (n = 6–8 each). (F–I) Whole-body and tissue-specific insulin sensitivity was assessed in HFD-fed mice using a hyperinsulinemic-euglycemic clamp (n = 6–7 each). (F) Glucose infusion rate (GIR). (G) Hepatic glucose production (HGP) rates. (H) Whole-body glucose uptake, glycolysis, and glycogen synthesis rates. (I) 2-DG uptake rates in gastrocnemius immediately after a clamp assay. (J and K) Immunoblots for the markers of insulin sensitivity in soleus muscle. (J) Nine-week-old mice were fed a HFD for 9 weeks and then fasted overnight. (K) Mice of each genotype were fed a HFD for 9 weeks and then sacrificed 15 minutes after an i.p. insulin injection. (L) Schematic diagram illustrating how Gα13 and downstream signaling molecules regulate muscle fiber type and metabolic homeostasis. For J and K, each blot was obtained from samples run on parallel gels. For A and C–K, data represent the mean ± SEM. *P < 0.05 and **P < 0.01, by Student’s t test.
Next, we performed hyperinsulinemic-euglycemic clamps using HFD-fed mice. Gα13-MKO mice showed a significant increase in whole-body insulin sensitivity, as indicated by a 4.8-fold higher glucose infusion rate (Figure 10F). Alterations in the rates of hepatic glucose production and peripheral glucose uptake further validated improvements in hepatic and peripheral insulin sensitivity (Figure 10, G and H). During the clamp, tissue-specific glucose uptake in skeletal muscle was also enhanced in Gα13-MKO mice (Figure 10I). Intriguingly, increased hepatic insulin sensitivity was consistent with the observed inhibition of hepatic steatosis development.
Similarly, the levels of insulin resistance markers (e.g., phosphorylation of IRS1 at Ser307 and JNK phosphorylation) were lowered in Gα13-MKO skeletal muscles, whereas those of insulin sensitization markers (e.g., Akt and GSK3β phosphorylation) were increased (Figure 10J). Likewise, insulin-stimulated Akt phosphorylation at Thr308 or Ser473 and S6 phosphorylation were both greater in the Gα13-MKO muscles (Figure 10K). Considered together, our data support the conclusion that loss of Gα13 exercise mimetically induces the conversion of skeletal myofibers to the oxidative type by activating NFATc1 through Rock2 inhibition, which enhances whole-body energy metabolism, demonstrating the link between muscle-specific G protein signaling and systemic energy homeostasis (Figure 10L).
Discussion
Given the numerous benefits of exercise for preventing metabolic diseases, identification of druggable targets that mimic or boost the molecular cascade of endurance training has been a long-standing, but elusive, medical goal. GPCRs and their downstream signaling pathways have been studied for various indications. However, modulations of a specific GPCR have limits, as diseases are commonly driven by the simultaneous involvement of multiple receptors. Our study identifies Gα13 as the signaling node that regulates metabolic adaptation to extracellular stimuli, as supported by our findings that Gα13 levels in skeletal muscle were repressed by exercise, but increased under metabolic disease conditions, and that the genetic KO facilitated the reprogramming of myofibers to oxidative type fibers. This concept was strengthened by the outcomes of myosin heavy chain subtyping and SDH activity assays, which showed molecular signatures of long-term exercise–trained muscles. Gα13 KO enhanced mitochondrial respiration and endurance exercise capacity without previous training. Thus, we propose that Gα13 may serve as a switch that controls the overall sensitivity of multiple receptors associated with energy metabolism.
NFATc1 is the most studied regulator of myofiber type–associated gene expression (20–22). Our results reveal the physiological link between Gα13 and NFAT signaling both in vitro and in vivo. We also found that Gα13 or its downstream effector RhoA completely repressed nuclear localization of NFATc1 and its transcriptional activity in the basal or calcium-stimulated state. In particular, the effect of Gα13 was independent of calcineurin, an extensively studied upstream regulator of NFAT proteins. Conversely, a deficiency in Gα13 promotes nuclear accumulation of NFATc1 in vivo. The results of in vivo electroporation-facilitated knockdown experiments corroborated the functional impact of NFATc1 on myofiber conversion to the oxidative type. Our finding that NFATc1 also mediates the enhancement of cellular respiration is noteworthy, because, to our knowledge, this is the first direct evidence for NFATc1 regulation of oxidative metabolism. In contrast to our finding on NFATc1, endothelin activated NFATc3 through Gα13 in cultured fibroblasts (24). Therefore, the effect of Gα13 on NFATc1 appears to be quite distinct in skeletal muscle. This idea mirrors the reports that other isoforms except NFATc1 failed to determine fiber types in skeletal muscle (22, 38–40). We believe our research delineates the role of Gα13 signaling in the regulation of NFATc1 in energy homeostasis and elucidates the mechanism for how G protein signaling amplifies or blunts oxidative metabolism, thus providing insight into the NFATc1 regulatory pathway.
Other transcriptional regulators such as PGC1α, PPARδ, and ERRγ may also contribute to fiber type determination (6, 31, 41). In our data, a deficiency of Gα13 significantly increased PGC1α transcript levels. However, PGC1α protein levels moderately increased as compared with levels of NFATc1 (Supplemental Figure 9). This may reflect the indirect effect of the Gα13/NFATc1 signaling pathway, as also shown in another study using calcineurin-transgenic mice (42). Hence, it is highly likely that activated NFATc1 may recruit PGC1α to expedite the oxidative reprogramming of myofibers. Of note, although the transcript levels were significantly increased, Gα13 KO had no effect on ERRγ, but lowered PPARδ levels in muscles. This mismatch may result from a posttranscriptional regulatory mechanism. In addition, our data showed no significant increase in oxidative fiber composition in the soleus by Gα13 KO (presumably because of saturation), despite enhanced insulin sensitivity. Thus, an alternative pathway regulated by Gα13 may not be ruled out. It would be of extra value to determine the physiological relevance of such pathways in muscle biology and other areas.
Another finding of our study is the ability of Rock2 to inhibit NFATc1. It has been shown that NFATc1 activity is regulated by multiple phosphorylations in the NHR domain containing a nuclear localization signal peptide. In resting cells, a majority of the serine residues are phosphorylated by kinases, including GSK3, CK1, and DYRK (43). Here, we showed that the Gα13 effector Rock2 is an immediate kinase of NFATc1. We also found that Ser243 in NFATc1 is a phosphorylation site essential for Rock2-mediated inhibition of NFATc1. The physiological impact of Ser243 phosphorylation was further emphasized in vivo using exercise-trained or obese mouse models. Although Ser243 resides in the NHR domain of NFATc1, CTD also seems to have a role in the interaction with Rock2, since we found that either NHR or CTD alone could bind to Rock2. As substrate specificity often requires interactions between distal docking motifs (44), CTD may increase the reactivity of Rock2 for NFATc1. This could be achieved by aligning proteins to a more favorable position for phosphorylation, or by increasing the local concentration of Rock2 around NFATc1.
The conversion of myofibers to the oxidative type confers protection against obesity and related metabolic disorders such as diabetes (10). After exercise, lipid consumption from both intramyocellular triglycerides and circulating fatty acids is augmented in muscles to meet the fuel requirements, while sparing carbohydrates for glycogenesis (45). The persistent increase in lipid oxidation provides the crucial metabolic advantage of exercise on whole-body energy homeostasis. We showed that skeletal muscle–specific loss of Gα13 exerts beneficial effects on weight gain and insulin sensitivity upon HFD feeding, which appeared to be comparable to the outcome with exercise training. In addition, lipid accumulation and insulin resistance were both inhibited not only in the muscles, but also in the liver. Studies have shown that muscle insulin resistance precedes insulin resistance in the liver, causing liver steatosis, and contributes to whole-body adiposity by diverting ingested glucose and lipids to other organs (46). Genetic models of selective insulin resistance in the muscle were also prone to developing hepatic steatosis and obesity (47, 48). Therefore, it is reasonable that the enhancement of energy metabolism and the consequent reversal of metabolic dysregulation in the muscle would contribute to the prevention of metabolic disease progression in the liver, as shown in human studies (49).
Metabolic function of skeletal muscle is also determined by the size of myofibers. A recent study has shown that coexpression of inactive Gα13 and Gα12 mutants can reverse GPR56-induced C2C12 myotube hypertrophy (50). However, the role of Gα13 in skeletal muscle had never been studied in vivo. In our study, Gα13-MKO mice exhibited the oxidative shift in fiber types, but not the increase in muscle mass. In addition, Gα12-KO mice failed to show an overt phenotype in terms of endurance exercise performance or muscle weight (J.H. Koo, unpublished observations). Further studies on the effect of Gα13 signaling on muscle mass control in the models of mechanical overload–induced hypertrophy or damage-induced regeneration models would be of help to achieve a comprehensive understanding.
Our findings warrant further investigation into whether inhibitors of Gα13 or associated receptors and downstream pathways may provide an innovative strategy to improve muscle function in patients with decreased mitochondrial activity in muscle. Of the ligands for Gα13-coupled receptors, lipid mediators (e.g., lysophosphatidic acid, sphingosine-1-phosphate, platelet-activating factor, and endocannabinoids) were mostly studied. Among them, lysophosphatidic acid could be one of the working ligands in skeletal muscle, as inhibition of its receptor(s) generally provides metabolic benefits such as the attenuation of diet-induced obesity and atherosclerosis development in mice (51, 52). Inhibitors selectively targeting Rock2 or Ser243 phosphorylation of NFATc1 can also be attractive therapeutic candidates for metabolic diseases, as has already been observed in part with a nonselective Rock inhibitor (53). Furthermore, we believe that the link we have identified between Gα13 and NFATc1 has broad implications for diseases other than metabolic dysregulation. For example, dysregulation of NFATc1 is associated with malignant transformation and cancer progression. In addition, NFATc1 promotes T cell anergy and Treg function (43), which heightens the potential for our findings to provide new therapeutic strategies for autoimmune disorders. Signaling through Gα13/Rock2/NFATc1 thus represents a pathway for further scientific exploration and a possible avenue for pharmaceutical interventions in the treatment of diseases.
Methods
Animals.
We bred Ckmm-Cre mice (The Jackson Laboratory) with Gna13fl/fl mice (a gift of Stefan Offermanns, Max Planck Institute, Bad Nauheim, Germany) (54) to generate Gα13-MKO mice, which were then bred again with Gna13fl/fl mice to produce control littermates for the Gα13-MKO mice. The control mice developed and behaved in the same manner as did the WT mice. Mice were maintained on a 12-hour dark/12-hour light cycle and were fed a normal rodent chow diet or a HFD (D12492; Research Diets). All animals used were male mice on a C57BL/6 background. The group sizes were chosen on the basis of our experience with HFD models, without using a statistical method to predetermine the sample size. For experiments, mice of similar age and weight were randomly subgrouped and subjected to treatments. Because of the experimental design, the investigators could not be blinded to the genotype of the mice. Samples from human patients were obtained from Genetex.
Treadmill running.
We performed treadmill running studies using a motorized, speed-controlled treadmill system. The running speed was set at 10 m/min for 30 minutes and increased by increments of 2 m/min every 10 minutes, up to 16 m/min. The inclination angle was 5%. Male mice were trained at a speed of 10 m/min in 3 sessions to acquire running skills before the running tests. Mice were determined to be exhausted and were excluded if they resisted running and rested on the electric shock grid for more than 20 seconds. WT mice were subjected to running until exhaustion and were rested for 4 hours. Mice were anesthetized, and skeletal muscles were dissected for the measurement of protein and transcript levels. In a separate study, WT and Gα13-MKO mice were allowed to run until exhaustion for the measurement of total running time and distance.
See the Supplemental Materials and Methods for further details.
Microarray data.
The microarray data on soleus muscles from mice of each genotype were deposited in the NCBI’s GEO database (GEO GSE83737).
Statistics.
Two-tailed Student’s t tests were performed to assess the significance of differences among treatment groups. Data are expressed as the mean ± SEM. The criterion for statistical significance was set at P values of less than 0.05 and less than 0.01.
Study approval.
All studies were approved by the IRB of Seoul National University and by the IACUC of the Center for Animal Care and Use of Lee Gil Ya Cancer and Diabetes Institute at Gachon University.
Author contributions
JHK and SGK conceived the project, designed the research, and wrote the manuscript. JHK performed the studies and analyzed the data. JHK, SYP, THK, and MSJ performed the metabolic phenotyping of animals. SYP and CSC performed and analyzed hyperinsulinemic-euglycemic clamp studies. CYH and JHK performed in vivo gene delivery experiments. SGK provided overall data supervision and obtained the funding. All authors discussed the results and commented on the manuscript.
Supplementary Material
Acknowledgments
We thank Stefan Offermanns (Max Planck Institute) for providing the Gna13fl/fl mice. We also thank Jae Myun Lee (Yonsei University, Seoul, South Korea) for sharing the p-NFATc1 (Ser259) antibody. This work was supported by grants from the National Research Foundation of Korea (NRF), funded by the Korean government (MSIP) (2017K1A1A2004511). JHK was supported by a grant from the Basic Science Research Program through the NRF, funded by the Korean Ministry of Education (2017R1A6A3A01001976). SYP and CSC were supported by a grant from the Bio and Medical Technology Development Program of the NRF funded by the MSIP (2014M3A9D5A01073886) and by a grant from the Korea Health Technology R&D Project through the Korea Health Industry Development Institute (KHIDI) funded by the Ministry for Health and Welfare of Korea (HI14C1135).
Version 1. 09/14/2017
Electronic publication
Version 2. 09/20/2017
Print issue publication
Footnotes
Conflict of interest: The authors have declared that no conflict of interest exists.
Reference information: J Clin Invest. 2017;127(10):3845–3860.https://doi.org/10.1172/JCI92067.
Contributor Information
Ja Hyun Koo, Email: jhkoo@snu.ac.kr.
Tae Hyun Kim, Email: moneywater@snu.ac.kr.
Min Sung Joo, Email: wnms0103@snu.ac.kr.
Chang Yeob Han, Email: hancy@snu.ac.kr.
Cheol Soo Choi, Email: cschoi@gachon.ac.kr.
Sang Geon Kim, Email: sgk@snu.ac.kr.
References
- 1.Egan B, Zierath JR. Exercise metabolism and the molecular regulation of skeletal muscle adaptation. Cell Metab. 2013;17(2):162–184. doi: 10.1016/j.cmet.2012.12.012. [DOI] [PubMed] [Google Scholar]
- 2.Hickey MS, et al. Skeletal muscle fiber composition is related to adiposity and in vitro glucose transport rate in humans. Am J Physiol. 1995;268(3 Pt 1):E453–E457. doi: 10.1152/ajpendo.1995.268.3.E453. [DOI] [PubMed] [Google Scholar]
- 3.He J, Watkins S, Kelley DE. Skeletal muscle lipid content and oxidative enzyme activity in relation to muscle fiber type in type 2 diabetes and obesity. Diabetes. 2001;50(4):817–823. doi: 10.2337/diabetes.50.4.817. [DOI] [PubMed] [Google Scholar]
- 4.Nyholm B, et al. Evidence of an increased number of type IIb muscle fibers in insulin-resistant first-degree relatives of patients with NIDDM. Diabetes. 1997;46(11):1822–1828. doi: 10.2337/diab.46.11.1822. [DOI] [PubMed] [Google Scholar]
- 5.Tanner CJ, et al. Muscle fiber type is associated with obesity and weight loss. Am J Physiol Endocrinol Metab. 2002;282(6):E1191–E1196. doi: 10.1152/ajpendo.00416.2001. [DOI] [PubMed] [Google Scholar]
- 6.Wang YX, et al. Regulation of muscle fiber type and running endurance by PPARdelta. PLoS Biol. 2004;2(10):e294. doi: 10.1371/journal.pbio.0020294. [DOI] [PMC free article] [PubMed] [Google Scholar]
- 7.Calvo JA, et al. Muscle-specific expression of PPARgamma coactivator-1alpha improves exercise performance and increases peak oxygen uptake. J Appl Physiol. 2008;104(5):1304–1312. doi: 10.1152/japplphysiol.01231.2007. [DOI] [PubMed] [Google Scholar]
- 8.Garcia-Roves PM, Osler ME, Holmström MH, Zierath JR. Gain-of-function R225Q mutation in AMP-activated protein kinase gamma3 subunit increases mitochondrial biogenesis in glycolytic skeletal muscle. J Biol Chem. 2008;283(51):35724–35734. doi: 10.1074/jbc.M805078200. [DOI] [PubMed] [Google Scholar]
- 9.Lagouge M, et al. Resveratrol improves mitochondrial function and protects against metabolic disease by activating SIRT1 and PGC-1alpha. Cell. 2006;127(6):1109–1122. doi: 10.1016/j.cell.2006.11.013. [DOI] [PubMed] [Google Scholar]
- 10.Narkar VA, et al. AMPK and PPARdelta agonists are exercise mimetics. Cell. 2008;134(3):405–415. doi: 10.1016/j.cell.2008.06.051. [DOI] [PMC free article] [PubMed] [Google Scholar]
- 11.Choi CS, et al. Paradoxical effects of increased expression of PGC-1alpha on muscle mitochondrial function and insulin-stimulated muscle glucose metabolism. Proc Natl Acad Sci U S A. 2008;105(50):19926–19931. doi: 10.1073/pnas.0810339105. [DOI] [PMC free article] [PubMed] [Google Scholar]
- 12.Stevens RC, et al. The GPCR Network: a large-scale collaboration to determine human GPCR structure and function. Nat Rev Drug Discov. 2013;12(1):25–34. doi: 10.1038/nrd3859. [DOI] [PMC free article] [PubMed] [Google Scholar]
- 13.Rasmussen SG, et al. Crystal structure of the β2 adrenergic receptor-Gs protein complex. Nature. 2011;477(7366):549–555. doi: 10.1038/nature10361. [DOI] [PMC free article] [PubMed] [Google Scholar]
- 14.Oldham WM, Hamm HE. Heterotrimeric G protein activation by G-protein-coupled receptors. Nat Rev Mol Cell Biol. 2008;9(1):60–71. doi: 10.1038/nrm2299. [DOI] [PubMed] [Google Scholar]
- 15.Offermanns S, Mancino V, Revel JP, Simon MI. Vascular system defects and impaired cell chemokinesis as a result of Galpha13 deficiency. Science. 1997;275(5299):533–536. doi: 10.1126/science.275.5299.533. [DOI] [PubMed] [Google Scholar]
- 16.Sato T, et al. PRC2 overexpression and PRC2-target gene repression relating to poorer prognosis in small cell lung cancer. Sci Rep. 2013;3:1911. doi: 10.1038/srep01911. [DOI] [PMC free article] [PubMed] [Google Scholar]
- 17.Lanza IR, et al. Endurance exercise as a countermeasure for aging. Diabetes. 2008;57(11):2933–2942. doi: 10.2337/db08-0349. [DOI] [PMC free article] [PubMed] [Google Scholar]
- 18.Gan Z, et al. Nuclear receptor/microRNA circuitry links muscle fiber type to energy metabolism. J Clin Invest. 2013;123(6):2564–2575. doi: 10.1172/JCI67652. [DOI] [PMC free article] [PubMed] [Google Scholar]
- 19.Zhang D, et al. Thyroid hormone regulates muscle fiber type conversion via miR-133a1. J Cell Biol. 2014;207(6):753–766. doi: 10.1083/jcb.201406068. [DOI] [PMC free article] [PubMed] [Google Scholar]
- 20.Swoap SJ, et al. The calcineurin-NFAT pathway and muscle fiber-type gene expression. Am J Physiol Cell Physiol. 2000;279(4):C915–C924. doi: 10.1152/ajpcell.2000.279.4.C915. [DOI] [PubMed] [Google Scholar]
- 21.Meissner JD, et al. Extracellular signal-regulated kinase 1/2-mediated phosphorylation of p300 enhances myosin heavy chain I/beta gene expression via acetylation of nuclear factor of activated T cells c1. Nucleic Acids Res. 2011;39(14):5907–5925. doi: 10.1093/nar/gkr162. [DOI] [PMC free article] [PubMed] [Google Scholar]
- 22.Ehlers ML, Celona B, Black BL. NFATc1 controls skeletal muscle fiber type and is a negative regulator of MyoD activity. Cell Rep. 2014;8(6):1639–1648. doi: 10.1016/j.celrep.2014.08.035. [DOI] [PMC free article] [PubMed] [Google Scholar]
- 23.Asagiri M, et al. Autoamplification of NFATc1 expression determines its essential role in bone homeostasis. J Exp Med. 2005;202(9):1261–1269. doi: 10.1084/jem.20051150. [DOI] [PMC free article] [PubMed] [Google Scholar]
- 24.Nishida M, et al. Galpha12/13-mediated up-regulation of TRPC6 negatively regulates endothelin-1-induced cardiac myofibroblast formation and collagen synthesis through nuclear factor of activated T cells activation. J Biol Chem. 2007;282(32):23117–23128. doi: 10.1074/jbc.M611780200. [DOI] [PubMed] [Google Scholar]
- 25.Rana ZA, Gundersen K, Buonanno A. Activity-dependent repression of muscle genes by NFAT. Proc Natl Acad Sci USA. 2008;105(15):5921–5926. doi: 10.1073/pnas.0801330105. [DOI] [PMC free article] [PubMed] [Google Scholar]
- 26.Stark DA, et al. Ephrin-A3 promotes and maintains slow muscle fiber identity during postnatal development and reinnervation. J Cell Biol. 2015;211(5):1077–1091. doi: 10.1083/jcb.201502036. [DOI] [PMC free article] [PubMed] [Google Scholar]
- 27.Cong L, et al. Multiplex genome engineering using CRISPR/Cas systems. Science. 2013;339(6121):819–823. doi: 10.1126/science.1231143. [DOI] [PMC free article] [PubMed] [Google Scholar]
- 28.Wettschureck N, Offermanns S. Rho/Rho-kinase mediated signaling in physiology and pathophysiology. J Mol Med. 2002;80(10):629–638. doi: 10.1007/s00109-002-0370-2. [DOI] [PubMed] [Google Scholar]
- 29.Pelosi M, et al. ROCK2 and its alternatively spliced isoform ROCK2m positively control the maturation of the myogenic program. Mol Cell Biol. 2007;27(17):6163–6176. doi: 10.1128/MCB.01735-06. [DOI] [PMC free article] [PubMed] [Google Scholar]
- 30.Lin J, Handschin C, Spiegelman BM. Metabolic control through the PGC-1 family of transcription coactivators. Cell Metab. 2005;1(6):361–370. doi: 10.1016/j.cmet.2005.05.004. [DOI] [PubMed] [Google Scholar]
- 31.Rangwala SM, et al. Estrogen-related receptor gamma is a key regulator of muscle mitochondrial activity and oxidative capacity. J Biol Chem. 2010;285(29):22619–22629. doi: 10.1074/jbc.M110.125401. [DOI] [PMC free article] [PubMed] [Google Scholar]
- 32.Jacob S, et al. Association of increased intramyocellular lipid content with insulin resistance in lean nondiabetic offspring of type 2 diabetic subjects. Diabetes. 1999;48(5):1113–1119. doi: 10.2337/diabetes.48.5.1113. [DOI] [PubMed] [Google Scholar]
- 33.Perseghin G, et al. Intramyocellular triglyceride content is a determinant of in vivo insulin resistance in humans: a 1H-13C nuclear magnetic resonance spectroscopy assessment in offspring of type 2 diabetic parents. Diabetes. 1999;48(8):1600–1606. doi: 10.2337/diabetes.48.8.1600. [DOI] [PubMed] [Google Scholar]
- 34.Krssak M, et al. Intramyocellular lipid concentrations are correlated with insulin sensitivity in humans: a 1H NMR spectroscopy study. Diabetologia. 1999;42(1):113–116. doi: 10.1007/s001250051123. [DOI] [PubMed] [Google Scholar]
- 35.Simoneau JA, Kelley DE. Altered glycolytic and oxidative capacities of skeletal muscle contribute to insulin resistance in NIDDM. J Appl Physiol. 1997;83(1):166–171. doi: 10.1152/jappl.1997.83.1.166. [DOI] [PubMed] [Google Scholar]
- 36.Bruce CR, et al. Muscle oxidative capacity is a better predictor of insulin sensitivity than lipid status. J Clin Endocrinol Metab. 2003;88(11):5444–5451. doi: 10.1210/jc.2003-030791. [DOI] [PubMed] [Google Scholar]
- 37.Kelley DE, He J, Menshikova EV, Ritov VB. Dysfunction of mitochondria in human skeletal muscle in type 2 diabetes. Diabetes. 2002;51(10):2944–2950. doi: 10.2337/diabetes.51.10.2944. [DOI] [PubMed] [Google Scholar]
- 38.Horsley V, Friday BB, Matteson S, Kegley KM, Gephart J, Pavlath GK. Regulation of the growth of multinucleated muscle cells by an NFATC2-dependent pathway. J Cell Biol. 2001;153(2):329–338. doi: 10.1083/jcb.153.2.329. [DOI] [PMC free article] [PubMed] [Google Scholar]
- 39.Kegley KM, Gephart J, Warren GL, Pavlath GK. Altered primary myogenesis in NFATC3(-/-) mice leads to decreased muscle size in the adult. Dev Biol. 2001;232(1):115–126. doi: 10.1006/dbio.2001.0179. [DOI] [PubMed] [Google Scholar]
- 40.Graef IA, Chen F, Chen L, Kuo A, Crabtree GR. Signals transduced by Ca(2+)/calcineurin and NFATc3/c4 pattern the developing vasculature. Cell. 2001;105(7):863–875. doi: 10.1016/S0092-8674(01)00396-8. [DOI] [PubMed] [Google Scholar]
- 41.Handschin C, et al. Skeletal muscle fiber-type switching, exercise intolerance, and myopathy in PGC-1alpha muscle-specific knock-out animals. J Biol Chem. 2007;282(41):30014–30021. doi: 10.1074/jbc.M704817200. [DOI] [PubMed] [Google Scholar]
- 42.Long YC, Glund S, Garcia-Roves PM, Zierath JR. Calcineurin regulates skeletal muscle metabolism via coordinated changes in gene expression. J Biol Chem. 2007;282(3):1607–1614. doi: 10.1074/jbc.M609208200. [DOI] [PubMed] [Google Scholar]
- 43.Müller MR, Rao A. NFAT, immunity and cancer: a transcription factor comes of age. Nat Rev Immunol. 2010;10(9):645–656. doi: 10.1038/nri2818. [DOI] [PubMed] [Google Scholar]
- 44.Ubersax JA, Ferrell JE. Mechanisms of specificity in protein phosphorylation. Nat Rev Mol Cell Biol. 2007;8(7):530–541. doi: 10.1038/nrm2203. [DOI] [PubMed] [Google Scholar]
- 45.Kiens B, Richter EA. Utilization of skeletal muscle triacylglycerol during postexercise recovery in humans. Am J Physiol. 1998;275(2 Pt 1):E332–E337. doi: 10.1152/ajpendo.1998.275.2.E332. [DOI] [PubMed] [Google Scholar]
- 46.Samuel VT, Shulman GI. The pathogenesis of insulin resistance: integrating signaling pathways and substrate flux. J Clin Invest. 2016;126(1):12–22. doi: 10.1172/JCI77812. [DOI] [PMC free article] [PubMed] [Google Scholar]
- 47.Kim JK, et al. Glucose toxicity and the development of diabetes in mice with muscle-specific inactivation of GLUT4. J Clin Invest. 2001;108(1):153–160. doi: 10.1172/JCI10294. [DOI] [PMC free article] [PubMed] [Google Scholar]
- 48.Kim JK, et al. Redistribution of substrates to adipose tissue promotes obesity in mice with selective insulin resistance in muscle. J Clin Invest. 2000;105(12):1791–1797. doi: 10.1172/JCI8305. [DOI] [PMC free article] [PubMed] [Google Scholar]
- 49.Rabøl R, Petersen KF, Dufour S, Flannery C, Shulman GI. Reversal of muscle insulin resistance with exercise reduces postprandial hepatic de novo lipogenesis in insulin resistant individuals. Proc Natl Acad Sci USA. 2011;108(33):13705–13709. doi: 10.1073/pnas.1110105108. [DOI] [PMC free article] [PubMed] [Google Scholar]
- 50.White JP, et al. G protein-coupled receptor 56 regulates mechanical overload-induced muscle hypertrophy. Proc Natl Acad Sci U S A. 2014;111(44):15756–15761. doi: 10.1073/pnas.1417898111. [DOI] [PMC free article] [PubMed] [Google Scholar]
- 51.Rancoule C, et al. Lysophosphatidic acid impairs glucose homeostasis and inhibits insulin secretion in high-fat diet obese mice. Diabetologia. 2013;56(6):1394–1402. doi: 10.1007/s00125-013-2891-3. [DOI] [PubMed] [Google Scholar]
- 52.Kritikou E, et al. Inhibition of lysophosphatidic acid receptors 1 and 3 attenuates atherosclerosis development in LDL-receptor deficient mice. Sci Rep. 2016;6:37585. doi: 10.1038/srep37585. [DOI] [PMC free article] [PubMed] [Google Scholar]
- 53.Kanda T, et al. Rho-kinase as a molecular target for insulin resistance and hypertension. FASEB J. 2006;20(1):169–171. doi: 10.1096/fj.05-4197fje. [DOI] [PubMed] [Google Scholar]
- 54.Moers A, et al. G13 is an essential mediator of platelet activation in hemostasis and thrombosis. Nat Med. 2003;9(11):1418–1422. doi: 10.1038/nm943. [DOI] [PubMed] [Google Scholar]
Associated Data
This section collects any data citations, data availability statements, or supplementary materials included in this article.


