Abstract
Hemolysis is the most common reason why coagulation test samples are rejected. However, the effects of hemolysis on plasma prothrombin time (PPT) and activated partial thromboplastin time (APTT) are rarely investigated and the results are controversial. This research aims to analyze the effects of hemolysis on PPT and APPT using the photo-optical method.
Nonhemolyzed citrate blood samples (n = 30) with normal PPT and APTT underwent 2-step mechanical lysis and then hemoglobin level measurement was carried out at each step. The first lysis was mild to moderate resulting in a hemoglobin level of <0.8 g/dL. These samples were labeled as group 1. The second step showed more severe lysis, which resulted in a plasma hemoglobin level of ≥0.8 g/dL. These samples were labeled as group 2. Analysis was carried out on the PPT and APTT differences between the 2 groups and baseline, as well as between group 1 and group 2 using repeated-measures analysis of variance (ANOVA). The effects of hemolysis were analyzed using linear regression. Receiver operating characteristic (ROC) curve analysis was performed to determine the cut-off value in PPT and APTT.
Significantly shorter APTT was measured for group 1 than baseline, (P = .000), group 2 than baseline (P = .000), and group 2 than group 1 (P = .003). With regard to PPT results, those for group 1 were significant shorter than baseline (P = .002), while those for group 2 were significantly longer than group 1 (P = .000). In the correlation assay, the level of hemolysis revealed a mildly significant correlation to APTT (R = 0.245; P = .02). Cut-off value for PPT was 1.55 g/dL (100% sensitivity and 87.9% specificity), while the value for APTT was 0.95 g/dL (75% sensitivity and 62.5% specificity).
Not all hemolyzed samples should be rejected for PPT and APTT tests using photo-optical methods.
Keywords: activated partial thromboplastin time, hemolysis, plasma hemoglobin, plasma prothrombin time, Sysmex CS-2100i
1. Introduction
Plasma prothrombin time (PPT) and activated partial thromboplastin time (APTT) are coagulation tests routinely performed in laboratories to evaluate the function of the coagulation system. The PPT test measures the extrinsic pathway, while APTT measures the intrinsic pathway activities. Both coagulation function tests are affected by preanalytical factors such as the venipuncture process, the dose of citrate anticoagulant, sample transportation, processing, and storing. The interference of hemolysis, icterus, and lipemia are the main problems in coagulation tests that use photooptical detection methods. Errors in preanalytical and analytical phases may interfere with the reliability of results.[1–5]
There are 2 main methods of coagulation measurements, namely the photo-optical method and mechanical method. The optical method detects clot formation through changes in optical density (OD) of the sample. Mechanical clot technology detects clot formation by monitoring the movement of a steel ball inside the test sample using a magnetic sensor.[6]
Hemolyzed blood samples will cause spectral interference in photo-optical method instruments; therefore, this is the most common reason why coagulation tests are rejected. According to the Clinical and Laboratory Standard Institute (CLSI), blood samples that show apparent hemolysis may undergo premature coagulation activity and also disrupt the clot detection by the optical instruments.[3,5]
The rejection of hemolyzed blood samples has become a policy that is applied in most laboratories, hence studies on the effect of hemolysis on coagulation tests have been rare and the results are still controversial. The consequence of hemolyzed blood sample rejection is repeat blood sample collection that causes additional discomfort to patients, delayed test results, and increased laboratory operating costs.[7]
Laga et al[8] in their study explained their findings that PPT and APTT between hemolyzed and nonhemolyzed blood samples did not differ significantly. Arora et al[7] argued that hemolyzed blood samples could be processed for coagulation tests because there was no significant difference between hemolyzed and nonhemolyzed blood samples.
The effect of free hemoglobin produced by hemolysis can result in analytical and biological changes. High absorbance will be caused by cell-free hemoglobin from hemolysis at wavelengths used by photo-optical method instruments. Release of cytoplasmic and plasma membrane molecules (e.g., tissue factor, proteases, phospholipids, and adenosine diphosphate) can spuriously activate blood coagulation and platelets.[4] The CLSI guidelines for PPT and APTT testing states: “Samples with visible hemolysis should not be used because of possible clotting factor activation and interference with endpoint measurement.”[9]
The Sysmex CS-2100i is a coagulometer that uses the photo-optical method. It minimizes pre-analytical errors by using multi-wavelength scanning and sample liquid-sensing technologies. By using smartly designed PSI technology, the analyzers provide extra operator support; they identify and automatically manage potentially problematic test samples before analysis.[10] According to Tantanate et al,[11] Sysmex CS-2100i (Siemens, Kobe, Japan) is capable of performing good analysis on samples with interference from hemolysis, icterus, and lipemia. The aims of this study were to determine the effect of hemolysis on PPT and APTT tests and to find the plasma hemoglobin cut-off point that could affect the test results. This study may help to reevaluate the policy of rejecting hemolyzed blood samples for coagulation testing.
2. Methods
2.1. Study samples
This study was conducted between November 2014 and February 2015 in the Clinical Pathology Laboratory of the Dr Soetomo General Hospital in Surabaya, Indonesia. The total number of samples was 30 blood samples, which were taken from remaining citrate blood plasma of patients who had been examined for PPT and APTT as part of routine examinations. The inclusion criteria were nonhemolyzed blood samples that had apparently clear plasma, normal PPT and APTT test results, and no icteric and lipemic plasma that could have interfered with the results. Ethical approval was not required because this research had no interaction with the patient and the goal was to create a local laboratory policy on rejection of hemolyzed samples. Informed consent was not required because this research used the remaining samples of patients who were already the subjects of PPT and APTT assays. Age, sex, and patient diagnosis data were recorded from the job list form.
2.2. Methods
This study was an experimental laboratory research project with pre-test and post-test design. The data of PPT and APTT patients who fulfilled inclusion criteria were recorded as baseline data. The remaining samples were then mechanically lyzed by inserting blood into a 3 mL disposable syringe fitted with a 23G needle and then vigorously expelled 2 to 3 times. This procedure resulted in lysis of erythrocytes and measured plasma hemoglobin of <0.8 g/dL. The blood samples next underwent further lysis by expelling with stronger pressure for a total of 4 to 5 times. This resulted in measured plasma hemoglobin of ≥0.8 g/dL. This procedure is a modification of the method proposed by Arora et al[7] and was chosen because the most common cause of hemolysis is mechanical factors occurring during the venipuncture or transportation processes. Determination of plasma hemoglobin was with reference to a level of 0.8 g/dL because this is the limiting level of plasma hemoglobin that will influence the result of APTT according to the Sysmex CS-2100i application sheet.[12] To examine the plasma hemoglobin, lyzed blood samples were centrifuged at 300 rpm for 15 minutes, and then the supernatant was examined for hemoglobin plasma level using a Sysmex XN-1000 (Siemens) hematology analyzer.
Samples were separated according to plasma hemoglobin level. Samples with plasma hemoglobin level <0.8 g/dL belonged to group 1 (n = 30) and samples with plasma hemoglobin level ≥0.8 g/dL belonged to group 2 (n = 30). Both groups were then reexamined for PPT and APTT after hemolysis. All examinations were performed no later than 2 hours after phlebotomy to maintain the stability of coagulation factors. Examinations were performed by the photo optical method using a Sysmex CS-2100i (Siemens) instrument. The reagents used were Dade Actin FSL Activated PTT for APTT and Dade Innovin for PPT. The normal value for PPT was 9 to 12 seconds and APTT was 23 to 33 seconds. The examination of plasma hemoglobin level was performed using Sysmex XN-1000 (Siemen) hematology analyzer. Quality control of this instrument was performed twice a day, in the morning and afternoon, using a plasma control from Sysmex and then once a day with pooled normal plasma.
2.3. Statistical analysis
All statistical analyses were performed using IBM SPSS Statistics for Windows, Version 20.0. Armonk, NY: IBM Corp. The difference between PPT and APTT values between and within groups was tested with repeated-measures analysis of variance (ANOVA) or Friedman measurements with post hoc tests depending on data distribution. The Shapiro Wilk test was applied to test the data normality. The effect of plasma hemoglobin level on PPT and APTT was analyzed with a linear regression test. The descriptive data were presented as mean ± SD. The receiver operating characteristic (ROC) analysis was applied to evaluate the sensitivity and specificity of plasma hemoglobin levels that could affect PPT and APTT examinations using a confidence interval of 95%. The value of P < .05 was considered as statistically significant.
3. Results
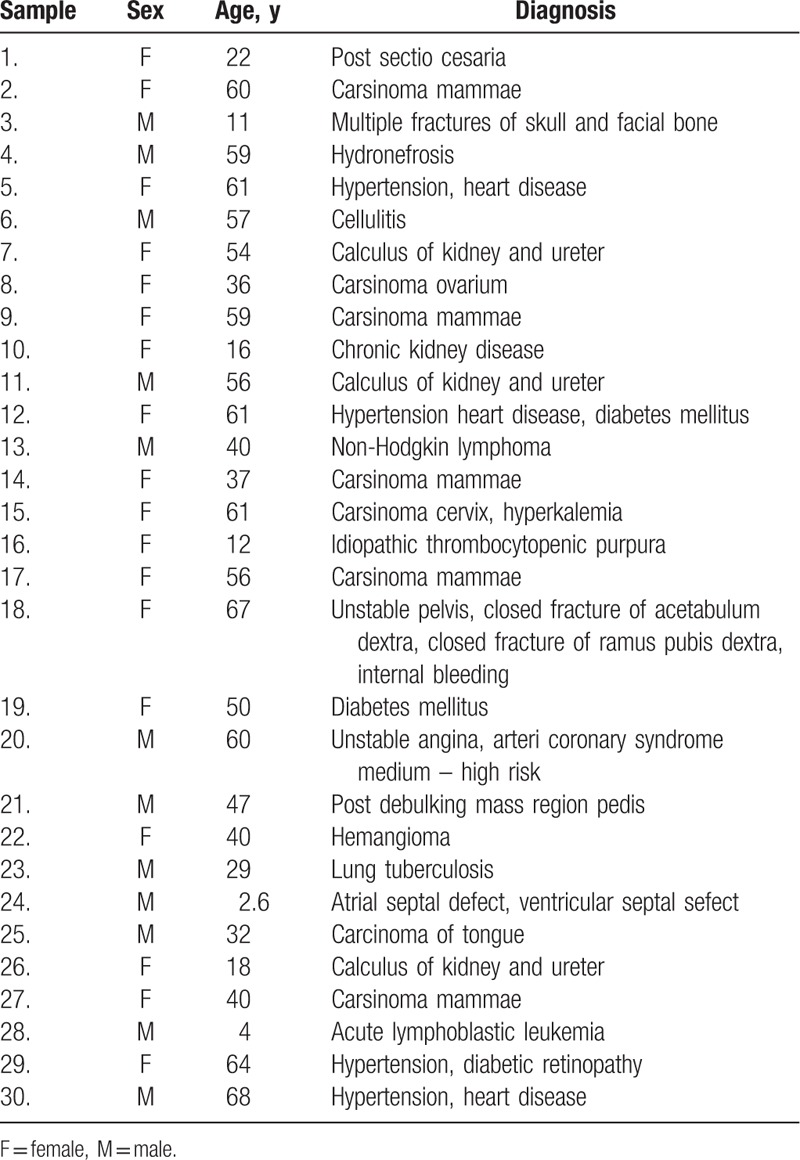
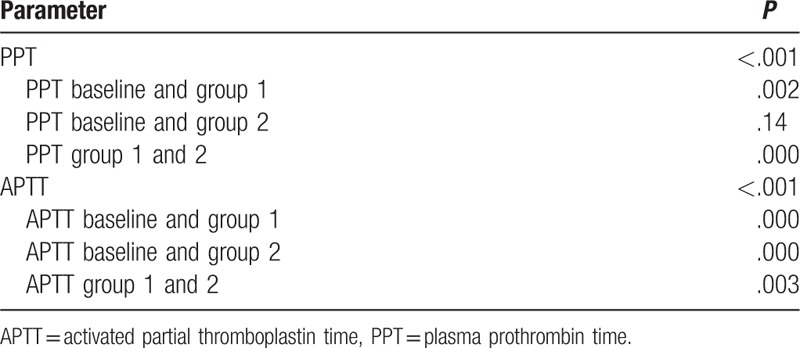
The age, sex, and diagnosis of the sample subjects are summarized in Table 1. The age of the patients ranged between 2.6 and 68 years. The diagnoses were variable. However, this did not affect the PPT and APTT value. The mean ± SD of baseline PPT and APTT assays were in the normal range of 10.54 ± 0.67 for PPT and 28.44 ± 2.54 for APTT (Table 2). All groups of PPT and APTT were within normal distribution, so the data were analyzed with repeated-measures ANOVA test. The result of repeated-measures ANOVA test for either PPT or APTT was significant with P < .001 for comparison between the groups.
Table 1.
Characteristics of samples.

Table 2.
Descriptive analysis of plasma hemoglobin; PPT and APTT before and after lysis test results.

For PPT assays test, the difference of each group was significant except PPT between group 2 and baseline (P = .14). The PPT of group 1 had a significantly shorter time than the baseline (P = .002) and group 2 (P = .000). For APTT assays, group 1 had a significantly shorter APPT than the baseline (P = .000), as did group 2 (P = .000). In addition, group 2 demonstrated significantly shorter times than group 1 (P = .003). The mean ± SD and significance of PPT and APTT results are summarized in Tables 2 and 3.
Table 3.
Significance of PPT and APTT test results.

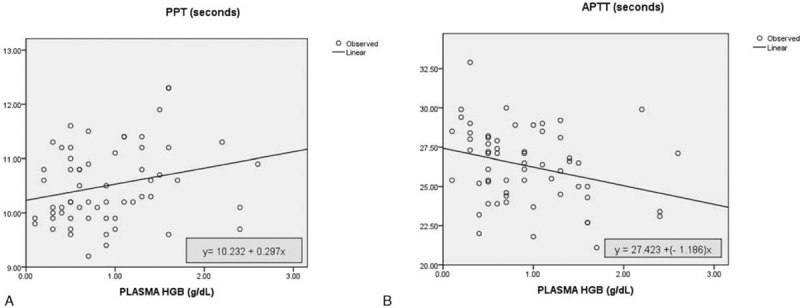
Linear regression was performed to test the effect of hemolysis on PPT and APTT assays. Therefore, we included all samples in group 1 and 2 to be analyzed. The result for PPT was not significant, R = 0.294; P = .06. While result for APTT was significant, R = 0.245; P = .02. The scatter of curve and regression equations is shown in Fig. 1.
Figure 1.

Regression linear curve of plasma hemoglobin level effects on (A) PPT with R = 0.294; P = .06; and (B) APTT with R = 0.245; P = .02.
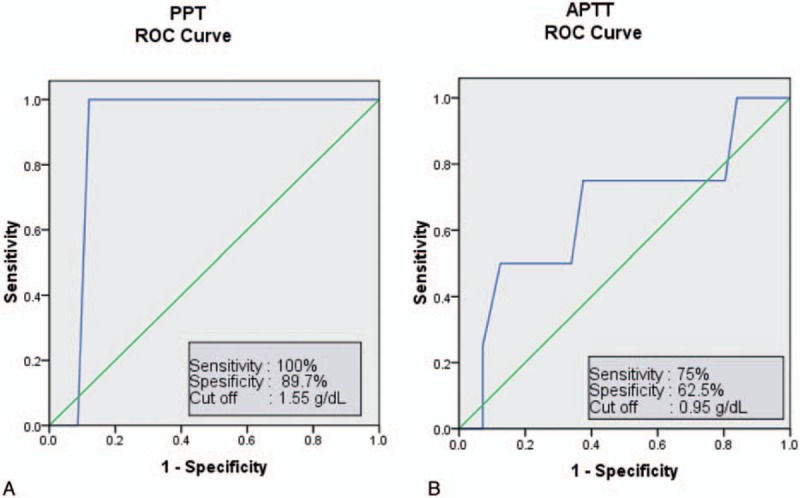
In the ROC curve, the cut-off value for hemolyzed samples to affect PPT examination was a plasma hemoglobin level of 1.55 g/dL with a sensitivity of 100% and a specificity of 87.9%, while for APTT, the plasma hemoglobin should be 0.95 g/dL with a sensitivity of 75% and a specificity of 62.5%. ROC curves for PPT and APTT are shown in Fig. 2.
Figure 2.

ROC curves analysis of plasma hemoglobin level that could affect (A) PPT; at a cut-off plasma hemoglobin level of 1.55 g/dL, the optimum level was achieved in 100% sensitivity and 89.7% specificity; and (B) APTT, at a cut-off plasma hemoglobin level of 0.95 g/dL, the optimum level was achieved in 75% sensitivity and 62.5% specificity.
4. Discussion
Hemolysis causes the release of hemoglobin and internal components of erythrocyte membranes into the plasma. Generally, hemolysis is caused by biochemical, physical, and immunologic mechanisms. In vitro, hemolysis usually happens due to errors in collecting and handling of samples.[13] The prevalence of hemolysis is quite high in laboratory practices and is considered the most common reason for sample rejection in coagulation testing.[3,5] The CLSI recommends not testing the lyzed samples.[9] However, this policy is not supported by the results of some studies.[7,8]
The results of this study revealed that most comparison of groups have a statistically significant difference except PPT comparison of group 2 and baseline. However there was a poor positive correlation between plasma hemoglobin level, PPT, and APPT, this effect being insignificant for PPT. This result agreed with the findings of Laga et al[8] and Arora et al,[7] which clarified that the difference in PPT values between nonhemolyzed and hemolyzed samples from healthy volunteers in which mechanically induced hemolysis performed in vitro was insignificant, even when there was a statistical difference found in patient-subjects, the absolute difference between samples is incredibly small, and was not clinically significant. This assumption is safe if the patient's value is still in the normal range; however, it will be unsafe for patients with values at the upper or lower limits, because these values may have clinically significant implications.
The increased level of plasma hemoglobin causes a shortening of APTT. Some research showed different results for APTT values between nonhemolyzed and hemolyzed samples, which still cannot be explained clearly. This study was identical with the result from Lippi et al[13] in which APTT became shortened in hemolyzed samples from patients with a normal baseline for APTT. Laga et al[8] and Arora et al[7] discovered a shortening of APTT in hemolyzed samples from patient-subjects with normal baseline APTT and a lengthening of APTT in hemolyzed samples from healthy volunteers using photo-optical instruments.
The APTT shortening mechanism in hemolyzed samples has not been ascertained yet. It is presumably caused by the release of phospholipids from erythrocytes and intracellular substances from leukocytes and platelets that can activate the coagulation cascade.[5,14] Other literature mentioned that the activation of the coagulation cascade will set off the shortening of PPT and the decreased levels of fibrinogen, whereas APTT can lengthen or shorten depending on whether there is activation or a loss of fibrinogen.[3] Hemolyzed samples that were immediately examined might have experienced an activation of coagulation, so that the APTT results were shortened. Meanwhile, the hemolyzed samples that were left for some time would have experienced a continuous activation, so that the fibrinogen and the coagulation factors were consumed more and this led to the lengthened APTT results. Testing of hemolyzed samples in this research was carried out as soon as the in vitro induction and all other procedures had been performed, and within 2 hours of phlebotomy. The reason for APTT shortening in patient-subjects and APTT lengthening of healthy volunteers in a previous research was also linked to the low levels of factor VIIa in healthy subjects compared with patient subjects.[8]
This study showed that the mean difference of APTT shortening was not more than 3 seconds between the groups with shorter times for hemolyzed samples. However, these were still in the normal range for APTT values (23–33 seconds). It indicated that the APTT shortening due to hemolysis most likely would not change the results of the interpretation. APTT shortening in hemolyzed samples from patient-subjects (Arora et al[7] and Laga et al[8]) was statistically significant; however, it gave rise to a very small absolute difference between samples, so it was still not clinically significant, whereas APTT lengthening from healthy volunteers was statistically insignificant. The hemolysis effects of shortened APTT but lengthened PPT in this particular research were still difficult to explain because no coagulation factor assay was conducted.
The study of Woolley et al[15] about the effect of hemolysis on PPT and APTT used an instrument with mechanical detection technology, namely a STA-Compact-Max analyzer with different reagents from Diagnostica Stago, Inc. (Asni eres sur Seine, France). This work indicated no significant difference between hemolyzed and nonhemolyzed sample groups in all reagents. In contrast, APTT showed statistically significant shortening in hemolyzed versus nonhemolyzed samples with 2 of 3 test reagents. However, this difference in 1 of 2 reagents was not clinically significant. No correlation was observed between the level of hemolysis and the resulting variation for all assays whatever the reagent used.[15] This result supported the proposal that instruments using photo-optical detection with multiple wavelength methods can overcome the spectral interference that has become a limitation of the photo-optical method to date.
Plasma hemoglobin levels that are capable of affecting PPT and APTT were also observed in this study. According to the literature, Sysmex CS-2100i provides quite good performance on hemolyzed samples and is not affected at plasma hemoglobin level below 0.5 g/dL for PPT and 0.8 g/dL for APTT.[12] Statistical analysis showed that the level of plasma hemoglobin that could affect PPT was ≥1.55 g/dL with a 100% sensitivity and 89.7% specificity, and for APTT was ≥0.95 g/dL with a 75% sensitivity and 62.5% specificity. Plasma hemoglobin at levels ≥0.8 g/dL could affect PPT with a 100% sensitivity and 36.2% specificity, and could affect APTT with a 75% sensitivity and 53.6% specificity. Laga et al[8] stated that PPT and APTT were not affected by hemolysis below plasma hemoglobin levels of 0.64 ± 0.33 g/dL. Visually obvious hemolysis was noticeable if the plasma hemoglobin level was > 0.3 g/dL.[8,13,16] A hemolysis color chart was used in several studies to visually estimate the levels of plasma hemoglobin.[8,17,18] The CLSI's policy to reject all visually obvious hemolytic samples for PPT and APTT tests needs to be reconsidered.
The limitation of this study was the effects of hemolysis on samples with lengthened baselines of PPT and APTT from patients with oral anticoagulant therapy. This aspect was not examined. However, previous studies concluded that samples with marked hemolysis from patients using anticoagulant therapy could be used for PPT analysis performed either by automatic optical or electromechanical instruments.[8,19] Furthermore, this study did not perform coagulation factor assays, so it was not possible to show which intrinsic or extrinsic coagulation pathways were affected by hemolysis. The lysis mechanism of the samples was performed mechanically because it is more similar to daily practices where in vitro hemolysis is commonly caused by mechanical factors.[7,20] However, the mechanical lysis carried out may result in variable tissue factor release, and this has an effect on the shortening or lengthening of PPT and APTT.
5. Conclusion
Not all samples with hemolysis should be rejected for PPT and/or APTT tests by photo-optical methods. The policy rejecting all samples showing hemolysis needs to be reconsidered because the process of taking new samples is time-consuming and causes additional laboratory operating costs as well as patient discomfort.
Further research with a larger sample size is needed and it is advised to perform further coagulation factor assays in order to examine which coagulation factors decrease due to hemolysis, so as to determine the effect on PPT and APTT.
Acknowledgments
We would like to thank the laboratory technicians at the Department of Clinical Pathology of the Dr. Soetomo General Hospital Surabaya for technical support and PT. Saba Indomedika as the reagent and device supplier for their assistance. We thank Yolanda Probohoesodo, MD, for helping improve the English grammar.
Footnotes
Abbreviations: APTT = activated partial thromboplastin time, CLSI = Clinical and Laboratory Standard Institute, D = standard deviation, HGB = hemoglobin, OD = optical density, PPT = plasma prothrombin time, ROC = receiver operating characteristic.
The authors have no conflict of interest.
References
- [1].Laffan M, Manning R. Bain BJ, Bates I, Laffan M, Lewis SM. Investigation of haemostasis. Dacie and Lewis Practical Haematology 11th ed.London: Churchill Livingstone; 2011. 409–12. [Google Scholar]
- [2].Wirawan R. Hematology Laboratory Examination (Pemeriksaan Laboratorium Hematologi). 1st ed. 2011;Jakarta: Badan Penerbit FKUI, 306–316. [Google Scholar]
- [3].Favaloro EJ, Funk DM, Lippi G. Pre-analytical variables in coagulation testing associated with diagnostic errors in hemostasis. Lab Med 2012;43:1–0. [Google Scholar]
- [4].Lippi G, Plebani M, Favaloro EJ. Interference in coagulation testing: focus on spurious hemolysis, icterus and lipemia. Semin Thromb Hemost 2013;39:258–66. [DOI] [PubMed] [Google Scholar]
- [5].Freitas F. What's new about sample quality in routine coagulation testing? Bioanalise/ANO 2015;XI:5–6. [Google Scholar]
- [6].Anggarwal S, Nayak DM, Manohar C. Discrepancy in optical & mechanical method in coagulation tests in a turbid sample. Case report. Indian J Hematol Blood Transfus 2014;30(Suppl 1):S402–4. [DOI] [PMC free article] [PubMed] [Google Scholar]
- [7].Arora S, Kolte S, Dhupia JS. Hemolyzed samples should be processed for coagulation studies: the study of hemolysis effects on coagulation parameters. Ann Med Health Sci Res 2014;4:233–7. [DOI] [PMC free article] [PubMed] [Google Scholar]
- [8].Laga AC, Cheves TA, Sweeney JD. The effect of specimen hemolysis on coagulation test results. Am J Clin Pathol 2006;126:748–75. [DOI] [PubMed] [Google Scholar]
- [9].NCCLS. Procedures for the Collection of Diagnostic Blood Specimens by Venipuncture; Approved Standard—Fifth Edition. NCCLS document H3-A5 [ISBN 1-56238-515-1]. NCCLS, 940 West Valley Road, Suite 1400, Wayne, Pennsylvania 19087-1898 USA, 2003. [Google Scholar]
- [10].Sysmex CS-2100i/CS-2100i/Systems. Siemens Healthineers. Available at: www.healthcare.siemens.com/hemostasis/system/sysmex-cs-21001. Accessed January 04, 2016. [Google Scholar]
- [11].Tantanate C, Teyateeti M, Tientadakul P. Influence of plasma interferences on screening coagulogram and performance evaluation of the automated coagulation analyzer Sysmex CS-2100i. Siriraj Med J 2011;63:151–6. [Google Scholar]
- [12].Sysmex Corporation. Application sheet for aPTT with Dade® Actin® FSL Activated PTT Reagent (Global Assays). Valid from Software version: 00-61: 1–7. [Google Scholar]
- [13].Lippi G, Montagnana M, Salvagno GL, et al. Interference of blood lysis on routine coagulation testing. Arch Pathol Lab Med 2006;130:181–4. [DOI] [PubMed] [Google Scholar]
- [14].Garton S, Larsen AE. Effect of hemolysis on the partial thromboplastin time. Am J Med Technol 1972;38:408–10. [PubMed] [Google Scholar]
- [15].Woolley A, Golmard JL, Kitchen S. Effects of haemolysis, icterus and lipaemia on coagulation tests as performed on Stago STA-Compact-Max analyser. Int J Lab Hematol 2016;38:375–88. [DOI] [PubMed] [Google Scholar]
- [16].Lippi G, Franchini M, Montagnana M, et al. Quality and reliability of routine coagulation testing: can we trust the sample? Blood Coagul Fibrinolysis 2006;17:1–8. [DOI] [PubMed] [Google Scholar]
- [17].Plumhoff EA, Masoner D, Dale JD. Preanalytic Laboratory Errors: Identification and Prevention. Mayo Clinic, Mayo Medical Laboratories; December 2008. Available at: preq.in/images/mayo.pdf. Accessed April 02, 2015. [Google Scholar]
- [18].Zhao J, Kan Q, Wen J, et al. Hemolysis of blood samples has no significant impact on the results of pharmacokinetic data. J Bioequiv Availab 2012;4:82–5. [Google Scholar]
- [19].D’Angelo G, Villa C, Tamborini A, et al. Evaluation of the main coagulation tests in the presence of hemolysis in healthy subjects and patients on oral anticoagulant therapy. Int J Lab Hematol 2015;8:1–6. [DOI] [PubMed] [Google Scholar]
- [20].Stauss M, Sherman B, Pugh L, et al. Hemolysis of coagulation specimens: a comparative study of intravenous draw methods. J Emerg Nurs 2012;38:15–21. [DOI] [PubMed] [Google Scholar]


