Abstract
Background and aims
Either lipopolysaccharide (LPS) or high-fat diet (HFD) enriched with saturated fatty acid (SFA) promotes atherosclerosis. In this study, we investigated the effect of LPS in combination with SFA-rich HFD on atherosclerosis and how LPS and SFA interact to stimulate inflammatory response in vascular endothelial cells.
Methods
Low-density lipoprotein receptor-deficient (LDLR−/−) mice were fed low-fat diet (LFD), HFD with low palmitic acid (PA) (LP-HFD), or HFD with high PA (HP-HFD) for 20 weeks. During the last 12 weeks, half mice received LPS and half received PBS. After treatment, metabolic parameters and aortic atherosclerosis were analyzed. To understand the underlying mechanisms, human aortic endothelial cells (HAECs) were treated with LPS and/or PA and proinflammatory molecule expression was quantified.
Results
Metabolic study showed that LPS had no significant effect on cholesterol, triglycerides, free fatty acids, but increased insulin and insulin resistance. Both LP-HFD and HP-HFD increased body weight and cholesterol while LP-HFD increased glucose and HP-HFD increased triglycerides, insulin, and insulin resistance. Analysis of aortic atherosclerosis showed that HP-HFD was more effective than LP-HFD in inducing atherosclerosis and LPS in combination with HP-HFD increased atherosclerosis in the thoracic aorta, a less common site for atherosclerosis, as compared with LPS or HP-HFD. To understand the mechanisms, results showed that LPS and PA synergistically upregulated adhesion molecules and proinflammatory cytokines in HAECs.
Conclusions
LPS and PA-rich HFD cooperatively increased atherogenesis in the thoracic aorta. The synergy between LPS and PA on proinflammatory molecules in HAECs may play an important role in atherogenesis.
Keywords: Atherosclerosis, Lipopolysaccharides, Saturated fatty acid, Palmitic acid, Inflammation
1. Introduction
A recent large case-control study reported that periodontitis increased the risk of the first myocardial infarction 1. Another recent clinical study also showed an independent association of periodontitis with atherosclerotic cardiovascular disease 2. To understand the mechanisms underlying the linkage between periodontitis and cardiovascular disease, it has been shown that periodontal pathogens accelerated atherosclerosis in animal models 3, 4. Studies have further demonstrated that the pathogen-derived lipopolysaccharide (LPS) is a powerful mediator for vascular inflammation 5, an important cause of atherosclerosis.
The role of LPS in atherosclerosis has been well established in animal models. It has been shown consistently that administration of low dose LPS (10–50 μg/mouse) in atherosclerosis-prone mice induces atherosclerosis 6–11. Our laboratory has demonstrated that antagonizing Toll-like receptor (TLR)4, the receptor for LPS, reduces atherosclerosis 12, 13. Furthermore, it has been shown that deficiency of either TLR4 or myeloid differentiation primary response 88 (MyD88), an adaptor protein that links TLR4 to downstream signaling pathways, attenuated atherosclerosis 14–16.
Mechanistic studies showed that endothelial activation and dysfunction played an essential role in LPS-induced atherogenesis 17, 18. Vascular endothelial cells (ECs) are the first line of vascular cells directly interacting with circulating LPS, which stimulates the expression of adhesion molecules, proinflammatory cytokines and chemokines in ECs that contribute to vascular inflammation and atherosclerosis 17, 18.
In addition to periodontitis, type 2 diabetes, obesity and metabolic syndrome (MetS) are also well known risk factors for cardiovascular disease 19–22. While different pathological factors are involved in these diseases and syndrome, dyslipidemia is a common factor. One of the lipid abnormalities in patients with type 2 diabetes, obesity and MetS are elevated saturated fatty acid (SFA) 23–25. It is known that SFA is a bioactive lipid and, like LPS, contributes to the development of atherosclerosis by boosting vascular inflammation 26, 27.
Since periodontitis is a complication of type 2 diabetes, obesity or MetS 28, patients with type 2 diabetes, obesity or MetS have increased risk of developing periodontitis. When patients with type 2 diabetes, obesity or MetS develop periodontitis, circulating LPS and SFA may be elevated simultaneously. Furthermore, diabetic or obese patients with metabolic endotoxemia, which is defined as increased circulating LPS (endotoxin) as a result of high-fat diet (HFD)-increased gut permeability to endotoxin 29, may also have simultaneously increased levels of both LPS and SFA. However, no study has been conducted to determine if LPS and SFA cooperatively stimulate vascular inflammation and increase atherosclerosis. The findings from the study on the interaction between LPS and SFA will shed new insight into molecular mechanisms involved in the accelerated atherosclerosis in patients with type 2 diabetes, obesity or MetS and reveal the potential targets for developing novel therapeutic strategies for cardiovascular diseases.
In this study, we treated low-density lipoprotein receptor-deficient (LDLR−/−) mice with low dose of LPS and/or HFD enriched with palmitic acid (PA), the most abundant SFA in plasma 30, and determined the combined effects of LPS and PA-rich HFD on atherosclerosis. In addition, in vitro studies with vascular endothelial cells were performed to understand how LPS and PA interact to induce endothelial activation and dysfunction.
2. Materials and methods
2.1. Animals, diets and treatment
Male LDLR−/− mice were purchased from Jackson Laboratory (Bar Harbor, ME) and housed at the animal facility of VA Medical Center in Charleston, SC, USA. The animal protocol was approved by the Institutional Animal Care and Use Committee (IACUC). All mice were maintained on a 12-hour light-dark cycle in a pathogen-free environment and had ad libitum access to water and food. Mice were fed different diets (Supplemental Table 1) (Envigo RMS, Inc. Indianapolis, IN) including low-fat diet (LFD), which is similar to the chow diet, HFD with low PA content (LP-HFD) or HFD with high PA content (HP-HFD) for 20 weeks. The LP-HFD and HP-HFD contain same amount of protein (23.5%), carbohydrate (27.3%) and fat (34.3%) and the only differences between LP-HFD and HP-HFD are that LP-HFD contains 37.0% of saturated fat and 2.8% of PA while HP-HFD contains 92.5% of saturated fat and 8% of PA. During the last 12 weeks, half mice received intraperitoneal injection of LPS (Escherichia coli serotype 055:B5, Sigma, St. Louis, Mo) in 200 μl of phosphate-buffered saline (PBS), 25 μg per mouse, once a week while the other half received equivalent amount of PBS, the vehicle for LPS. After the treatments, metabolic parameters and aortic atherosclerosis in 6 groups were analyzed. The dose of LPS was reported to be effective to induce atherosclerosis by the previous studies 7, 9.
2.2. Metabolic measurements
Blood samples were obtained under the fasted condition and glucose level was determined using a Precision QID glucometer (MediSense Inc., Bedford, MA). Serum cholesterol, low-density lipoprotein (LDL), high-density lipoprotein (HDL) and triglycerides were assayed using Cholestech LDX Lipid monitoring System (Fisher Scientific, Pittsburgh PA). Serum fatty acids were determined using the EnzyChrom™ free fatty acid kit (BioAssay systems, Hayward, CA). Serum fasting insulin was assayed using the Ultra Sensitive Insulin ELISA Kit (Crystal Chem, Inc., Downers Grove, IL, USA). Fasting whole-body insulin sensitivity was estimated with the homeostasis model assessment of insulin resistance (HOMA-IR) according to the formula [fasting plasma glucose (mg/dL) x fasting plasma insulin (μU/mL)]/405 31.
2.3. Analysis of en face atherosclerotic lesions on aorta
Mice were euthanized and aortas from heart to the iliac arteries were dissected out, soaked for 24 h in 4% paraformaldehyde for fixation, excised longitudinally, and then stained with 0.5% of Sudan IV as described previously 32. After staining, the aortas were laid onto the sponge block surface with the intimal surface up and pined down using the Minutien (Fine Science Tools, Inc., San Francisco, CA). The images of the aortas were taken using an EPSON Perfection 2450 photo scanner and analyzed with Image-Pro Plus 6 (Media Cybernetics, Rockville, MD) and the Photoshop software as described 33.
2.4. Histological analysis of atherosclerotic lesions
The tissues of aortic roots were embedded in Tissue-Tek® OCT™ compound (EMS, Hatfied, PA), immediately frozen on dry ice and stored at −80°C. Starting from the aortic root, cryosetions with 6-μm thickness were cut, and sections with a distance of 480 μm were collected and mounted on slides. Slides were fixed in 10% of formaline for 10 minutes, stained with Harris modified hematoxylin (Fisher Scientific, Pittsburgh, PA) for 10 minutes and then rinsed in deionized water. Histological analysis of atherosclerotic lesions was performed as described previously 13.
2.5. Immunohistochemical analysis of protein expression
Aortic roots and liver tissues were fixed in 4% paraformaldehyde for 10 min and frozen sections were made using a cryostate. Immunohistochemical analysis was performed as described previously 13 with anti-F4/80 (Bio-Rad Laboratories, Inc., Hercules, CA), anti-CD68 (AbD Serotec, Raleigh, NC) and anti-intercellular adhesion molecule (ICAM-1) antibodies (Santa Cruz Biotechnology, Inc. Dallas, TX).
2.6. Cell culture and treatment
Human aortic endothelial cells (HAECs) (Life Technologies, Carlsbad, CA) were grown in Medium 200 supplemented with low serum growth supplement (Life Technologies) containing 2% fetal bovine serum, hydrocortisone, human epidermal growth factor, basic fibroblast growth factor and heparin. The HAEC cultures were 100% confluent before the treatments. For cell treatment, E. coli LPS and PA (Sigma, St. Louis, MO) were used. The LPS was highly purified by phenol extraction and gel filtration chromatography and was cell culture tested. PA used in this study was bovine serum albumin-free 34. To prepare PA, PA was dissolved in 0.1 N NaOH and 70% ethanol at 70°C to make PA solution at concentration of 50 mM. The solution was kept at 55°C for 10 min, mixed, and brought to room temperature.
2.7. Enzyme-linked immunosorbent assay
Cytokines in medium were quantified using sandwich enzyme-linked immunosorbent assay (ELISA) kits according to the protocol provided by the manufacturer (Biolegend, San Diego, CA).
2.8. Immunoblotting
Membrane and cytoplasmic proteins were isolated as described previously 35. Thirty micrograms of protein from each sample was electrophoresed in a 10% polyacrylamide gel. After transferring proteins to a PVDF membrane, immunoblotting was performed as described previously 36 with antibodies against ICAM-1, VCAM-1 (Santa Cruz Biotechnology, Inc.), glyceraldehyde 3-phosphate dehydrogenase (GAPDH) and beta actin (Cell Signaling Technology, Inc. Danvers, MA).
2.9. RNA isolation and quantitative real-time polymerase chain reaction (PCR)
RNA was extracted from cells and quantitative real-time PCR was performed as described previously 37. The primers (Supplemental Table II) were synthesized (Integrated DNA Technologies, Inc., Coralville, IA). Data were analyzed with the iCycler iQ™ software (Bio-Rad Laboratories). The average starting quantity (SQ) of fluorescence units was used for analysis. Quantification was calculated using the SQ of targeted cDNA relative to that of GAPDH cDNA in the same sample.
2.10. PCR array
Human TLR signal pathway PCR array (Qiagen, Santa Clarita, CA) was used to profile gene expression according to the instructions from the manufacturer.
2.11. Treatment of cells with TLR4 antibody, sulfosuccinimidyl oleate (SSO) and inhibitors of MAPK and NFκB pathways
HAECs were treated with 0.5 ng/ml LPS, 100 μM PA or LPS plus PA in the absence or presence of 5 μg/ml of neutralizing TLR4 antibody (R&D System, Minneapolis, MN), 5 or 10 μM of sulfosuccinimidyl oleate (SSO) (Cayman Chemical, Ann Arbor, MI), 5 μM of PD98059, SP600125, SB203580, or 1 μM of Bay117085 (Calbiochem/EMD Biosciences, Inc., San Diego, CA) for 24 h. After the treatment, IL-6 in medium was quantified using ELISA. In a control experiment, the effect of dimethyl sulfoxide (DMSO), the solvent for SSO preparation, on IL-6 expression was excluded (data not shown).
2.12. Statistic analysis
GraphPad Instat statistical software (Version 5.0) (GraphPad Software, Inc. La Jolla, CA) was used for statistical analysis. The one-way analysis of variance (ANOVA) was used to analyze the data from multiple groups. For data with normal distribution, Student’s t test was used for comparison of means between 2 experimental groups. For data without normal distribution, nonparametric analysis using Mann-Whitney test was performed to determine the statistical significance of differences between two experimental groups. A value of p< 0.05 was considered significant.
3. Results
3.1. Metabolic parameters for mice fed different diets and treated with or without LPS
The metabolic parameters for 6 groups of mice treated with different diets in combination with or without LPS (Table 1) were measured at the end of study.
Table 1.
Diets and LPS treatment
| Groups | Diet | LPS | Number | |
|---|---|---|---|---|
| 1 | LFD | Low-fat diet | − | 7 |
| 2 | LPS | Low-fat diet | + | 7 |
| 3 | LP-HFD | Low palmitic acid-containing high fat diet | − | 6 |
| 4 | LP-HFD + LPS | Low palmitic acid-containing high fat diet | + | 9 |
| 5 | HP-HFD | High palmitic acid-containing high fat diet | − | 6 |
| 6 | HF-HFD + LPS | High palmitic acid-containing high fat diet | + | 8 |
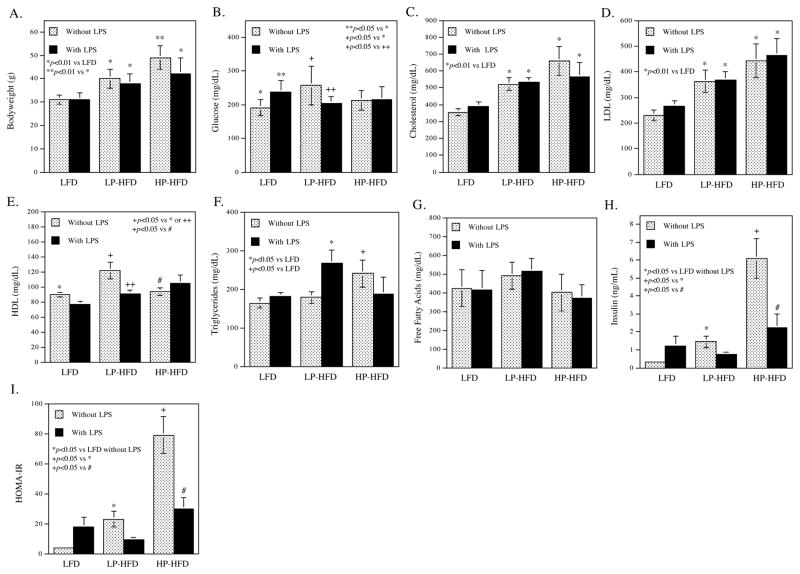
Bodyweight (Fig. 1A)
Figure 1.
The effect of LPS and diets on metabolic parameters.
Metabolic parameters including bodyweight (A), glucose (B), Cholesterol (C), LDL (D), HDL (E), triglycerides (F), free fatty acids (G), insulin (H) and homeostasis model assessment of insulin resistance (HOMA-IR) (I) were determined. The data presented are mean ± SD (n=6–9).
Either high-fat diet with low palmitic acid (LP-HFD) or high-fat diet with high PA (HP-HFD) significantly increased bodyweight as compared with low-fat diet (LFD), but the increase of bodyweight was higher in HP-HFD than in LP-HFD mice. LPS treatment reduced bodyweight in mice fed HP-HFD.
Glucose (Fig. 1B)
LPS increased glucose in mice fed LFD, but not in mice fed either LP-HFD or HP-HFD. LP-HFD, but not HP-HFD, increased glucose as compared to LFD.
Lipids (Fig. 1C–G)
Both LP-HFD and HP-HFD increased serum total cholesterol and LDL cholesterol as compared to LFD (Fig. 1C and D). However, LP-HFD, but not HP-HFD, increased HDL (Fig. 1E). Interestingly, the addition of LPS to LP-HFD neutralized the effect of LP-HFD on HDL. LPS increased triglycerides in mice fed LP-HFD (Fig. 1F). While HP-HFD alone increased triglycerides as compared to LFD, addition of LPS to HP-HFD did not significantly change the level of triglycerides (Fig. 1F). LPS, LP-HFD and HP-HFD had no significant effect on free fatty acids (Fig. 1G).
Insulin and insulin resistance (HOMA-IR) (Fig. 1H and I)
LPS stimulated insulin production in mice fed LFD and either LP-HFD or HP-HFD also increased insulin as compared to LFD. The level of insulin was higher in mice fed HP-HFD than those fed LP-HFD (Fig. 1H). LPS attenuated the stimulatory effect of HP-HFD on insulin (Fig. 1H). The effects of LPS, LP-HFD and HP-HFD on insulin resistance (HOMA-IR) were similar to those on insulin (Fig. 1I).
3.2. LPS and HP-HFD increase hepatic inflammation and circulating proinflammatory cytokines
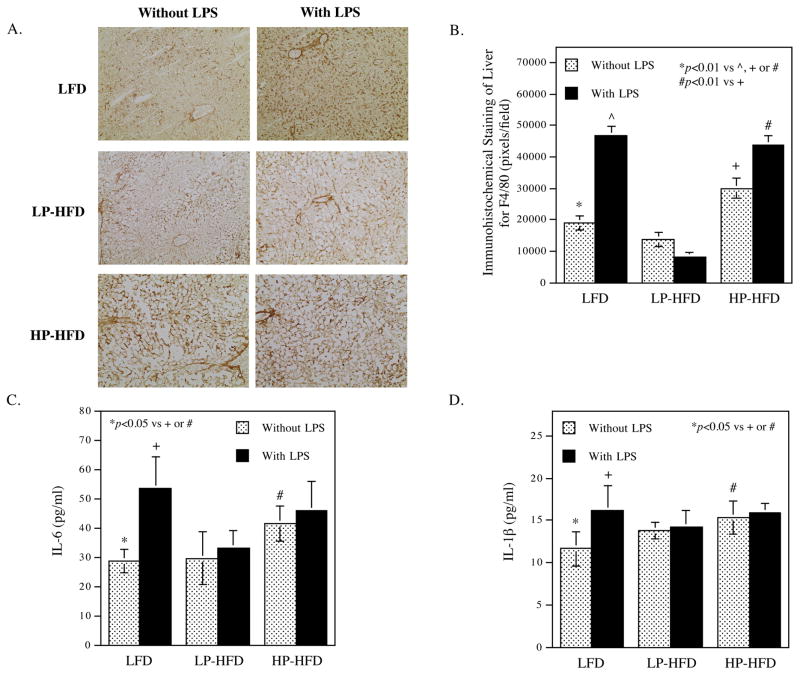
In this study, we determined the effect of LPS and HP-HFD on hepatic inflammation by immunohistochemical staining of F4/80, a mouse macrophage marker, in livers. Results showed that LPS and HP-HFD, but not LP-HFD, markedly increased F4/80-positive cells (Fig. 2A and B), indicating that LPS and HP-HFD, but not LP-HFD, increased macrophage content and hepatic inflammation. To confirm that LPS and HP-HFD increase systemic inflammation, we quantified the circulating proinflammatory cytokines IL-6 and IL-1β. Results showed that mice fed HP-HFD had increased IL-6 (Fig. 2C) and IL-1β, but mice fed LP-HFD did not. LPS also increase IL-6 and IL-1β levels in mice fed LFD but did not further increase the cytokine levels in mice fed either LP-HFD or HP-HFD (Fig. 2C and D).
Figure 2.
The effect of LPS and diets on hepatic and systemic inflammation.
(A and B) After mice were treated with LPS or vehicle PBS in combination with LFD, LP-HFD, or HP-HFD, livers were dissected and subjected to immunohistochemical staining of F4/80 to detect macrophages. Representative photomicrographs of hepatic tissue sections with F4/80 immunostaining for all 6 groups (A) and quantification of F4/80-positive staining area (B) were shown. C and D. Serum IL-6 (C) and IL-1β (D) were quantified at the end of the study. The data presented are mean ± SD (n=6–9).
3.3. LPS and HFD-HS cooperatively increase atherosclerosis in the thoracic aortas
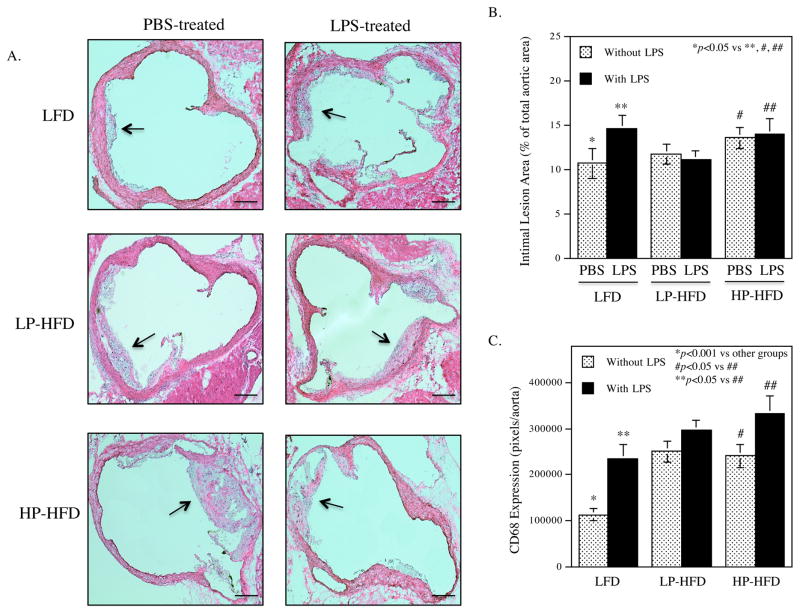
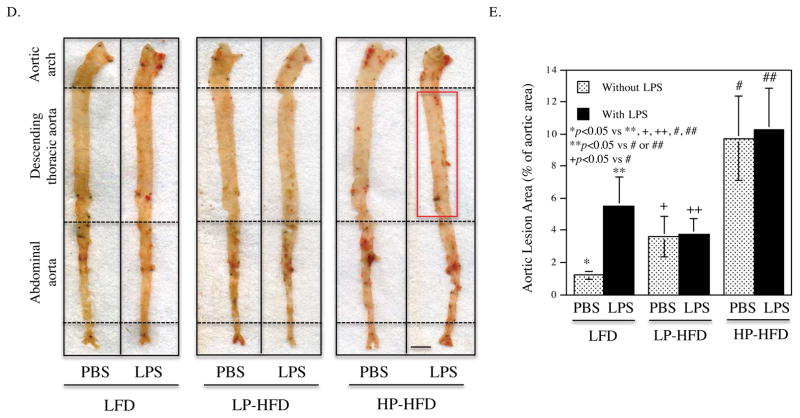
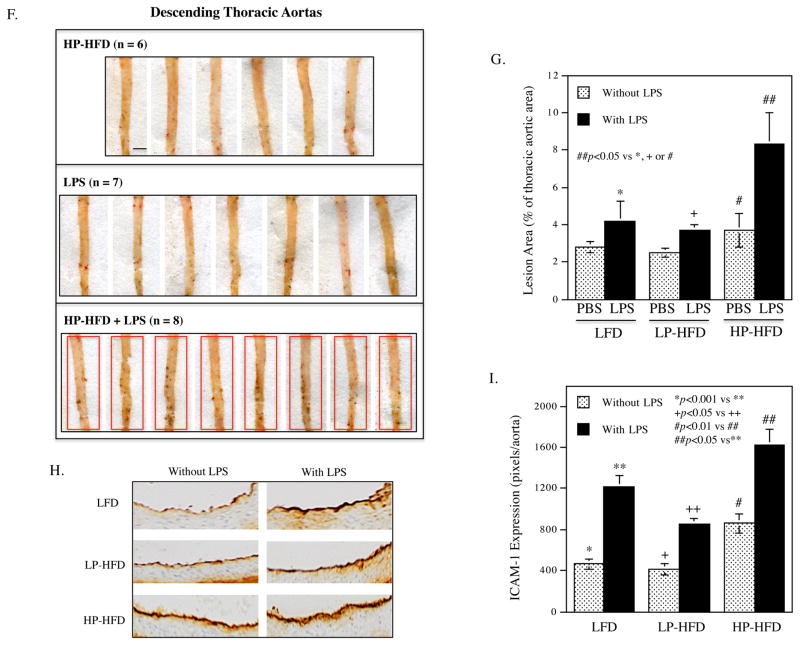
Histological analysis of atherosclerotic lesions of aortic roots showed that LPS or HP-HFD, but not LP-HFD, increased intimal lesions (Fig. 3A and B), but administration of LPS to mice fed HP-HFD did not result in further increase of the intimal lesions. Detection of monocytes and macrophages using immunohistochemical staining of CD68 showed that LPS, LP-HFD or HP-HFD increased macrophages and the combination of LPS and HP-HFD increased more macrophages than LPS or HF-HFD alone (Fig. 3C). Quantification of the en face Sudan VI-stained atherosclerotic lesions showed that LPS, LP-HFD or HP-HFD significantly increased atherosclerotic lesions as compared to LFD (Fig. 3D and E). Furthermore, mice fed HP-HFD presented increased atherosclerotic lesions when compared with mice fed LP-HFD. However, the administration of LPS to mice fed HP-HFD did not further increase atherosclerotic lesions (Fig. 3D and E). Interestingly, we found that the combination of LPS and HP-HFD increased more atherosclerotic lesion in the descending thoracic aorta, a less common site for atherosclerotic lesions 38, when compared with LPS and HP-HFD alone (Fig. 3F and G). Immunohistochemical staining of ICAM-1 in aortas showed that while LPS or HP-HFD increased ICAM-1 expression, the combination of LPS and HP-HFD achieved an additive effect on ICAM-1 expression (Fig. 3H and I).
Figure 3.
The effect of LPS and diets on atherosclerotic lesions in LDLR−/− mice.
(A) Representative photomicrographs of H/E stained cross-sections of aortic roots of mice treated with LPS or vehicle PBS in combination with LFD, LP-HFD, or HP-HFD. Scale bar=500 μm. (B) Quantification of intimal lesion area of atherosclerotic plaques in the aortic roots (mean ± SD). (C) Quantification of CD68-positive staining areas of the cross-sections of aortic roots. (D) Sudan VI-stained en face atherosclerotic lesions of aortas of mice treated with LPS or vehicle PBS in combination with LFD, LP-HFD, or HP-HFD. The increased atherosclerotic lesions on the thoracic aortas of mouse treated with HP-HFD and LPS were indicated by a red rectangle. Scale bar=0.2 cm. (E) Quantification of the area with positive Sudan IV staining in the total aortas (mean ± SD, n=7–9). (F) Sudan VI-stained en face atherosclerotic lesions on the thoracic aortas of mice treated with HP-HFD, LPS or the combination of HP-HFD and LPS. Increased lesions in mice treated with HP-HFD and LPS are indicated by red rectangles. Scale bar=0.2 cm. (G) Quantification of area with positive Sudan IV staining in the cross-sections of thoracic aortas (mean ± SD, n=6–9). (H) Representative photomicrographs of ICAM-1 immunohistochemical staining of aortic roots of mice treated with LPS or vehicle PBS in combination with LFD, LP-HFD, or HP-HFD. (I) Quantification of ICAM-1 expression in tissue sections of aortic roots (mean ± SD, n=6–9).
3.4. PA and LPS have a synergy on vascular endothelial cell activation and dysfunction
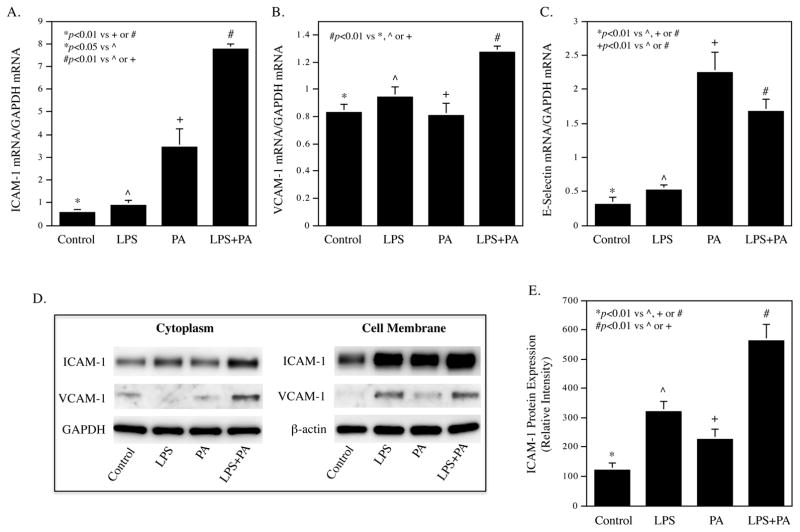
To explore the mechanisms whereby HP-HFD and LPS cooperatively increases atherosclerotic lesions in the descending thoracic aorta, we focused our study on vascular endothelial cells (ECs) activation. ECs are the first line of vascular cells to expose to circulating SFAs and LPS, and EC activation and dysfunction play an important role in the early stage of atherosclerosis 39. Our in vitro study showed that LPS and PA synergistically enhanced the expression of ICAM-1 and vascular cell adhesion molecule (VCAM)-1 in HAECs (Fig. 4A and B). Results also showed that while PA strongly increased E-selectin expression, the addition of LPS did not further increase the experiment of E-selectin (Fig. 4C). Immunoblotting showed that the combination of LPS and PA increased more ICAM-1 protein expression in both cytoplasm and membrane of HAECs than LPS or PA alone (Fig. 4D and E). Results also showed that the combination of LPS and PA increased more VCAM-1 protein in the cytoplasm, but not cell membrane, than LPS or PA alone. In addition to the adhesion molecules, we also investigated the effect of LPS and PA on proinflammatory cytokine expression in HAECs since upregulation of proinflammatory cytokines is a feature of EC activation and dysfunction 40. Using a PCR array to profile gene expression related to TLR-mediated pathways, we found that LPS and PA synergistically stimulate the expression of several proinflammatory molecules such as granulocyte/macrophage colony-stimulating factor (CSF2), granulocyte-colony stimulating factor (CSF3), IL-6, IL-8, and PTGS2, also called cyclooxygenase 2 (COX2) (Table 2).
Figure 4.
LPS in combination with PA increases adhesion molecule and IL-6 expression in HAECs.
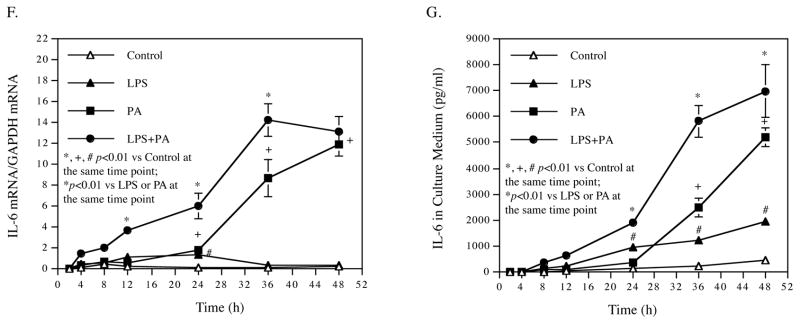
(A–C) HAECs were treated with 0.5 ng/ml of LPS, 100 μM of PA or LPS plus PA for 24 h and ICAM-1 mRNA (A), VCAM-1 mRNA (B) and E-selectin mRNA (C) were quantified using real-time PCR. (D) Immunoblotting of ICAM-1 and VCAM-1 in cytoplasma and membrane. HAECs were treated as described above and the ICAM-1 and VCAM-1 protein in cytoplasma and membrane was detected using immunoblotting. GAPDH and β-actin were also detected as control. € Quantification of membrane ICAM-1 (n=2). (F and G) Time courses of IL-6 mRNA expression (F) and IL-6 secretion (G). HAECs were treated with 0.5 ng/ml of LPS, 100 μM of PA or LPS plus PA for 2, 4, 8, 12, 24, 36 and 48 h. At each time point, total RNA was isolated from cells and culture medium was collected for quantification of IL-6 mRNA using real-time PCR and secreted IL-6 protein using ELISA, respectively. The data (mean ± SD) presented are representative of 3 experiments with similar results.
Table 2.
Synergistic effect of LPS and PA on expression of proinflammatory molecules
| Gene name | Ct | Fold increase by | |||||
|---|---|---|---|---|---|---|---|
| Control | LPS | PA | LPS+PA | LPS | PA | LPS+PA | |
| CCL2 | 23.77 | 21.37 | 22.17 | 20.87 | 5.27 | 3.03 | 7.43 |
| CSF2 | 30.41 | 28.32 | 28.58 | 26.83 | 4.27 | 3.57 | 11.93 |
| CSF3 | 29.07 | 25.37 | 27.84 | 24.44 | 12.98 | 2.35 | 24.80 |
| IL1A | 28.02 | 26.77 | 26.46 | 25.81 | 2.38 | 2.95 | 4.63 |
| IL1B | 29.66 | 28.71 | 28.16 | 27.95 | 1.93 | 2.83 | 3.26 |
| IL6 | 24.66 | 23.40 | 24.28 | 22.99 | 2.39 | 1.30 | 3.17 |
| IL8 | 21.60 | 20.42 | 20.90 | 19.54 | 2.26 | 1.62 | 4.16 |
| NFKB2 | 28.05 | 26.79 | 26.88 | 26.44 | 2.38 | 2.24 | 3.05 |
| NFKBIA | 25.08 | 23.94 | 24.11 | 23.33 | 2.21 | 1.96 | 3.36 |
| PTGS2 | 26.83 | 26.49 | 24.85 | 24.32 | 1.27 | 3.96 | 5.71 |
| RIPK2 | 26.61 | 26.12 | 25.93 | 25.49 | 1.40 | 1.60 | 2.17 |
Human aortic endothelial cells were treated with or without 0.5 ng/ml of LPS, 100 μM of PA or both for 12 h. RNA was isolated from the cells and subjected to PCR array. Human Toll-like receptor (TLR) signal pathway PCR array (Qiagen, Santa Clarita, CA) was used to profile gene expression according to the instructions from the manufacturer. RNA isolated from duplicate wells was combined and converted to cDNA and then amplified by PCR. Data analysis is based on the delta-delta threshold cycle (ΔΔCt) method: The ΔCt was calculated by subtracting Ct for GAPDH from Ct for genes of interest and the ΔΔCt was calculated by subtracting the ΔCt for control cells from ΔCt for treated cells. The fold change was calculated as 2−ΔΔCt.
Full names for some genes in the table: CCL2: Monocyte chemotactic protein-1; CSF2: Granulocyte/macrophage colony-stimulating factor; IL1A: Interleukin-1 alpha; NFKB2: Nuclear Factor Kappa B Subunit 2; NFKBIA: nuclear factor of kappa light polypeptide gene enhancer in B-cells inhibitor; PTGS2: prostaglandin-endoperoxide synthase 2 or cyclooxygenase 2 (COX2); RIPK2: Receptor Interacting Serine/Threonine Kinase 2
To validate the findings from the PCR array, we quantified IL-6 mRNA and secretion by HAECs in response to LPS, PA or LPS plus PA. Results showed that while either LPS or PA stimulated IL-6 mRNA expression and secretion in a time-dependent manner, the combination of LPS and PA had a synergistic effect on IL-6 expression and secretion (Fig. 4F and G).
3.5. LPS and PA activate endothelial cells via TLR4 and CD36
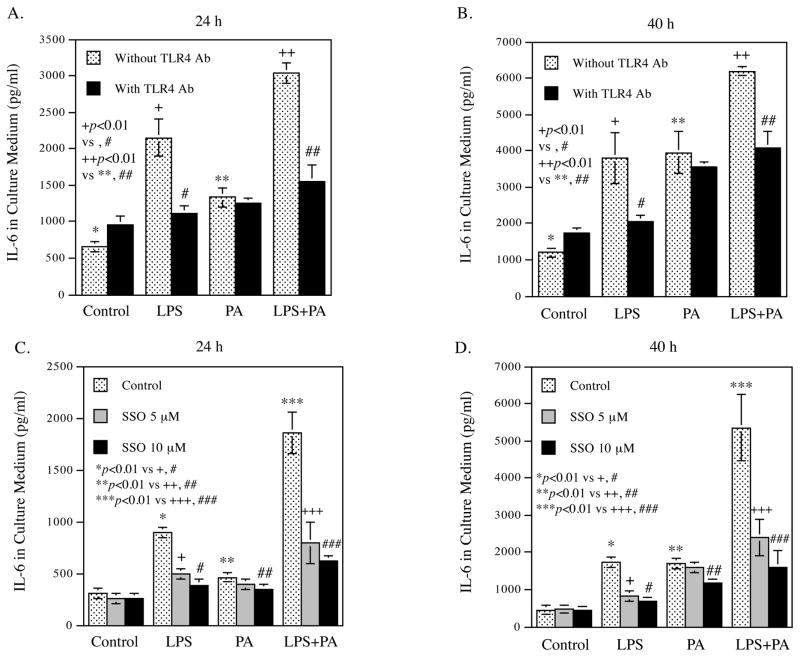
To further elucidate how LPS or PA interacts with HAECs, we first determined the receptors engaged by LPS and PA. Results showed that the TLR4 neutralizing antibody specifically abolished the stimulation of IL-6 secretion by LPS, but not by PA, at 24 h and 40 h (Fig. 5A and B). These findings confirm that TLR4 is the receptor for LPS, but not PA.
Figure 5.
The effects of TLR4 blocking and CD36 inhibition on IL-6 secretion by HAECs treated with LPS, PA or LPS plus PA.
HAECs were treated with 0.5 ng/ml of LPS, 100 μM of PA or LPS plus PA for 24 h or 40 h in the presence or absence of neutralizing TLR4 antibody (A and B) or SSO (C and D). After the treatment, IL-6 in culture medium was quantified using ELISA. The data (mean ± SD) presented are representative of 3 experiments with similar results.
Since it has been reported that CD36 is responsible for the engagement and uptake of PA 41, we applied SSO, a specific inhibitor of CD36 42, to investigate whether or not it would block the stimulatory effect of PA via CD36. Results showed that SSO significantly inhibited IL-6 secretion stimulated by not only PA, but also LPS (Fig. 5C and D), which is consistent with the previous report that CD36 is the receptor engaged by not only free fatty acids, but also LPS in a TLR4-independent manner 43. Taken together, these results indicate that while TLR4 is involved in the stimulatory effect of LPS, CD36 mediates the effects of both PA and LPS on HAEC activation.
3.6. Both LPS and PA activate HAECs via the MAPK and NFκB pathways
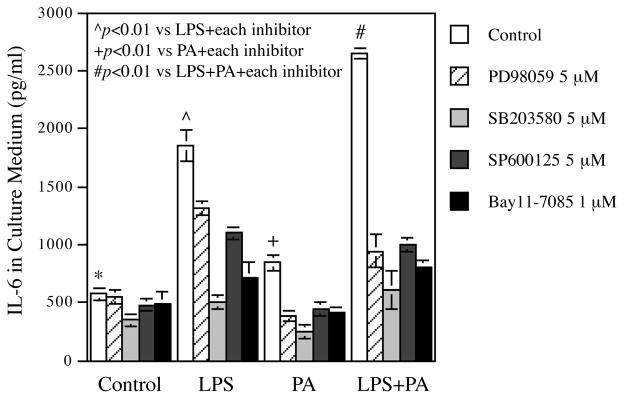
It is known that LPS activates ECs via multiple signaling pathways such as MAPK (ERK, p38, JNK) and NFκB pathway 44. To determine if these pathways are also involved in PA-elicited EC activation, we treated HAECs with LPS, PA or LPS plus PA in the absence or presence of pharmacological inhibitors specific for the different signaling pathways. Results showed that PD98059, SB293580, SP600125, and Bay11-7085, the inhibitors for ERK, p38, JNK and NFκB pathways, respectively, inhibited IL-6 secretion stimulated by LPS, PA or LPS plus PA (Fig. 6), indicating that either LPS or PA activates ECs via the MAPK and NFκB pathways.
Figure 6.
Inhibition by pharmacological inhibitors of IL-6 secretion stimulated by LPS, PA or LPS plus PA.
HAECs were treated with 0.5 ng/ml of LPS, 100 μM of PA or LPS plus PA in the absence or presence of 5 μM of PD98059, SP600126, or SB203580, or 1 μM of Bay11-7085 for 24 h. After the treatment, IL-6 in culture medium was quantified. The data (mean ± SD) presented are representative of 3 experiments with similar results.
4. Discussion
Our current study showed that chronic challenge of LDLR−/− mice with low dose of LPS increased aortic atherosclerotic lesions through a cholesterol-independent mechanism since LPS had no effect on serum cholesterol. Although LPS increased glucose by 22%, this moderate glucose increase is unlikely to be a major factor responsible for the 5.5-fold increase in atherosclerotic lesions. Given that LPS treatment nearly doubled serum IL-6 level and also significantly increased serum IL-1β, our study suggests that the induction of a systemic inflammation by LPS is responsible for the accelerated atherogenesis, which is in agreement with Cuaz-Perolin et al. who reported that a natural inhibitor of proinflammatory transcription factor NFκB reduced expression of proinflammatory cytokines and atherosclerotic lesions in apolipoprotein E-deficient mice challenged with LPS 8.
Our study showed that either HP-HFD or LP-HFD induced atherosclerotic lesion as compared to LFD. However, HP-HFD is much more potent than LP-HFD in inducing atherosclerosis. A possible reason behind the higher effectiveness of HP-HFD to induce atherosclerotic lesions than LP-HFD may be the fact that, as our study showed, HP-HFD, but not LP-HFD, significantly increased serum inflammatory cytokines such as IL-6 and IL-1β. Since the major difference between HP-HFD and LP-HFD is the high PA content in the former, this finding indicates that PA is a powerful bioactive lipid to boost the systemic inflammation.
The quantification of atherosclerotic lesions in aortas clearly showed that HP-HFD or LPS acted similarly in inducing total aortic atherosclerosis. The possibility that administering LPS to mice fed HP-HFD would further increase the atherosclerotic lesions was tested and showed interesting results. Although administering LPS to mice fed HP-HFD did not increase atherosclerotic lesions in the entire aorta, significantly increased lesions in the descending thoracic aorta were observed. This finding is interesting since the descending thoracic aorta is a less common site for developing atherosclerosis as compared with aortic root and abdominal aorta 38. A possible explanation for the increase in atherosclerosis in the thoracic aortas but not in the aortic root and abdominal aorta when LPS is administered with HP-HFD is the marked difference in hemodynamic forces between these sites.
It has been postulated that the hemodynamic forces are largely responsible for dictating which vascular sites are susceptible to developing atherosclerosis by priming the endothelial phenotype to respond distinctly to systemic risk factors such as high lipids 38. It is likely that either LPS or HP-HFD already maximizes endothelial activation/dysfunction in the aortic root and abdominal aorta where dominant hemodynamic forces are always present. Therefore, LPS in combination with HP-HFD did not further increase atherosclerosis in aortic root and abdominal aorta. In contrast, since the hemodynamic forces against the descending thoracic aorta are much less than those against the aortic root or abdominal aorta, LPS and HP-HFD could exert a cooperative stimulation on endothelial activation and dysfunction, resulting in increased atherosclerotic lesions in the descending thoracic aorta.
Another interesting finding from our metabolic study was that HP-HFD feeding remarkably increased insulin. While LP-HFD increased serum insulin level by 4.7-fold, HP-HFD increased it by 20-fold. Several previous clinical studies have reported that saturated fat intake is a risk factor for hyperinsulinemia 45–47. Folsom et al. reported a positive correlation between saturated fatty acid percentage in plasma phospholipids and insulin level 45. Rasmussen et al. showed that saturated fatty acids increased a higher level of insulin than monounsaturated fatty acids 46. Obviously, the results from our current animal study are in line with these clinical findings. To understand why saturated fatty acids are associated with insulin level, Thams et al. showed that PA stimulated insulin release from pancreatic islets via protein kinase C pathway 47. In addition to the potent stimulation by HP-HFD of insulin production, our study showed that HP-HFD also increased insulin resistance. Despite a 20-fold increase in insulin by HP-HFD feeding, the glucose in mice fed HP-HFD was not reduced at all, indicating the presence of a strong insulin resistance. Insulin resistance is well known to be associated to atherosclerosis in type 2 diabetes and metabolic syndrome 48, 49.
The findings from our in vitro studies support our hypothesis that LPS and PA cooperatively stimulate vascular inflammatory process. The assessments of the expression of proinflammatory molecules in HAECs in response to LPS, PA or LPS plus PA using real-time PCR, ELISA and PCR array consistently showed that LPS and PA synergistically stimulate the expression of adhesion molecules and important proinflammatory cytokines such as CSF2, CSF3, IL-6, IL-8, and COX2. Further studies showed that TLR4 was the receptor for LPS, but not PA, and CD36 was engaged by both PA and LPS. Since the inhibition of CD36 by SSO effectively inhibited IL-6 secretion stimulated by not only LPS, but also PA, these results suggest that CD36 is a better target than TLR4 to attenuate the synergistic effects of LPS and PA on IL-6 secretion. Another interesting finding is that PA acts similarly as LPS to upregulate expression of proinflammatory molecules via MAPK and NFκB pathways. This finding is consistent with the previous reports that CD36 with two transmembrane domains and short cytoplasmic tails links to MAPK, NFκB and Rho signaling pathways 50.
In conclusions, we have demonstrated that while either LPS or HP-HFD induced aortic atherosclerosis, LPS in combination with HP-HFD increased atherosclerotic lesions to a higher extent in the descending thoracic aorta of LDLR−/− mice. We have also explored the underlying mechanisms and shown that LPS and PA synergistically stimulate pro-inflammatory gene expression in vascular ECs known to play a crucial role in vascular inflammation and atherosclerosis.
Supplementary Material
Highlights.
LPS and high-fat diet with high palmitate act in concert in atherogenesis.
LPS and palmitate synergistically stimulate adhesion molecules in endothelium.
LPS and palmitate synergistically stimulate cytokines in endothelium.
LPS engages Toll-like receptor 4/CD36 while PA engages CD36.
Both LPS and PA stimulate gene expression via MAPK and NFκB signaling pathways.
Acknowledgments
Financial support
This work was supported by a Merit Review grant from the Biomedical Laboratory Research (Y.H.) and Development Program of the Department of Veterans Affairs and NIH grant R01 DE016353 (Y.H.).
Footnotes
Conflict of interest
The authors declared they do not have anything to disclose regarding conflict of interest with respect to this manuscript.
Author contributions
YH and MFL designed the study, analyzed data, and drafted the manuscript. ZL, YL, CWB, performed animal treatments, tissue processes and analysis, cell culture/treatments and gene expression analysis. All authors provided review of the manuscript and have read and approved the submitted manuscript.
Publisher's Disclaimer: This is a PDF file of an unedited manuscript that has been accepted for publication. As a service to our customers we are providing this early version of the manuscript. The manuscript will undergo copyediting, typesetting, and review of the resulting proof before it is published in its final citable form. Please note that during the production process errors may be discovered which could affect the content, and all legal disclaimers that apply to the journal pertain.
References
- 1.Ryden L, Buhlin K, Ekstrand E, et al. Periodontitis Increases the Risk of a First Myocardial Infarction: A Report From the PAROKRANK Study. Circulation. 2016;133:576–583. doi: 10.1161/CIRCULATIONAHA.115.020324. [DOI] [PubMed] [Google Scholar]
- 2.Beukers NG, van der Heijden GJ, van Wijk AJ, et al. Periodontitis is an independent risk indicator for atherosclerotic cardiovascular diseases among 60 174 participants in a large dental school in the Netherlands. J Epidemiol Community Health. 2017;71:37–42. doi: 10.1136/jech-2015-206745. [DOI] [PMC free article] [PubMed] [Google Scholar]
- 3.Bale BF, Doneen AL, Vigerust DJ. High-risk periodontal pathogens contribute to the pathogenesis of atherosclerosis. Postgrad Med J. 2017;93:215–220. doi: 10.1136/postgradmedj-2016-134279. [DOI] [PMC free article] [PubMed] [Google Scholar]
- 4.Jia R, Kurita-Ochiai T, Oguchi S, et al. Periodontal pathogen accelerates lipid peroxidation and atherosclerosis. J Dent Res. 2013;92:247–252. doi: 10.1177/0022034513475625. [DOI] [PubMed] [Google Scholar]
- 5.Smith BJ, Lightfoot SA, Lerner MR, et al. Induction of cardiovascular pathology in a novel model of low-grade chronic inflammation. Cardiovasc Pathol. 2009;18:1–10. doi: 10.1016/j.carpath.2007.07.011. [DOI] [PubMed] [Google Scholar]
- 6.Ostos MA, Recalde D, Zakin MM, et al. Implication of natural killer T cells in atherosclerosis development during a LPS-induced chronic inflammation. FEBS letters. 2002;519:23–29. doi: 10.1016/s0014-5793(02)02692-3. [DOI] [PubMed] [Google Scholar]
- 7.Westerterp M, Berbee JF, Pires NM, et al. Apolipoprotein C-I is crucially involved in lipopolysaccharide-induced atherosclerosis development in apolipoprotein E-knockout mice. Circulation. 2007;116:2173–2181. doi: 10.1161/CIRCULATIONAHA.107.693382. [DOI] [PubMed] [Google Scholar]
- 8.Cuaz-Perolin C, Billiet L, Bauge E, et al. Antiinflammatory and antiatherogenic effects of the NF-kappaB inhibitor acetyl-11-keto-beta-boswellic acid in LPS-challenged ApoE−/− mice. Arterioscler Thromb Vasc Biol. 2008;28:272–277. doi: 10.1161/ATVBAHA.107.155606. [DOI] [PubMed] [Google Scholar]
- 9.Malik TH, Cortini A, Carassiti D, et al. The alternative pathway is critical for pathogenic complement activation in endotoxin- and diet-induced atherosclerosis in low-density lipoprotein receptor-deficient mice. Circulation. 2010;122:1948–1956. doi: 10.1161/CIRCULATIONAHA.110.981365. [DOI] [PMC free article] [PubMed] [Google Scholar]
- 10.Gitlin JM, Loftin CD. Cyclooxygenase-2 inhibition increases lipopolysaccharide-induced atherosclerosis in mice. Cardiovasc Res. 2009;81:400–407. doi: 10.1093/cvr/cvn286. [DOI] [PMC free article] [PubMed] [Google Scholar]
- 11.Andoh Y, Ogura H, Satoh M, et al. Natural killer T cells are required for lipopolysaccharide-mediated enhancement of atherosclerosis in apolipoprotein E-deficient mice. Immunobiol. 2013;218:561–569. doi: 10.1016/j.imbio.2012.07.022. [DOI] [PMC free article] [PubMed] [Google Scholar]
- 12.Lu Z, Zhang X, Li Y, et al. TLR4 antagonist reduces early-stage atherosclerosis in diabetic apolipoprotein E-deficient mice. J Endocrinol. 2013;216:61–71. doi: 10.1530/JOE-12-0338. [DOI] [PubMed] [Google Scholar]
- 13.Lu Z, Zhang X, Li Y, et al. TLR4 antagonist attenuates atherogenesis in LDL receptor-deficient mice with diet-induced type 2 diabetes. Immunobiol. 2015;220:1246–1254. doi: 10.1016/j.imbio.2015.06.016. [DOI] [PMC free article] [PubMed] [Google Scholar]
- 14.Bjorkbacka H, Kunjathoor VV, Moore KJ, et al. Reduced atherosclerosis in MyD88-null mice links elevated serum cholesterol levels to activation of innate immunity signaling pathways. Nat Med. 2004;10:416–421. doi: 10.1038/nm1008. [DOI] [PubMed] [Google Scholar]
- 15.Ding Y, Subramanian S, Montes VN, et al. Toll-like receptor 4 deficiency decreases atherosclerosis but does not protect against inflammation in obese low-density lipoprotein receptor-deficient mice. Arterioscler Thromb Vasc Biol. 2012;32:1596–1604. doi: 10.1161/ATVBAHA.112.249847. [DOI] [PMC free article] [PubMed] [Google Scholar]
- 16.Subramanian M, Thorp E, Hansson GK, et al. Treg-mediated suppression of atherosclerosis requires MYD88 signaling in DCs. J Clin Invest. 2013;123:179–188. doi: 10.1172/JCI64617. [DOI] [PMC free article] [PubMed] [Google Scholar]
- 17.Chistiakov DA, Orekhov AN, Bobryshev YV. Links between atherosclerotic and periodontal disease. Exp Mol Pathol. 2016;100:220–235. doi: 10.1016/j.yexmp.2016.01.006. [DOI] [PubMed] [Google Scholar]
- 18.Horseman MA, Surani S, Bowman JD. Endotoxin. Toll-like Receptor-4, and Atherosclerotic Heart Disease. Curr Cardiol Rev. 2016 doi: 10.2174/1573403X12666160901145313. [DOI] [PMC free article] [PubMed] [Google Scholar]
- 19.Laakso M. Hyperglycemia and cardiovascular disease in type 2 diabetes. Diabetes. 1999;48:937–942. doi: 10.2337/diabetes.48.5.937. [DOI] [PubMed] [Google Scholar]
- 20.Ford ES, Schulze MB, Pischon T, et al. Metabolic syndrome and risk of incident diabetes: findings from the European Prospective Investigation into Cancer and Nutrition-Potsdam Study. Cardiovasc Diabetol. 2008;7:35. doi: 10.1186/1475-2840-7-35. [DOI] [PMC free article] [PubMed] [Google Scholar]
- 21.Chen J, Muntner P, Hamm LL, et al. The metabolic syndrome and chronic kidney disease in U. S adults, Ann Intern Med. 2004;140:167–174. doi: 10.7326/0003-4819-140-3-200402030-00007. [DOI] [PubMed] [Google Scholar]
- 22.O’Neill S, O’Driscoll L. Metabolic syndrome: a closer look at the growing epidemic and its associated pathologies. Obes Rev. 2015;16:1–12. doi: 10.1111/obr.12229. [DOI] [PubMed] [Google Scholar]
- 23.Yu Y, Cai Z, Zheng J, et al. Serum levels of polyunsaturated fatty acids are low in Chinese men with metabolic syndrome, whereas serum levels of saturated fatty acids, zinc, and magnesium are high. Nutr Res. 2012;32:71–77. doi: 10.1016/j.nutres.2011.12.004. [DOI] [PubMed] [Google Scholar]
- 24.Sethom MM, Fares S, Feki M, et al. Plasma fatty acids profile and estimated elongase and desaturases activities in Tunisian patients with the metabolic syndrome. Prostaglandins Leukot Essent Fatty Acids. 2011;85:137–141. doi: 10.1016/j.plefa.2011.06.006. [DOI] [PubMed] [Google Scholar]
- 25.Kageyama A, Matsui H, Ohta M, et al. Palmitic acid induces osteoblastic differentiation in vascular smooth muscle cells through ACSL3 and NF-kappaB, novel targets of eicosapentaenoic acid. PLoS One. 2013;8:e68197. doi: 10.1371/journal.pone.0068197. [DOI] [PMC free article] [PubMed] [Google Scholar]
- 26.Afonso MS, Lavrador MS, Koike MK, et al. Dietary interesterified fat enriched with palmitic acid induces atherosclerosis by impairing macrophage cholesterol efflux and eliciting inflammation. J Nutr Biochem. 2016;32:91–100. doi: 10.1016/j.jnutbio.2016.01.005. [DOI] [PubMed] [Google Scholar]
- 27.Chang CL, Torrejon C, Jung UJ, et al. Incremental replacement of saturated fats by n-3 fatty acids in high-fat, high-cholesterol diets reduces elevated plasma lipid levels and arterial lipoprotein lipase, macrophages and atherosclerosis in LDLR−/− mice. Atherosclerosis. 2014;234:401–409. doi: 10.1016/j.atherosclerosis.2014.03.022. [DOI] [PMC free article] [PubMed] [Google Scholar]
- 28.Zhu M, Nikolajczyk BS. Immune cells link obesity-associated type 2 diabetes and periodontitis. J Dent Res. 2014;93:346–352. doi: 10.1177/0022034513518943. [DOI] [PMC free article] [PubMed] [Google Scholar]
- 29.Cani PD, Amar J, Iglesias MA, et al. Metabolic endotoxemia initiates obesity and insulin resistance. Diabetes. 2007;56:1761–1772. doi: 10.2337/db06-1491. [DOI] [PubMed] [Google Scholar]
- 30.Xu C, Chakravarty K, Kong X, et al. Several transcription factors are recruited to the glucose-6-phosphatase gene promoter in response to palmitate in rat hepatocytes and H4IIE cells. J Nutr. 2007;137:554–559. doi: 10.1093/jn/137.3.554. [DOI] [PubMed] [Google Scholar]
- 31.Yoon H, Jeon DJ, Park CE, et al. Relationship between homeostasis model assessment of insulin resistance and beta cell function and serum 25-hydroxyvitamin D in non-diabetic Korean adults. J Clin Biochem Nutr. 2016;59:139–144. doi: 10.3164/jcbn.15-143. [DOI] [PMC free article] [PubMed] [Google Scholar]
- 32.Lloyd DJ, Helmering J, Kaufman SA, et al. A volumetric method for quantifying atherosclerosis in mice by using microCT: comparison to en face. PloS one. 2011;6:e18800. doi: 10.1371/journal.pone.0018800. [DOI] [PMC free article] [PubMed] [Google Scholar]
- 33.Schuyler CA, Ta NN, Li Y, et al. Insulin treatment attenuates diabetes-increased atherosclerotic intimal lesions and matrix metalloproteinase 9 expression in apolipoprotein E-deficient mice. J Endocrinol. 2011;210:37–46. doi: 10.1530/JOE-10-0420. [DOI] [PubMed] [Google Scholar]
- 34.Schwartz EA, Zhang WY, Karnik SK, et al. Nutrient modification of the innate immune response: a novel mechanism by which saturated fatty acids greatly amplify monocyte inflammation. Arterioscler Thromb Vasc Biol. 2010;30:802–808. doi: 10.1161/ATVBAHA.109.201681. [DOI] [PubMed] [Google Scholar]
- 35.Nareika A, Im YB, Game BA, et al. High glucose enhances lipopolysaccharide-stimulated CD14 expression in U937 mononuclear cells by increasing nuclear factor kappaB and AP-1 activities. J Endocrinol. 2008;196:45–55. doi: 10.1677/JOE-07-0145. [DOI] [PubMed] [Google Scholar]
- 36.Samuvel DJ, Sundararaj KP, Nareika A, et al. Lactate boosts TLR4 signaling and NF-kappaB pathway-mediated gene transcription in macrophages via monocarboxylate transporters and MD-2 up-regulation. J Immunol. 2009;182:2476–2484. doi: 10.4049/jimmunol.0802059. [DOI] [PMC free article] [PubMed] [Google Scholar]
- 37.Li Y, Lu Z, Zhang X, et al. Metabolic syndrome exacerbates inflammation and bone loss in periodontitis. J Dent Res. 2015;94:362–370. doi: 10.1177/0022034514561658. [DOI] [PMC free article] [PubMed] [Google Scholar]
- 38.VanderLaan PA, Reardon CA, Getz GS. Site specificity of atherosclerosis: site-selective responses to atherosclerotic modulators. Arterioscler Thromb Vasc Biol. 2004;24:12–22. doi: 10.1161/01.ATV.0000105054.43931.f0. [DOI] [PubMed] [Google Scholar]
- 39.Davignon J, Ganz P. Role of endothelial dysfunction in atherosclerosis. Circulation. 2004;109:III27–32. doi: 10.1161/01.CIR.0000131515.03336.f8. [DOI] [PubMed] [Google Scholar]
- 40.Pober JS. Endothelial activation: intracellular signaling pathways. Arthritis Res. 2002;4(Suppl 3):S109–116. doi: 10.1186/ar576. [DOI] [PMC free article] [PubMed] [Google Scholar]
- 41.Pillon NJ, Azizi PM, Li YE, et al. Palmitate-induced inflammatory pathways in human adipose microvascular endothelial cells promote monocyte adhesion and impair insulin transcytosis. Am J Physiol Endocrinol Metab. 2015;309:E35–44. doi: 10.1152/ajpendo.00611.2014. [DOI] [PubMed] [Google Scholar]
- 42.Campbell SE, Tandon NN, Woldegiorgis G, et al. A novel function for fatty acid translocase (FAT)/CD36: involvement in long chain fatty acid transfer into the mitochondria. J Biol Chem. 2004;279:36235–36241. doi: 10.1074/jbc.M400566200. [DOI] [PubMed] [Google Scholar]
- 43.Baranova IN, Kurlander R, Bocharov AV, et al. Role of human CD36 in bacterial recognition, phagocytosis, and pathogen-induced JNK-mediated signaling. J Immunol. 2008;181:7147–7156. doi: 10.4049/jimmunol.181.10.7147. [DOI] [PMC free article] [PubMed] [Google Scholar]
- 44.Dauphinee SM, Karsan A. Lipopolysaccharide signaling in endothelial cells. Lab Invest. 2006;86:9–22. doi: 10.1038/labinvest.3700366. [DOI] [PubMed] [Google Scholar]
- 45.Folsom AR, Ma J, McGovern PG, et al. Relation between plasma phospholipid saturated fatty acids and hyperinsulinemia. Metabolism. 1996;45:223–228. doi: 10.1016/s0026-0495(96)90058-x. [DOI] [PubMed] [Google Scholar]
- 46.Rasmussen O, Lauszus FF, Christiansen C, et al. Differential effects of saturated and monounsaturated fat on blood glucose and insulin responses in subjects with non-insulin-dependent diabetes mellitus. Am J Clin Nutr. 1996;63:249–253. doi: 10.1093/ajcn/63.2.249. [DOI] [PubMed] [Google Scholar]
- 47.Thams P, Capito K. Differential mechanisms of glucose and palmitate in augmentation of insulin secretion in mouse pancreatic islets. Diabetologia. 2001;44:738–746. doi: 10.1007/s001250051683. [DOI] [PubMed] [Google Scholar]
- 48.Reilly MP, Wolfe ML, Rhodes T, et al. Measures of insulin resistance add incremental value to the clinical diagnosis of metabolic syndrome in association with coronary atherosclerosis. Circulation. 2004;110:803–809. doi: 10.1161/01.CIR.0000138740.84883.9C. [DOI] [PubMed] [Google Scholar]
- 49.Park JS, Cho MH, Ahn CW, et al. The association of insulin resistance and carotid atherosclerosis with thigh and calf circumference in patients with type 2 diabetes. Cardiovasc Diabetol. 2012;11:62. doi: 10.1186/1475-2840-11-62. [DOI] [PMC free article] [PubMed] [Google Scholar]
- 50.Nergiz-Unal R, Rademakers T, Cosemans JM, et al. CD36 as a multiple-ligand signaling receptor in atherothrombosis. Cardiovasc Hematol Agents Med Chem. 2011;9:42–55. doi: 10.2174/187152511794182855. [DOI] [PubMed] [Google Scholar]
Associated Data
This section collects any data citations, data availability statements, or supplementary materials included in this article.


