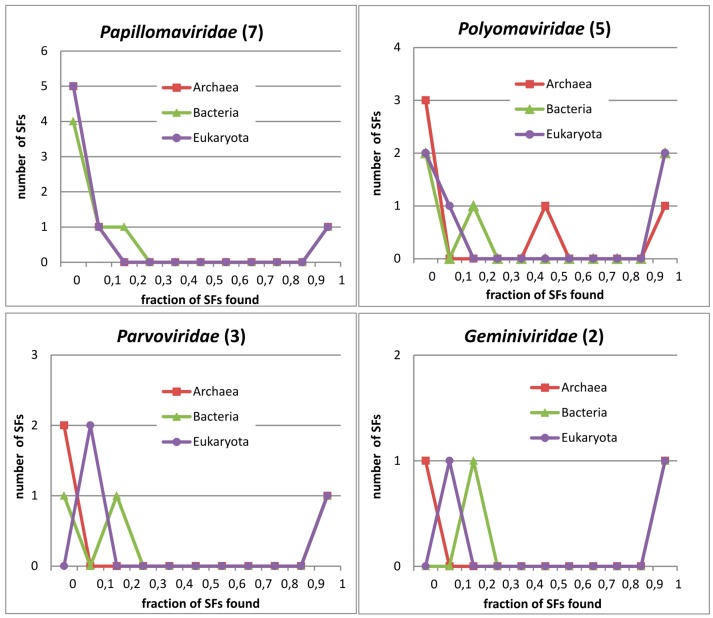
Figure 3.
Distribution of protein domains in viral families by superkingdoms. Each figure shows data for the corresponding viral family. The number in the parentheses on titles corresponds to the number of distinct domains (SF) found in the respective viral family. The y-axis shows the number of domains (SF) from the viral family, covered by any of the three superkingdoms. The x-axis shows the decile of the genomes where the viral protein domains are found by superkingdoms. In panel Papillomaviridae, the lines for Archaea and Eukaryota overlap.

