

Abstract
The central nucleus of the inferior colliculus (ICC) of the auditory midbrain, which integrates most ascending auditory information from lower brainstem regions, receives prominent long-range inhibitory input from the ventral nucleus of the lateral lemniscus (VNLL), a region thought to be important for temporal pattern discrimination. Histological evidence suggests that neurons in the VNLL release both glycine and GABA in the ICC, but functional evidence for their corelease is lacking. We took advantage of the GlyT2-Cre mouse line (both male and female) to target expression of ChR2 to glycinergic afferents in the ICC and made whole-cell recordings in vitro while exciting glycinergic fibers with light. Using this approach, it was clear that a significant fraction of glycinergic boutons corelease GABA in the ICC. Viral injections were used to target ChR2 expression specifically to glycinergic fibers ascending from the VNLL, allowing for activation of fibers from a single source of ascending input in a way that has not been previously possible in the ICC. We then investigated aspects of the glycinergic versus GABAergic current components to probe functional consequences of corelease. Surprisingly, the time course and short-term plasticity of synaptic signaling were nearly identical for the two transmitters. We therefore conclude that the two neurotransmitters may be functionally interchangeable and that multiple receptor subtypes subserving inhibition may offer diverse mechanisms for maintaining inhibitory homeostasis.
SIGNIFICANCE STATEMENT Corelease of neurotransmitters is a common feature of the brain. GABA and glycine corelease is particularly common in the spinal cord and brainstem, but its presence in the midbrain is unknown. We show corelease of GABA and glycine for the first time in the central nucleus of the inferior colliculus of the auditory midbrain. Glycine and GABA are both inhibitory neurotransmitters involved in fast synaptic transmission, so we explored differences between the currents to establish a physiological foundation for functional differences in vivo. In contrast to the auditory brainstem, coreleased GABAergic and glycinergic currents in the midbrain are strikingly similar. This apparent redundancy may ensure homeostasis if one neurotransmitter system is compromised.
Keywords: corelease, GABA, glycine, inferior colliculus, optogenetics
Introduction
GABA is coreleased with a variety of other neurotransmitters throughout the brain (Tritsch et al., 2016). One of the most paradoxical partners of GABA corelease is glycine as they are both fast inhibitory neurotransmitters. In the central auditory system, GABA/glycine corelease is particularly common during development (Kotak et al., 1998; Nabekura et al., 2004; Muller et al., 2006). However, corelease persists in adulthood in a variety of regions, including the lateral superior olive (LSO), the medial nucleus of the trapezoid body, and the dorsal cochlear nucleus (Helfert et al., 1992; Rubio and Juiz, 2004; Awatramani et al., 2005; Roberts et al., 2008; Weisz et al., 2016). Many functions of corelease have been proposed, including subserving tonic versus phasic inhibition via different time courses of glycinergic and GABAergic synaptic currents (Russier et al., 2002; Kuo et al., 2009; Xie and Manis, 2013), extra-fast inhibition (Lu et al., 2008), and compensation by one neurotransmitter during periods of sustained activity (Ishibashi et al., 2013; Fischl et al., 2014; Nerlich et al., 2014). Despite the common presence of and functional implications for GABA/glycine corelease in auditory brainstem regions, it has yet to be explored in the auditory midbrain.
The central nucleus of the inferior colliculus (ICC) is a nearly obligatory relay station for ascending streams of auditory information from the brainstem (Oliver, 2005). Different types of auditory information coalesce in the ICC to create unique tuning properties, which are then conveyed to the thalamus and cortex (Haplea et al., 1994; Joris et al., 2004; Loftus et al., 2010). Multiple brainstem nuclei send glutamatergic, GABAergic, and glycinergic fibers to the ICC. Glycinergic input in particular originates largely from the ventral nucleus of the lateral lemniscus (VNLL) and LSO, regions hypothesized to be important for temporal pattern discrimination and location of sound in space, respectively (Saint Marie et al., 1989; Covey and Casseday, 1991; Glendenning et al., 1992, Oertel and Wickesberg, 2002). The VNLL is an especially unusual structure because it is largely composed of inhibitory cell types and is one of the largest sources of input to ICC (Brunso-Bechtold et al., 1981; Saint Marie and Baker, 1990; Winer et al., 1995; Saint Marie et al., 1997; for review, see Cant, 2005). A large fraction of cells in the VNLL across species express both glycine and GABA (Saint Marie et al., 1997; Riquelme et al., 2001; Tanaka and Ezure, 2004), raising the possibility that projections from the VNLL to the ICC corelease these inhibitory neurotransmitters. However, functional evidence for corelease is difficult to demonstrate experimentally because of the anatomy of ascending projections. Ascending fibers from all lower brainstem regions enter the ICC through the same lemniscal fiber tract and there are multiple sources of pure GABAergic input that would be stimulated with electrical stimulation, making it unfeasible to activate glycinergic fibers in isolation to assay corelease.
Here we used a GlyT2-Cre mouse line (Ishihara et al., 2010) to express ChR2 in glycinergic cells and activate glycinergic fibers with photostimulation. ChR2 was targeted to glycinergic neurons either globally (by crossing the Cre line with a reporter line that expresses ChR2 in a Cre-dependent manner) or specifically within the VNLL via intracranial injection of an adeno-associated virus (AAV) that induces Cre-dependent ChR2 expression. In this way we asked whether glycinergic afferents in the ICC corelease glycine and GABA and studied the possible functional consequences of this corelease. We found that GABA was consistently coreleased with glycine from individual terminals in the auditory midbrain, but the postsynaptic effects of the two transmitters were almost identical. Targeted expression of ChR2 to glycinergic fibers ascending from VNLL yielded similar results to global glycinergic stimulation. Indeed, our data suggest that putative roles for GABA/glycine corelease in lower brain regions are not recapitulated in the auditory midbrain, leaving the possibility open that the two neurotransmitters are functionally interchangeable.
Materials and Methods
Animals.
All procedures involving animals were approved by Oregon Health & Science University's Institutional Animal Care and Use Committee. Optogenetic experiments were performed using heterozygous GlyT2-Cre;ChR2 mice generated by crossing GlyT2-Cre mice [Tg(Slc6a5-cre)KF109Gsat/Mmucd, RRID:MMRRC_030730-UCD] with the floxed ChR2(H134R)-EYFP Cre Ai32 reporter line [B6.Cg-Gt(ROSA)26Sortm32(CAG-COP4*H134R/EYFP)Hze/J, RRID:IMSR_JAX:024109]. This cross resulted in the expression of ChR2 targeted to glycinergic neurons (Lu and Trussell, 2016). Miniature IPSC (mIPSC) recordings were made from wild-type C57BL/6 mice against which all transgenic lines were bred. Male and female mice, postnatal days (P) 19–P35, were used for experiments. Specifically, an age range of P19–P35 was used for experiments using wild-type or GlyT2-Cre;ChR2 mice and an age range of P29–P35 was used for experiments in which GlyT2-Cre mice were injected with virus to induce region-specific ChR2 expression (see Stereotactic injections). This wide age range apparently did not introduce variability in our dataset as there was no significant relationship between age and the percentage of the postsynaptic current attributed to GABA release in either the GlyT2-Cre;ChR2 dataset (n = 28 cells, R2 = 0.028, p = 0.39, linear regression) or the viral injection dataset (n = 15 cells, R2 = 0.006, p = 0.78, linear regression). Age also did not correlate with IPSC decay in either the GlyT2-Cre;ChR2 dataset (n = 26 cells, R2 = 0.008, p = 0.67, linear regression) or the viral injection dataset (n = 13 cells, R2 = 0.005, p = 0.82, linear regression).
To control for Cre expression in the GlyT2-Cre line outside of glycinergic neurons, we crossed the GlyT2-Cre line with the floxed Ai9 tdTomato Cre reporter line [B6.Cg-Gt(ROSA)26Sortm9(CAG-tdTomato)Hze/J, RRID:IMSR_JAX:007909] and subsequently crossed Cre-positive offspring with a well characterized GlyT2-EGFP mouse line [FVB.Cg-Tg(Slc6a5-EGFP)13Uze/UzeBsiRbrc, RRID:IMSR_RBRC04708; Zeilhofer et al., 2005]. At 1 month of age, three of the resulting GlyT2-Cre/tdTomato: GlyT2-EGFP offspring were transcardially perfused with 4% paraformaldehyde (PFA). The brains were dissected out, postfixed overnight in 4% PFA, and sectioned on a vibratome at 50 μm thickness. Sections containing VNLL were counterstained with Hoechst 34580 (Thermo Fisher Scientific). Because the intensity of tdTomato and GFP varied between cells, we formulated a way to remove bias in determining whether cells were counted as positive for one, both, or neither. Using Adobe Illustrator CS6 (RRID:SCR_014198), we first used dots to mark tdTomato+ and GFP+ cell bodies when viewing these in separate channels. We used the Hoechst DNA counterstain to locate and label cells that were clearly negative for either. These templates were then merged to create a single template that marked cell bodies throughout the VNLL. This single template was overlaid on red and green channels separately and points were deleted if they labeled a soma that was negative for the respective fluorophore. Finally, the two maps of tdTomato+ and EGFP+ cell bodies were overlaid and compared to identify the percentage of Cre/tdTomato-expressing neurons that were EGFP-negative and therefore unlikely to be glycinergic.
Brain-slice preparation.
Mice were anesthetized with isofluorane, decapitated, and coronal slices containing ICC (220 μm thick) were cut in warm (35°C) ACSF on a vibratome (Leica VT1200S). ASCF contained (in mm) 130 NaCl, 2.1 KCl, 1.2 KH2PO4, 1.7 CaCl2, 1 MgSO4, 20 NaHCO3, 3 Na-HEPES, 10–12 glucose, 0.4 ascorbate, and 2 Na pyruvate and was bubbled with 5% CO2/95% O2 (300–310 mOsm). Slices recovered at 34°C ACSF for 30 min and were then kept at room temperature until use.
Electrophysiology.
Brain slices were contained in a chamber perfused with ACSF (∼3 ml/min) heated to 31–33°C by an in-line heater. Neurons in the ICC were visualized with Dodt contrast optics using a 40× objective on an upright microscope (Zeiss Axioskop2). The ICC was identified as the central area of the inferior colliculus in coronal slices where the tissue was harder to visualize due to the abundance of myelinated lemniscal fibers. The VNLL was identified by anatomical location as well as by a concentration of EYFP-expressing cells in slices obtained from the GlyT2-Cre:ChR2(H134R)-EYFP reporter cross. Whole-cell patch-clamp recordings from ICC and VNLL neurons were made with a Multiclamp 700B amplifier. Data were filtered at 10 kHz, digitized at 20 kHz by Digidata 1322A, and acquired by pClamp 10.4 software (Molecular Devices, RRID:SCR_011323).
Intrinsic ChR2 currents were measured in neurons of the VNLL by blocking synaptic transmission with 5 μm NBQX, 10 μm MK-801, 10 μm SR95531, and 500 nm strychnine. In voltage clamp, exposing cells to a 50 ms light pulse would necessarily result in a long inward current. In the ICC, IPSCs were measured in response to either ChR2 stimulation or stimulation of fibers with a bipolar electrode made from borosilicate theta glass (Sutter Instrument #BT-150-10; henceforth “theta stimulation”). Wide-field photostimulation was achieved by coupling a 470 nm LED to the epifluorescence port of the microscope and delivering brief (1–2 ms) pulses of light with pClamp. Fibers were stimulated electrically by 0.1–0.2 ms square-wave pulses (2–20 V) produced by pClamp and delivered through an isolation unit (AMPI ISO-Flex). Recording electrodes (4–6 MΩ) were pulled from borosilicate glass (WPI 1B150F-4) by a vertical puller (Narishige P-10). The internal pipette solution used for recording mIPSCs contained (in mm) 115 CsCl, 10 HEPES, 4.5 MgCl2, 10 EGTA, 4 Na2-ATP, and 0.5 Tris-GTP with pH adjusted to 7.25 with CsOH and osmolality adjusted to 290 mOsm with sucrose. The calculated chloride reversal potential (ECl) was −2.3 mV. The internal solution used for all other experiments contained (in mm) 113 K gluconate, 2.75 MgCl2 hexahydrate, 1.75 MgSO4, 0.1 EGTA, 9 HEPES, 14 Tris-phosphocreatine, 4 NA2-ATP, and 0.3 tris-GTP with pH adjusted to 7.25 with KOH and osmolality adjusted to 290 mOsm with sucrose (ECl = −84.8 mV). For this internal solution, holding potentials cited in the text are corrected for a −13 mV junction potential. Series resistance (<20 MΩ) was compensated by 60–80% “correction,” 90% “prediction” (bandwidth, 3 kHz). Data were excluded from analysis if series resistance changed by >25% over the course of the experiment.
Firing patterns were studied by holding cells in current clamp, delivering a bias current as needed to stabilize the resting potential at −65 mV (unbiased resting potentials typically ranged from −60 to −65 mV), and delivering a 500 ms current step ranging from −500 pA to +500 pA in 50 pA increments. Neurons recorded in VNLL displayed firing properties characteristic of VNLL neurons in mouse and gerbil (Caspari et al., 2015; Franzen et al., 2015). The cells recorded from the ICC were organized into five categories based on differences in firing pattern. Sustained neurons fired action potentials over the duration of positive current steps with varying levels of adaptation. Sustained, Ih neurons were similar except they showed prominent depolarizing sag at the onset of a hyperpolarizing current step. Cells categorized as transient fired multiple spikes only at the beginning of positive current steps while onset cells fired only one or two spikes at most at the beginning of a positive step. Finally, pauser cells displayed either a buildup in depolarization that preceded spiking or a long interspike interval after the first action potential. This was sometimes accompanied by acceleration in firing frequency over the length of the train.
All reagents were purchased from Sigma-Aldrich with the exception of SR-95531, which was purchased from Tocris Bioscience.
mIPSC analysis.
mIPSCs were recorded in 1 μm tetrodotoxin (TTX) to block spontaneous spike-driven events, in 10 μm zolpidem and 30 μm pentobarbital to slow the GABAergic component, and in 5 μm NBQX/5 μm MK-801 to block AMPA/NMDA receptors. Glycinergic and GABAergic mIPSCs were recorded in isolation using 5 μm SR95531 and 500 nm strychnine respectively. Individual events were first detected in AxoGraph X 1.5.4 (RRID:SCR_014284) using a synaptic template with variable amplitude and then checked by eye to remove spurious events (Clements and Bekkers, 1997). To calculate that portion of the total amplitude contributed by glycine or GABAA receptors (Jonas et al., 1998; Awatramani et al., 2005), individual mIPSCs were force-fit with the dual exponential equation as follows: Amplitude = AFAST * exp(−t/τFAST) + ASLOW * exp(−t/τSLOW). A and τ represent amplitude and decay time constant values associated with fast glycinergic and slow GABAergic currents. The average decay time constants measured for glycinergic and GABAergic mIPSCs were measured individually for each cell recorded in 5 μm SR95531 and 500 nm strychnine, respectively. These average values were used for τFAST and τSLOW.
Stereotactic injections.
GlyT2-Cre mice of both sexes (P16–P19) were injected with AAVrh10.CAGGS.flex.ChR2.tdTomato.-WPRE.SV40 (UPENN AV-10-18917P) to induce the expression of ChR2 in cells of the VNLL in a Cre-dependent manner. The AAV (serotype 2/1) expresses ChR2 and tdTomato under the control of a FLEx (flip-excision) switch that makes expression dependent on the presence of Cre. The transgenes were driven by the CAG promoter and included a WPRE (woodchuck hepatitis virus post-transcriptional regulatory element) and SV40 polyadenylation signal to enhance expression (Atasoy et al., 2008). Recordings were made in the ICC starting 14 d after injections. Mice were anesthetized with 1% isoflurane and stabilized in a stereotaxic instrument (David Kopf). A unilateral craniotomy was made using a dental drill (Foredom K.1070) and a beveled glass capillary micropipette (inner diameter, 20–30 μm) attached to a hydraulic injector (Narishige) was used to deliver 30 nl of AAV at a speed of 5 nl/s. The micropipette was advanced into and out of the brain tissue at a speed of ∼5 μm/s, with a 5 min wait time at the injection site before and after injection. The coordinates we used for VNLL were (in mm from bregma): −3.2 posterior, 1.3 lateral, and 5.2 deep from the pia.
Experimental design and statistical analyses.
Electrophysiological traces were analyzed with pClamp 10.4 software or custom-written procedures in IGOR Pro 6.3. Statistics (RRID:SCR_000325) were performed and graphs created using GraphPad Prism 7 (RRID:SCR_002798). Averages are represented as mean ± SEM. Data were tested for assumptions of equal variances (Bartlett's test) between groups and normality (Shapiro–Wilk test) before using parametric tests. One-way ANOVA with repeated measures was used for comparisons across treatments within single cells followed by Tukey's post hoc comparisons (P values for post hoc comparisons are reported only when the p value associated with the main effect is significant). Alternatively, for paired and unpaired data respectively, the Friedman test and Kruskal–Wallis with Dunn's post hoc tests were used if the data were not normally distributed. Multiple comparisons were controlled for by selecting the “multiplicity adjusted P-value” option in Prism 7. Sphericity and effective matching were also tested for when using ANOVAs. Two-way ANOVA with repeated measures on one or both factors (for data collected within single cells across conditions) was used to compare short-term synaptic depression in Figure 7P,F, and df values reported for two-way ANOVAs are those associated with the main effect and P values associated with the interaction term are reported only if significant. Data are displayed as box-and-whisker plots with the median value marked within the “box” extending from the 25th to 75th percentiles. The Tukey method was used to create the “whiskers” in which the interquartile distance is multiplied by 1.5 and extended from the edges of the box. Data outside of this calculated range are plotted as points. Conversely, if these calculated values were outside of the minimum or maximum values of the dataset, the whiskers were instead set to the respective minimum and maximum values.
Figure 7.

Synaptic depression measured from light-evoked IPSCs is comparable to synaptic depression measured from theta-electrode-evoked IPSCs ≤50 Hz. A, Example traces of light-evoked versus theta-electrode-evoked IPSCs (top and bottom traces respectively, stimulus artifacts removed) driven at 10 Hz. Gray indicates individual traces and black is the average. B, Summary data of normalized IPSC trains evoked at rates of 10 (left), 20 (middle), and 50 (right) Hz [light n10,20,50 Hz = 24, 18, 21 cells; theta n10,20,50 Hz = 5, 6, 6 cells; F10,20,50 Hz = 2.48, 1.48, 0.25; df10,20,50 Hz = (1,27), (1,22), (1,25); p10,20,50 Hz = 0.1267, 0.2375, 0.6208, 2-way ANOVAs with repeated measures; 10 Hz data showed a significant interaction (p = 0.0083), but post hoc comparisons were not significant]. C, Normalized amplitudes of light-evoked IPSCs stimulated 10 times at 10 (left) and 50 Hz for 1 s (right) in control conditions and in the presence of strychnine to block the glycinergic component. Neither stimulation frequency revealed a difference in short-term synaptic depression with the addition of strychnine (n10,50 Hz = 9, 10 cells, F(1,8)10 Hz = 0.68, F(1,9)50 Hz = 3.5, p10,50 Hz = 0.4328, 0.0942, 2-way ANOVA with repeated measures on both factors).
Results
Ascending afferents in the inferior colliculus corelease glycine and GABA
One of the largest ascending sources of inhibition to the ICC is the VNLL, an auditory region putatively important for temporal pattern discrimination (Brunso-Bechtold et al., 1981; Saint Marie and Baker, 1990; Winer et al., 1995, Saint Marie et al., 1997, Oertel and Wickesberg, 2002). Curiously, histological evidence shows that a large fraction of cells in the VNLL of multiple species express both GABA and glycine (Saint Marie et al., 1997; Riquelme et al., 2001; Tanaka and Ezure, 2004). We therefore asked whether glycinergic afferents entering the ICC corelease glycine and GABA.
Glycine and GABA are packaged into presynaptic vesicles by the same vesicular transporter VGAT (vesicular GABA transporter; Wojcik et al., 2006). To verify the corelease of both inhibitory neurotransmitters from the same synapse, we recorded mIPSCs, the postsynaptic consequence of a single vesicle released presynaptically. Spontaneous vesicular release was blocked by the inclusion of 1 μm TTX in the bath. Miniature events were recorded with pipettes containing a high-chloride internal solution to increase the amplitude of the currents. The inhibitory currents are inward under these conditions. mIPSCs had uniformly rapid kinetics that were well fit with a single exponential, giving an average decay of 3.3 ± 0.1 ms (n = 618 mIPSCs for control cell displayed in Fig. 1A). The homogenous kinetics made the differentiation of glycinergic and GABAergic components problematic. To address this confound, we added 10 μm zolpidem and 30 μm pentobarbital to the bath to slow GABAA-receptor kinetics (Fig. 1A; Zhang et al., 2008; Apostolides and Trussell, 2013). This revealed slower GABAergic currents, some of which appeared to be combined with fast glycinergic currents within a single vesicular release event (Fig. 1A, starred events).
Figure 1.

Corelease revealed through analysis of mIPSCs. A, mIPSCs recorded from a neuron in the ICC in control conditions (left trace) appear homogeneous in the speed of their decay (recorded in 1 μm TTX with excitatory transmission blocked). However, when 10 μm zolpidem and 30 μm pentobarbital are added to the bath to increase the open probability of the GABAA receptor and effectively slow the current (right trace), dual-component mIPSCs are revealed (starred events). B, With zolpidem and pentobarbital in the bath, glycinergic and GABAergic mIPSCs have distinctly fast and slow kinetics, respectively. Displayed are mIPSCs recorded from the same neuron in control (left trace), in 5 μm SR95531 to isolate glycinergic mIPSCs (middle trace), and in 500 nm strychnine to isolate GABAergic mIPSCs (right trace). C, Normalized and averaged glycinergic (green) and GABAergic (purple) mIPSCs. The average decays were 2.8 ± 0.2 and 25.8 ± 1.2 ms respectively. D, Scatter plots of amplitude values associated with fast and slow mIPSC components. In control conditions, individual events were force-fit with a dual exponential equation where the τ values were fixed using these averages and the associated amplitude values were left free-floating and plotted (left scatter plot represents the results from a single neuron). The pharmacologically isolated glycinergic (green points) and GABAergic (purple points) mIPSCs from the same neuron were force-fit with the same dual exponential equation and plotted (right scatter plot). The vertical dotted line represents 2*SD of the average amplitude associated with the slow decay time constant for glycinergic mIPSCs while the horizontal dotted line represents the same for the amplitude associated with the fast decay time constant for GABAergic mIPSCs. Points beyond these cutoff amplitudes are considered mixed events. In control conditions (left scatter plot), mixed events are labeled in blue and largely disappear in the presence of either blocker (right scatter plot). E, The percentage of mIPSCs that are mixed in control (average, 22.9 ± 2.8%) is significantly higher compared with the fraction mixed with the addition of SR95531 or strychnine (average, 1.9 ± 0.2%; n = 6 cells, t(5) = 7.08, p = 0.0009, 2-tailed t test). ***p < 0.001.
Glycinergic and GABAergic components were therefore distinguished based on their differing kinetics, allowing us to detect single mIPSCs with dual components following the analysis technique of Jonas et al. (1998). When isolated pharmacologically (see Materials and Methods), the average decay time constants for glycinergic (Fig. 1B, +SR95531) and GABAergic (Fig. 1B, +strychnine) mIPSCs were 2.8 ± 0.2 and 25.7 ± 1.2 ms respectively (n = 6 cells, average 730 ± 102 glycinergic and 723 ± 85 GABAergic mIPSCs analyzed per cell; Fig. 1C). Following Jonas et al., 1998, these values were used in a double exponential equation where the two time constants are fixed and the amplitude values associated with each time constant are free-floating (see Materials and Methods). Force-fitting this equation to individual events yields amplitude values associated with each time constant that together account for the full amplitude of the current. For example, the total amplitude of a purely glycinergic mIPSC should be fully accounted for by the amplitude associated with the fast-decay time constant. In Figure 1D, each point represents a single mIPSC recorded from a cell using the slow GABAergic and fast glycinergic amplitude values resulting from force-fitting the double exponential equation. The plot to the right shows the results of force-fitting events recorded from the same cell in the presence of either GABA-receptor or glycine-receptor blockers. In the presence of GABA-receptor blockers (green points), it appears that most of the full amplitude of each event can be explained by glycine-receptor kinetics, while the opposite holds in the presence of glycine-receptor kinetics (purple points). The dotted gray lines mark two SDs from the mean. Points that fall above these lines are regarded as containing both glycinergic and GABAergic components and appear in abundance in control conditions (Fig. 1D, blue points). The percentage of mIPSCs that were regarded as containing dual components in baseline conditions was 22.9 ± 2.8% (n = 6 cells; Fig. 1E). Using this method, the percentage of events classified as having dual components after the addition of strychnine or SR95531 was only 1.8 ± 0.2% (n = 6 cells). Furthermore, 53.0 ± 10.3% (n = 6 cells) of the mIPSCs identified as containing a significant glycine-receptor component also contained a significant GABA-receptor component. These results indicate that GABA and glycine can be released from the same synaptic vesicle in terminals in the ICC.
Spike-triggered corelease of glycine and GABA
The previous analysis shows that vesicles containing both transmitters may fuse spontaneously, but does not indicate whether such corelease occurs during normal spike-triggered exocytosis. However, analysis of evoked release is not straightforward because electrical stimulation of fibers within the ICC would inevitably activate purely GABAergic interneurons as well as the glycinergic input fibers. While it is feasible to electrically stimulate ascending axons as they enter the ICC ventrally, this lemniscal fiber bundle also contains fibers from purely GABAergic regions, such as the dorsal nucleus of the lateral lemniscus (DNLL). Therefore, to further study corelease in the ICC, we used the GlyT2-Cre mouse line to achieve targeted optical activation of ascending glycinergic input to the ICC (Fig. 2). The GlyT2-Cre mouse line effectively drives Cre expression in >80% of glycine-immunoreactive cells in the brainstem and spinal cord (Ishihara et al., 2010). Therefore, when crossed with a Cre-dependent reporter line to induce expression of tdTomato in Cre-expressing cells, tdTomato+ somata are present throughout auditory brainstem areas known to contain glycinergic cell bodies, including the VNLL (Fig. 2Ai–Aiii) and LSO (Fig. 2Bi,Bii). Notably, cell bodies are absent from regions known to contain many GABAergic neurons but not glycinergic cells, such as the ICC (Fig. 2Bi) and DNLL (data not shown). To verify that Cre expression is limited to glycinergic neurons in the auditory brainstem, we crossed the GlyT2-Cre line with a floxed tdTomato reporter line (Ai9) and subsequently crossed the offspring to the GlyT2-EGFP line that labels >90% of glycinergic neurons in the cerebellum and throughout the brainstem (Zeilhofer et al., 2005). We analyzed the VNLL (Fig. 2Aii, Aiii) for colabel of tdTomato and EGFP within cell bodies. Across three animals, an average of 3.0 ± 0.7% of the Cre-expressing cells in the VNLL were GFP-negative and may therefore release only GABA or glutamate in the ICC with light stimulation (somas counted per animal: 222, 423, 194). We believe this small percentage is unlikely to change the interpretation of our results.
Figure 2.

Cre expression is limited to GlyT2-expressing neurons in a GlyT2-Cre mouse line. Ai, Confocal image (10× tiled image) of a coronal section taken from GlyT2-Cre;tdTomato mouse in which tdTomato is expressed in a Cre-dependent manner. Note that the VNLL has many tdTomato+ cell bodies (white). Atlas illustration adapted from Paxinos and Franklin, 2001. Aii, The GlyT2-Cre;tdTomato line was crossed with the GlyT2-EGFP mouse line to confirm the targeted expression of Cre to glycinergic neurons. Displayed is a confocal image (20× tiled image) of a coronal section of VNLL from this cross. Aiii, Enlarged section from the VNLL with the red and green channels displayed separately in the bottom two panels. The neuron marked by the solid arrowhead is an example of a Cre/tdTomato-expressing cell that does not express EGFP and therefore may not be glycinergic. The neuron marked by the arrowhead outline expresses both Cre/tdTomato and EGFP. Bi, Confocal image (10× tiled image) of a coronal section containing LSO taken from GlyT2-Cre;tdTomato mouse. Note that the LSO contains many tdTomato+ cell bodies (white), while the ICC contains only tdTomato+ fibers. Atlas illustration adapted from Paxinos and Franklin, 2001. Bii, Enlarged image of the LSO in the GlyT2-Cre;tdTomato line crossed with the GlyT2-EGFP mouse line.
Global expression of ChR2 in glycinergic neurons allowed us to stimulate fibers from all ascending sources of glycinergic input to the ICC. Previous studies showed that the GlyT2-Cre;ChR2 cross effectively allows for light-evoked activation of glycinergic neurons (Lu and Trussell, 2016). We confirmed that photostimulation was effective in our preparation by making whole-cell recordings from the VNLL, the largest source of glycinergic input to the ICC. With synaptic transmission blocked, cells in the VNLL displayed an intrinsic ChR2 current in response to blue light, and spiked reliably in response to 1–2 ms light stimulation (Fig. 3A). We made whole-cell recordings from cells in the ICC and stimulated IPSCs from ascending glycinergic afferents with blue-wavelength light (Fig. 3B). When voltage-clamping cells at −60 mV, the average light-evoked IPSC was 362.2 ± 46.98 pA (n = 29 cells). The currents were large enough that low internal chloride solution was sufficient, so the IPSCs henceforth are outward. The theoretical chloride reversal potential was −84.5 mV, while the measured reversal potential was −84.3 ± 1.2 mV (n = 4 cells). The addition of GABA-receptor antagonist SR95531 (5 μm) or glycine-receptor antagonist strychnine (500 nm) revealed an average GABAergic component of 31 ± 4% of the evoked currents (n = 29 cells; Fig. 3B–E). This concentration was sufficient to block the entire slow-decaying mIPSC component in the presence of GABAA modulators (Fig. 1D). Together, the percentage of the IPSC that was GABAergic ranged quite widely, from 7.1 to 71.9% (Fig. 3E).
Figure 3.

Photostimulation of ascending glycinergic fibers to the ICC results in IPSCs with both glycinergic and GABAergic components. Ai, Example 10 Hz train of spikes evoked by light in a neuron in VNLL that expresses ChR2. In all figures, gray traces represent individual sweeps while black traces represent the average. Aii, Enlarged individual spike. B, Example light-evoked IPSCs recorded from two separate neurons in the ICC with bath application of glycine-receptor and GABA-receptor blockers strychnine and SR95331. Bi shows an example where SR95531 was added first followed by strychnine (n = 14 cells) and Bii shows the reverse (n = 15 cells). This was done to eliminate systematic bias in measuring kinetics of one component solely from subtracted currents. C, Light-evoked IPSC amplitude over time from an example cell following bath application of GABA-receptor antagonist SR95531 (5 μm) followed by glycine-receptor antagonist strychnine (500 nm). Because strychnine does not easily wash out, the amplitude only shows partial recovery when these drugs are removed. D, Summary data plotting the amplitude of light-evoked IPSCs in control, SR95531, and strychnine. The GABAergic component was significantly smaller than the glycinergic component of the total current (n = 29 cells, F = 49.72, p < 0.0001, Friedman test; post hoc control vs glycinergic p < 0.0001, control vs GABAergic p < 0.0001, glycinergic vs GABAergic p = 0.038). E, The addition of GABA-receptor antagonist SR95531 (5 μm) or glycine-receptor antagonist strychnine (500 nm) revealed an average GABAergic component of 31 ± 4% of the evoked currents (n = 29 cells). *p < 0.05, ***p < 0.001.
We compared the kinetics of glycinergic and GABAergic components within single postsynaptic cells to probe for possible functional differences in the signaling of these coreleased neurotransmitters. For each cell, one component was pharmacologically isolated while the other component was digitally isolated by subtracting the pharmacologically isolated current from the control trace. Half of the experiments in Figure 3 were performed by adding SR95531 first and digitally re-creating the GABAergic current while the other half were performed by adding strychnine first and digitally re-creating the glycinergic current. This approach should remove systematic bias in kinetic measurements resulting from the noise added to a digitally subtracted current. IPSCs were well fit with a monoexponential decay (Fig. 4A). The decay time constant of the isolated GABAergic component, 3.73 ± 0.24 ms, was similar but significantly slower than the isolated glycinergic component, 3.02 ± 0.23 ms (Fig. 4B; control, 3.34 ± 0.21 ms, n = 22 cells, F = 11.00, p = 0.0041, Friedman test; post hoc glycinergic vs GABAergic p = 0.0027). The fast time course of the GABAergic component was expected given the kinetics observed in our mIPSC recordings in control solutions. Glycinergic decays measured from evoked events were not different from mIPSC events (mIPSC n = 6 cells, evoked IPSC n = 22 cells, t(26) = 0.42, p = 0.67, two-tailed t test). Rise time (20–80%) was also significantly slower for the GABAergic component (0.93 ± 0.08 ms) compared with the glycinergic component (0.79 ± 0.05 ms, control 0.80 ± 0.04 ms; Fig. 4B; n = 24 cells, F(2,23) = 4.79, p = 0.027, repeated-measures one-way ANOVA; post hoc GABAergic vs glycinergic p = 0.039). The paired-pulse ratio collected with an interstimulus interval of 100 ms was similar between groups (control 0.70 ± 0.04, glycinergic 0.61 ± 0.05, GABAergic 0.71 ± 0.06; n = 11 cells, F(2,10) = 1.45, p = 0.26, repeated-measures one-way ANOVA).
Figure 4.

Glycinergic and GABAergic components to light-evoked currents had similar kinetics. A, Example light-evoked IPSC shown in control conditions (black trace) and in the presence of GABA-receptor antagonist SR95531 (5 μm) to isolate the glycinergic component (blue trace). The lower trace is the GABAergic component generated by subtracting the two currents above. Each of these traces was fitted with a single exponential (red lines) to describe the decay kinetics. B, Summary data of measured IPSC decays (upper plot) and rise times (lower plot) for total currents and their glycinergic and GABAergic components. The glycinergic and GABAergic components had strikingly similar kinetics, but the GABAergic decay was significantly slower (n = 22 cells, F = 11.00, p = 0.0041, Friedman test; post hoc control vs glycinergic p = 0.4074, control vs GABAergic p = 0.1752, glycinergic vs GABAergic p = 0.0027). Rise time (20–80%) was also significantly slower for the GABAergic component (n = 24 cells, F(2,23) = 4.79, p = 0.027, repeated-measures 1-way ANOVA; post hoc GABAergic vs glycinergic p = 0.039). C, Example IPSCs evoked by light (top trace) and theta electrode (bottom trace, stimulus artifacts removed). D, Light-evoked IPSCs were ∼2× larger in amplitude than theta-evoked IPSCs, indicating that theta-electrode stimulation only activated a portion of the total glycinergic input (n = 7 cells, t(6) = 2.89, p = 0.028, paired 2-tailed t test). E, Decay time constants (left plot) and 20–80% rise times (right plot) were not different between light-evoked and theta-electrode-evoked IPSCs (time constant: n = 7 cells, t(6) = 0.11, p = 919, paired 2-tailed t test; rise time: n = 7 cells, t(6) = 1.26, p = 0.25, paired 2-tailed t test). *p < 0.05, **p < 0.01).
To control for unforeseen effects of light stimulation on decay times, we compared the kinetics of isolated glycinergic IPSCs evoked by light versus theta-electrode stimulation measured from the same cells in GlyT-Cre/ChR2(H134R) Cre reporter tissue (Fig. 4C). Light-evoked IPSCs (200.2 ± 52.4 pA) were ∼2× larger than θ-evoked (95.5 ± 24 pA), suggesting that the θ electrode effectively stimulated around half of the total portion of glycinergic inputs, assuming light can trigger spikes in all glycinergic fibers (Fig. 4D; n = 7 cells, t(6) = 2.89, p = 0.028, paired two-tailed t test). However, light-evoked (2.24 ± 0.30 ms) versus θ-electrode-evoked (2.20 ± 0.34 ms) IPSCs had similar decay time constants (n = 7 cells, t(6) = 0.11, p = 919, paired two-tailed t test) and rise times (0.63 ± 0.06 vs 0.91 ± 0.21 ms; n = 7 cells, t(6) = 1.26, p = 0.25, paired two-tailed t test). Kinetic measures therefore appear to be unaffected by light stimulation. Isolated GABAergic IPSCs were also recorded with theta stimulation to determine whether slower IPSCs could be observed. This would presumably activate either coreleasing and/or pure sources of GABAergic input, including local GABAergic input. However, slower IPSCs were not observed.
Targeted stimulation of afferents from VNLL reveals coreleasing fibers
A prominent source of glycinergic input to the ICC comes from the VNLL. We therefore targeted expression of ChR2 to glycinergic neurons of the VNLL (see Materials and Methods), allowing for greater specificity in the source of stimulated fibers compared with global expression of ChR2 in glycinergic neurons. Intracranial viral injections resulted in infected cell bodies clearly localized to the VNLL (Fig. 5A, left) and heavy fiber labeling in the ipsilateral ICC (Fig. 5A, right). The average IPSC amplitude evoked from virally injected animals (156.5 ± 32.2 pA, n = 15 cells) was approximately one-third the size of IPSCs recorded in transgenic mice with global ChR2 expression in glycinergic fibers (368.0 ± 45.8 pA, n = 29 cells; Fig. 5B,C). This difference in amplitude could not be accounted for by the relatively older age range for virally injected animals as there was no correlation between age and IPSC amplitude in either the GlyT2-Cre;ChR2 dataset (n = 30 cells, R2 = 0.010, p = 0.60, linear regression) or the viral injection dataset (n = 15 cells, R2 = 0.007, p = 0.77, linear regression). Compared with IPSCs measured with global stimulation of glycinergic input (31 ± 4%, n = 29 cells), IPSCs resulting from light stimulation of glycinergic fibers from the VNLL were 42 ± 5% GABAergic (n = 15 cells; Fig. 5D; these values are not statistically different: t(42) = 1.77, p = 0.11, two-tailed t test).
Figure 5.

Light stimulation of glycinergic fibers ascending from the VNLL. A, Confocal images (10× tile) of coronal sections taken from a GlyT2-Cre mouse injected into the VNLL with an AAV (serotype 2/1) to drive expression of ChR2 in a Cre-dependent manner. Left, The injection is well targeted to the VNLL. Right, Ascending fibers from the VNLL permeate the central nucleus of the inferior colliculus. Atlas illustrations adapted from Paxinos and Franklin (2001). B, Light-evoked IPSCs recorded from a mouse with ChR2 targeted to glycinergic fibers ascending from the VNLL. Similar to photostimulation of global glycinergic input, bath application of glycine-receptor antagonist strychnine results in only partial block of the current, with the remainder blocked by GABA-receptor antagonist SR95531. C, Summary data of current amplitudes measured from control conditions, in strychnine (revealing the GABAergic component), and from the subtraction of these two currents (revealing the glycinergic component). The glycinergic (87.2 ± 20.3 pA) and GABAergic (69.5 ± 16.8 pA) components were significantly smaller in amplitude compared with the IPSCs measured in control conditions (156.5 ± 32.1 pA; n = 15 cells, F = 23.3, p < 0.001, Friedman test; post hoc control vs glycinergic p < 0.001 and control vs GABAergic p < 0.001). D, The average percentage component of GABA resulting from stimulation of glycinergic afferents from the VNLL was 41.6 ± 4.5% (n = 15 cells). E, Similar to global stimulation of glycinergic inputs to the inferior colliculus, the decay of the GABAergic component was slightly but significantly slower than that of the glycinergic component of the IPSC (n = 13 cells, F(2,12) = 8.09, p = 0.0021, repeated-measures 1-way ANOVA; post hoc GABAergic vs glycinergic p = 0.0015). F, Summary data of 20–80% rise times measured from components of the IPSC. Isolated GABAergic IPSC rise times were slightly but significantly slower (n = 13 cells, F = 9.39, p = 0.0092, Friedman test; post hoc GABAergic vs control p = 0.0324, GABAergic vs glycinergic p = 0.0181). *p < 0.05, **p < 0.01, ***p < 0.001).
We compared kinetic parameters between isolated glycinergic and GABAergic components and the findings were similar to what was seen with global stimulation. Decay times were similar but significantly slower for GABAergic (3.94 ± 0.33 ms) versus glycinergic (2.97 ± 0.19 ms) currents (Fig. 5E; control 3.53 ± 0.17 ms, n = 13 cells, F(2,12) = 8.09, p = 0.0021, repeated-measures one-way ANOVA; post hoc GABAergic vs glycinergic p = 0.0015). Unlike with global stimulation, the GABAergic rise time (1.09 ± 0.15 ms) was slightly but significantly slower than the average rise time measured in control conditions (0.91 ± 0.13 ms) or from the isolated glycinergic IPSC (0.92 ± 0.11 ms; Fig. 5F; n = 13 cells, F = 9.39, p = 0.0092, Friedman test; post hoc GABAergic vs control p = 0.0324, GABAergic vs glycinergic p = 0.0181).
All biophysical subtypes of ICC neurons received coreleased input
Given the wide variation in the fraction of the IPSC contributed by GABA, we asked whether this might vary with cell type in the ICC. Classification schemes of cell types in the ICC based on morphology, neurotransmitter content, and biophysical properties have not yet correlated in such a way to define agreed-upon subsets of neurons (Reetz and Ehret, 1999; Peruzzi et al., 2000; Bal et al., 2002; Wallace et al., 2012). We therefore categorized the firing properties of cells from which we recorded into five groups (Fig. 6) and compared these to the profile of inhibition. All five subtypes displayed light-evoked IPSCs as well as evidence for dual components based on the addition of either glycine-receptor or GABA-receptor antagonists to the bath. The average percentage GABAergic component present in the IPSCs of each cell type are as follows (followed by the number of cells in which percentage GABAergic component was determined out of the total number of the cell type recorded from that received input from photostimulation of glycinergic fibers): sustained, Ih, 32 ± 6% (n = 12 of 54 cells); sustained, 31 ± 6% (n = 6 of 14 cells); pauser, 44 ± 8% (n = 5 of 8 cells); strongly adapting, 37 ± 9% (n = 5 of 18 cells); and onset, 7.1% (n = 1 of 4 cells). Excluding the onset subtype, there was no difference in the percentage GABAergic component between cell types (n = 28 cells, F(3,24) = 0.65, p = 0.590, one-way ANOVA). Furthermore, general features of the IPSCs were similar between cell types, including amplitude (n = 29 cells across subtypes, F(3,25) = 1.74, p = 0.184, one-way ANOVA) and decay time (n = 26 cells across subtypes, F = 3.09, p = 0.377, Kruskal–Wallis).
Figure 6.
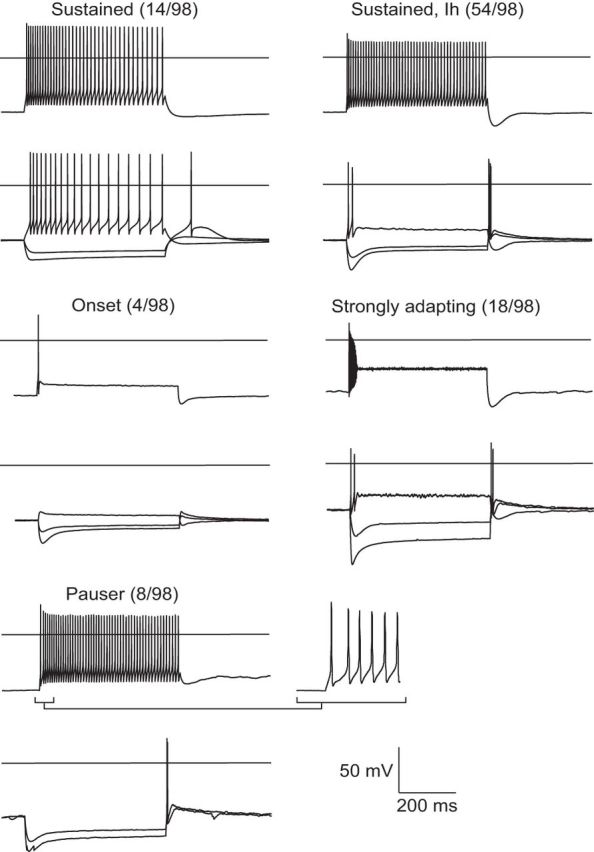
Intrinsic properties of neurons in the central nucleus of the inferior colliculus. Voltage traces displayed for −500, −200, +200, and +500 pA current steps. Firing properties were recorded in a total of 98 neurons, which were categorized into the five subtypes displayed. The pauser phenotype is revealed with a prehyperpolarizing step (−100 pA). Cells were held at −65 mV. Horizontal axes in traces indicate 0 mV.
High-frequency stimulation of coreleasing fibers does not support unique roles for GABA and glycine in short-term synaptic depression
Coreleased glycine and GABA at some auditory brainstem synapses differ in their short-term synaptic plasticity, particularly under periods of high activity. This may endow the neurotransmitters with unique roles in maintaining inhibition (Ishibashi et al., 2013; Fischl et al., 2014; Nerlich et al., 2014). In addition to enabling a glycine-source-specific comparison of amplitudes and kinetics, injections in the VNLL of the viral construct allowed us to study short-term synaptic plasticity in greater detail. This advantage became clear when, using the transgenic cross described above, we observed that light stimulation resulted in greater short-term synaptic depression compared with θ-electrode stimulation (data not shown). We reasoned that this difference in plasticity may result from ChR2 desensitization if the expression levels of ChR2 are just sufficient to drive spikes for a limited number of stimuli. Virally induced ChR2 expression results in higher expression levels of ChR2 that may compensate for this desensitization. Indeed, we found that during trains of stimuli, relative amplitudes of IPSCs evoked by light stimulation matched those of θ-electrode stimulation for ≤50 Hz in virally injected animals [Fig. 7A,B; light n10,20,50 Hz = 24, 18, 21 cells; theta n10,20,50 Hz = 5, 6, 6 cells; F10,20,50 Hz = 2.48, 1.48, 0.25; df10,20,50 Hz=(1,27), (1,22), (1,25); p10,20,50 Hz = 0.1267, 0.2375, 0.6208, two-way ANOVAs with repeated measures; 10 Hz data showed a significant interaction (p = 0.0083), but post hoc comparisons were not significant].
We next tested whether the relative contribution of glycine and GABA to the postsynaptic current is dependent on the length and frequency of stimulation. If true, this might suggest selective depletion of one transmitter over the other. However, no difference in synaptic depression was observed between control conditions and in the presence of strychnine when stimulating a train of 10 spikes at 10 Hz (Fig. 7C; n = 9 cells, F(1,8) = 0.682, p = 0.4328, two-way ANOVA with repeated measures on both factors). There was also no difference in depression when stimulating at a higher frequency for a longer time period, specifically driven at 50 Hz for 1 s (n = 10 cells, F(1,9) = 3.5, p = 0.0942, two-way ANOVA with repeated measures on both factors). These results indicate that the relative contributions of GABA and glycine to the total IPSC remains constant even during long trains of stimuli.
GABAB receptors are located on glutamatergic (Sun et al., 2006) and GABAergic (Ma et al., 2002) terminals in the ICC. We confirmed that glycinergic terminals likely express GABAB receptors as well: the addition of the GABAB-receptor agonist 10 μm baclofen decreased the amplitude of light-evoked IPSCs by an average of 39 ± 8% (Fig. 8Ai,Aii; ACSF, 286.6 ± 91.5 pA; baclofen, 167.6 ± 53.2 pA; wash, 258.6 ± 87.1 pA; n = 10 cells, F = 11.14, p = 0.0012, Friedman test; post hoc ACSF vs baclofen p = 0.004, baclofen vs wash p = 0.005; n = 10 cells, F(2,9) = 1.23, p = 0.3157, repeated-measures one-way ANOVA). While activation of presynaptic GABAB receptors is also expected to change paired-pulse depression, no change was observed (Fig. 8Aiii; ACSF, 0.76 ± 0.05; baclofen, 0.75 ± 0.05; wash, 0.75 ± 0.05; n = 10 cells, F(2,9) = 1.23, p = 0.3157, repeated-measures one-way ANOVA). However, baclofen did not affect the input resistance or bias current of the cells recorded from, and we conclude that paired-pulse ratio may not be a robust indicator of the expected presynaptic change (input resistance averages: 494.6 ± 115.7 MΩ in ACSF, 432.5 ± 85.2 MΩ in baclofen; n = 9 cells, t(8) = 1.35, p = 0.214, paired t test: bias current averages: −25.3 ± 24.3 pA in ACSF, −10.6 ± 31.1 pA in baclofen; n = 10 cells, t(9) = 1.45, p = 0.1819, paired t test).
Figure 8.

Coreleased GABA does not act on presynaptic GABAB receptors of glycinergic or glutamatergic fibers. A, Application of GABAB-receptor agonist baclofen depresses release of glycine/GABA from glycinergic terminals. Ai, Light-evoked IPSC amplitude over time from an example cell following bath application of baclofen (10 μm). Aii, Light-evoked IPSC amplitude is significantly decreased in the presence of baclofen compared with ACSF and wash (n = 10 cells, F = 11.14, p = 0.0012, Friedman test; post hoc ACSF vs baclofen p = 0.004, baclofen vs wash p = 0.005). Aiii, Paired-pulse depression of light-evoked IPSCs is unaffected by baclofen (n = 10 cells, F(2,9) = 1.23, p = 0.3157, repeated-measures 1-way ANOVA). B, Amplitudes of light-evoked IPSCs stimulated 10 times at 10 Hz (Bi) and at 50 Hz for 5 s (Bii) in control conditions and CGP55845 (2 μm) to block GABAB receptors. Neither stimulation frequency revealed a difference in short-term synaptic depression with the addition of CGP55845 (n = 5 cells, F(1,4)10,50 Hz = 0.007, 2.147; p10,50 Hz = 0.94, 0.22, 2-way ANOVA with repeated measures on both factors). C, Intense photostimulation of glycinergic fibers does not modify the release probability of glutamatergic terminals. Ci, The top trace shows an example where glutamatergic fibers are stimulated with a θ electrode two times with 100 ms interstimulus interval (black marks) before and after 50 Hz 1 ms light pulses delivered for 1 s (blue marks). The bottom traces show the theta-electrode-evoked EPSCs expanded (with individual sweeps shown in gray and the average of the sweeps shown in black; stimulus artifacts truncated for clarity). Intense photostimulation did not affect EPSC amplitude (Cii; n = 10 cells, t(9) = 0.59, p = 0.57, paired t test) or paired-pulse ratio (Ciii; n = 10 cells, t(9) = 1.12, p = 0.29, paired t test). **p < 0.01.
In vivo, iontophoresis of GABAB-receptor blockers alters response to tones (Vaughn et al., 1996), but the source of the GABA that reaches these receptors is unknown. We therefore tested whether the GABA coreleased from glycinergic terminals could act on presynaptic GABAB receptors to affect the release probability of the synapse. However, there was no difference in depression in trains of 10 (Fig. 8Bi) and 50 Hz (Fig. 8Bii) stimuli before and after application of the GABAB-receptor antagonist CGP55845 (2 μm; n = 5 cells, F(1,4)10,50 Hz = 0.007, 2.147; p10,50 Hz = 0.94, 0.22; two-way ANOVA with repeated measures on both factors). We also tested whether coreleased GABA could inhibit glutamate release in the ICC via activation of GABAB receptors located on glutamatergic terminals. We evoked EPSCs with theta stimulation (paired pulses, 100 ms interval) before and after intense photostimulation of glycinergic fibers (50 Hz 1 ms light pulses delivered for 5 s; Fig. 8Ci). If the coreleased GABA reaches GABAB receptors on glutamatergic terminals, this should depress release from these terminals, resulting in decreased EPSC amplitude and a larger ratio of the second to the first EPSC amplitude. However, similar to glycinergic fibers, there was no difference in either the amplitude of the first EPSC after intense photostimulation of glycinergic fibers (Fig. 8Cii; average 156.2 ± 30.7 pA pre-light train vs 157.6 ± 30.65 pA postlight train; n = 10 cells, t(9) = 0.59, p = 0.57, paired t test) or paired-pulse depression (Fig. 8Ciii; average 0.85 ± 0.02 prelight train vs 0.87 ± 0.03 postlight train; n = 10 cells, t(9) = 1.12, p = 0.29, paired t test).
Discussion
We found that glycinergic fibers ascending to the ICC corelease glycine and GABA. We proceeded to probe the currents for differences that have been shown at other synapses to endow the neurotransmitters with unique functions. Surprisingly, coreleased glycinergic and GABAergic currents in the ICC had strikingly similar features, including kinetics, contact with cell types in the ICC, short-term depression dynamics, and effect on presynaptic release. Therefore, despite the likely presence of corelease in the auditory midbrain into adulthood, our data do not support popular hypotheses for the functions of corelease.
Glycinergic neurons are found only as far up the neuraxis as the lemniscal nuclei, and their collicular inputs are probably the highest density of glycinergic synapses in the brain. From the midbrain on, GABA is the primary inhibitory transmitter of projection and interneurons. Yet even in the ICC, glycinergic afferents, largely ascending from VNLL, corelease GABA with glycine, suggesting that corelease is a highly conserved feature of glycinergic terminals. One line of evidence supporting corelease in the ICC is the presence of dual decay components observed in mIPSCs, which are the result of the release of a single synaptic vesicle. Glycine and GABA use the same vesicular transporter and are therefore packaged together into the same vesicle if both are present at the synaptic terminal (Wojcik et al., 2006). Mixed components within mIPSCs can be distinguished via differing receptor pharmacology and kinetics. Using allosteric modulators of the GABAA receptor to slow its decay, we found that 22.9 ± 2.8% of the mIPSCs were mixed. This percentage is an underestimation of the fraction of glycinergic terminals releasing GABA because the estimate also includes mIPSCs from GABAergic cells within the ICC. Corelease is further supported by the fact that GABA-receptor-mediated currents are recorded from cells in the ICC with targeted light stimulation of glycinergic fibers. Corelease has been described as characteristic of neonatal cells (<10 d old; Nabekura et al., 2004; Muller et al., 2006). However, we find prominent corelease in mature animals, which is consistent with immunohistochemical studies performed in adult animals and suggests functional importance of corelease in the mature ICC (Saint Marie et al., 1997; Riquelme et al., 2001; Tanaka and Ezure, 2004).
One way in which coreleased GABA and glycine could serve different functions is through differing postsynaptic kinetics, given that GABAergic currents typically decay more slowly (Russier et al., 2002). However, we found that in the ICC, GABAergic currents were nearly as fast as glycinergic currents (3.7 vs 3.0 ms respectively). This observation is likely accounted for by the fact that the α1 subunit that endows GABA receptors with fast kinetics is more common than α2 in the ICC (Milbrandt et al., 1997; Wässle et al., 2009; Dixon et al., 2014). Another possibility is that GABA corelease in the inferior colliculus shapes the kinetics of the glycinergic component of the IPSC. In trapezoid body neurons, GABA binds to glycine receptors as a coagonist to accelerate IPSC decay times, yielding IPSCs with submillisecond kinetics (Lu et al. 2008). It is possible that GABA corelease is similarly required to very precisely fine-tune the time course of inhibitory input to optimally balance excitatory input (Kim and Fiorillo, 2017).
Our viral injections demonstrate that at least some portion of coreleasing fibers in the ICC ascend from the VNLL. The VNLL is largely a monaural region and is therefore thought to be important for recognition of temporal patterns (Oertel and Wickesberg, 2002). Many cells in the VNLL show an onset pattern in response to sound stimuli with a stable first-spike latency across intensities (Zhang and Kelly, 2006; Liu et al., 2014). These cells likely receive their primary input from octopus cells of the cochlear nucleus (Adams, 1997; Pollak et al., 2011). The large inhibitory input from the VNLL to the ICC is therefore generally thought to provide precisely timed feedforward inhibition that would sculpt the tuning properties of cells in the ICC, particularly at the onset of sound (Covey and Casseday, 1991; Nayagam et al., 2005; Xie et al., 2007). The IPSC amplitude evoked from virally injected animals was smaller than in transgenic mice, suggesting that neurons in the ICC receive glycinergic input from multiple cells. The kinetic features and percentage of GABAergic input from glycinergic fibers ascending from the VNLL were similar to what we observed when stimulating global glycinergic input, suggesting that glycinergic inputs from the LSO may have similar properties.
Viral injections into the VNLL enabled us to examine dynamics of short-term synaptic depression for currents mediated by coreleased GABA versus glycine. There was no difference in synaptic depression exhibited in the presence of glycine-receptor blockers compared with control even with high-frequency stimulation, arguing against an activity-dependent shift in the GABA/glycine ratio observed at other coreleasing synapses (Ishibashi et al., 2013; Fischl et al., 2014; Nerlich et al., 2014). We also tested whether coreleased GABA could act on presynaptic GABAB receptors to affect synaptic release as reported in the anteroventral cochlear nucleus and spinal cord (Chéry and de Koninck, 1999; Lim et al., 2000). In the ICC, GABAB receptors are located on glutamatergic and GABAergic terminals (Ma et al., 2002; Sun et al., 2006), with little evidence for postsynaptic GABAB receptors outside of the dorsal cortex (Sun et al., 2006; Sun and Wu 2009). In this study, GABAB-receptor agonist depressed the amplitude of light-evoked IPSCs by 39 ± 8%. Though the paired-pulse depression was unaffected, it is likely that the GABAB receptors are largely presynaptic as the GABAB-receptor agonist shows no effect on the cells recorded in the ICC from either in this or previous studies. We asked whether the coreleased GABA could act on GABAB receptors to modify the release probability of either glycinergic or neighboring glutamatergic fibers. However, intense photostimulation to maximize GABA release from glycinergic terminals did not change the release properties of either glycinergic or glutamatergic terminals. We therefore did not observe any evidence for a unique role for coreleased GABA in GABAB-receptor activation.
The balance of glycinergic and GABAergic transmission from coreleasing afferents not only relies on presynaptic loading of glycine and GABA into single vesicles, but also postsynaptic receptor expression. We therefore compared response properties to photostimulation across cell types in the ICC categorized according to firing properties in response to current injection. We observed firing patterns similar to those described by Ono et al. (2005), except that we did not attempt to further categorize subtypes based on neurotransmitter content, levels of spike adaptation during the train, and firing rate. The pauser firing pattern is mediated by a fast inactivating K conductance known as A-type current (Sivaramakrishnan and Oliver, 2001). The sag and rebound displayed by all but sustained subtypes are likely mediated by Ih, a hyperpolarization-activated cation current (Koch and Grothe, 2003). The rebound hump present in sustained neurons lacking Ih could be accounted for by activation of calcium channels (Sivaramakrishnan and Oliver, 2001). All of these subtypes showed light-evoked IPSCs with similar GABA/glycine ratios and kinetic features (with the possible exception of onset cells). However, some types may be found to express a unique complement of inhibitory receptors as cell-type definitions in the ICC are refined.
Given the strikingly similar features of glycinergic and GABAergic currents in the ICC, it is possible that corelease provides a mechanism for finer inhibitory tuning via independent receptor modulation. Glycine transmission in this study made up the majority of the IPSC amplitudes. Glycine receptors may therefore be relatively more important for setting strength of inhibition, whereas GABA receptors, with their smaller unitary conductance and more complex subunit diversity, could allow for inhibitory refinement. Differential modulation of GABA and glycine receptors, by neurosteroids and zinc for instance, could also aid in tuning inhibition (Hosie et al., 2003; Belelli and Lambert, 2005; Trombley et al., 2011). Independent receptor modulation coupled with the highly similar features of coreleased GABA and glycine observed in this study may further permit the neurotransmitters to compensate for one another under conditions where one system is compromised (Takazawa et al., 2017). Aging, acoustic trauma, and tinnitus have all been associated with hyperactivity and decreased GABAergic activity in the inferior colliculus (Caspary et al., 2008; Robertson and Mulders, 2012; Auerbach et al., 2014; Ropp et al., 2014). Interestingly, unilateral acoustic trauma or cochlear ablation results in decreased GABA release and GABAA-receptor expression in the inferior colliculus without any persistent change in levels of glycine-receptor mRNA or [3H]strychnine binding (Suneja et al., 1998; Yan et al., 2007; Dong et al., 2010a,b). Corelease may therefore provide a necessary redundancy that maintains the homeostasis of inhibition in the ICC.
In summary, current models about the functional impact of glycine and GABA corelease in the auditory brainstem are not supported in the auditory midbrain even though corelease likely persists into adulthood. However, the resulting diversity in postsynaptic receptors could serve to maintain homeostasis of inhibitory networks integrated by the ICC, including under such conditions as aging or acoustic trauma where one neurotransmitter system may be preferentially affected.
Footnotes
This work was supported by National Institutes of Health Grants DC004450 to L.O.T. and DC015187-01 to L.A.M. We thank members of the L.O.T. laboratory for helpful discussions and Ruby Larisch and Michael Bateschell for assistance with mouse colony management.
The authors declare no competing financial interests.
References
- Adams JC. (1997) Projections from octopus cells of the posteroventral cochlear nucleus to the ventral nucleus of the lateral lemniscus in cat and human. Aud Neurosci 3:335–350. [Google Scholar]
- Apostolides PF, Trussell LO (2013) Rapid, activity-independent turnover of vesicular transmitter content at a mixed glycine/GABA synapse. J Neurosci 33:4768–4781. 10.1523/JNEUROSCI.5555-12.2013 [DOI] [PMC free article] [PubMed] [Google Scholar]
- Atasoy D, Aponte Y, Su HH, Sternson SM (2008) A FLEX switch targets channelrhodopsin-2 to multiple cell types for imaging and long-range circuit mapping. J Neurosci 28:7025–7030. 10.1523/JNEUROSCI.1954-08.2008 [DOI] [PMC free article] [PubMed] [Google Scholar]
- Auerbach BD, Rodrigues PV, Salvi RJ (2014) Central gain control in tinnitus and hyperacusis. Front Neurol 5:1–21. 10.3389/fneur.2014.00206 [DOI] [PMC free article] [PubMed] [Google Scholar]
- Awatramani GB, Turecek R, Trussell LO (2005) Staggered development of GABAergic and glycinergic transmission in the MNTB. J Neurophysiol 93:819–828. 10.1152/jn.00798.2004 [DOI] [PubMed] [Google Scholar]
- Bal R, Green GG, Rees A, Sanders DJ (2002) Firing patterns of inferior colliculus neurons—histology and mechanism to change firing patterns in rat brain slices. Neurosci Lett 317:42–46. 10.1016/S0304-3940(01)02425-9 [DOI] [PubMed] [Google Scholar]
- Belelli D, Lambert JJ (2005) Neurosteroids: endogenous regulators of the GABAA receptor. Nat Rev Neurosci 6:565–575. 10.1038/nrn1703 [DOI] [PubMed] [Google Scholar]
- Brunso-Bechtold JK, Thompson GC, Masterton RB (1981) HRP study of the organization of auditory afferents ascending to central nucleus of inferior colliculus in cat. J Comp Neurol 197:705–722. 10.1002/cne.901970410 [DOI] [PubMed] [Google Scholar]
- Cant NB. (2005) Projections from the cochlear nuclear complex to the inferior colliculus. In: The inferior colliculus (Winer JA, Schreiner CE, eds), pp 115–131. New York: Springer. [Google Scholar]
- Caspari F, Baumann VJ, Garcia-Pino E, Koch U (2015) Heterogeneity of intrinsic and synaptic properties of neurons in the ventral and dorsal parts of the ventral nucleus of the lateral lemniscus. Front Neural Circuits 9:74. 10.3389/fncir.2015.00074 [DOI] [PMC free article] [PubMed] [Google Scholar]
- Caspary DM, Ling L, Turner JG, Hughes LF (2008) Inhibitory neurotransmission, plasticity and aging in the mammalian central auditory system. J Exp Biol 211:1781–1791. 10.1242/jeb.013581 [DOI] [PMC free article] [PubMed] [Google Scholar]
- Chéry N, de Koninck Y (1999) Junctional versus extrajunctional glycine and GABAA receptor-mediated IPSCs in identified lamina I neurons of the adult rat spinal cord. J Neurosci 19:7342–7355. [DOI] [PMC free article] [PubMed] [Google Scholar]
- Clements JD, Bekkers JM (1997) Detection of spontaneous synaptic events with an optimally scaled template. Biophysical J 73:220–229. 10.1016/S0006-3495(97)78062-7 [DOI] [PMC free article] [PubMed] [Google Scholar]
- Covey E, Casseday JH (1991) The monaural nuclei of the lateral lemniscus in an echolocating bat: parallel pathways for analyzing temporal features of sound. J Neurosci 11:3456–3470. [DOI] [PMC free article] [PubMed] [Google Scholar]
- Dixon C, Sah P, Lynch JW, Keramidas A (2014) GABAA receptor α and γ subunits shape synaptic currents via different mechanisms. J Biol Chem 289:5399–5411. 10.1074/jbc.M113.514695 [DOI] [PMC free article] [PubMed] [Google Scholar]
- Dong S, Mulders WH, Rodger J, Woo S, Robertson D (2010a) Acoustic trauma evokes hyperactivity and changes in gene expression in guinea-pig auditory brainstem. Eur J Neurosci 31:1616–1628. 10.1111/j.1460-9568.2010.07183.x [DOI] [PubMed] [Google Scholar]
- Dong S, Rodger J, Mulders WH, Robertson D (2010b) Tonotopic changes in GABA receptor expression in guinea pig inferior colliculus after partial unilateral hearing loss. Brain Res 1342:24–32. 10.1016/j.brainres.2010.04.067 [DOI] [PubMed] [Google Scholar]
- Fischl MJ, Weimann SR, Kearse MG, Burger RM (2014) Slowly emerging glycinergic transmission enhances inhibition in the sound localization pathway of the avian auditory system. J Neurophysiol 111:565–572. 10.1152/jn.00640.2013 [DOI] [PMC free article] [PubMed] [Google Scholar]
- Franzen DL, Gleiss SA, Berger C, Kümpfbeck FS, Ammer JJ, Felmy F (2015) Development and modulation of intrinsic membrane properties control the temporal precision of auditory brain stem neurons. J Neurophysiol 113:524–536. 10.1152/jn.00601.2014 [DOI] [PubMed] [Google Scholar]
- Glendenning KK, Baker BN, Hutson KA, Masterton RB (1992) Acoustic chiasm V: inhibition and excitation in the ipsilateral and contralateral projections of LSO. J Comp Neurol 319:100–122. 10.1002/cne.903190110 [DOI] [PubMed] [Google Scholar]
- Haplea S, Covey E, Casseday JH (1994) Frequency tuning and response latencies at three levels in the brainstem of the echolocating bat, Eptesicus fuscus. J Comp Physiol A 174:671–683. [DOI] [PubMed] [Google Scholar]
- Helfert RH, Juiz JM, Bledsoe SC Jr, Bonneau JM, Wenthold RJ, Altschuler RA (1992) Patterns of glutamate, glycine, and GABA immunolabeling in four synaptic terminal classes in the lateral superior olive of the guinea pig. J Comp Neurol 323:305–325. 10.1002/cne.903230302 [DOI] [PubMed] [Google Scholar]
- Hosie AM, Dunne EL, Harvey RJ, Smart TG (2003) Zinc-mediated inhibition of GABA(A) receptors: discrete binding sites underlie subtype specificity. Nat Neurosci 6:362–369. 10.1038/nn1030 [DOI] [PubMed] [Google Scholar]
- Ishibashi H, Yamaguchi J, Nakahata Y, Nabekura J (2013) Dynamic regulation of glycine-GABA co-transmission at spinal inhibitory synapses by neuronal glutamate transporter. J Physiol 591:3821–3832. 10.1113/jphysiol.2012.250647 [DOI] [PMC free article] [PubMed] [Google Scholar]
- Ishihara N, Armsen W, Papadopoulos T, Betz H, Eulenburg V (2010) Generation of a mouse line expressing Cre recombinase in glycinergic interneurons. Genesis 48:437–445. 10.1002/dvg.20640 [DOI] [PubMed] [Google Scholar]
- Jonas P, Bischofberger J, Sandkühler J (1998) Corelease of two fast neurotransmitters at a central synapse. Science 281:419–424. 10.1126/science.281.5375.419 [DOI] [PubMed] [Google Scholar]
- Joris PX, Schreiner CE, Rees A (2004) Neural processing of amplitude-modulated sounds. Physiol Rev 84:541–577. 10.1152/physrev.00029.2003 [DOI] [PubMed] [Google Scholar]
- Kim JK, Fiorillo CD (2017) Theory of optimal balance predicts and explains the amplitude and decay time of synaptic inhibition. Nat Commun 8:14566. 10.1038/ncomms14566 [DOI] [PMC free article] [PubMed] [Google Scholar]
- Koch U, Grothe B (2003) Hyperpolarization-activated current (Ih) in the inferior colliculus: distribution and contribution to temporal processing. J Neurophysiol 90:3679–3687. 10.1152/jn.00375.2003 [DOI] [PubMed] [Google Scholar]
- Kotak VC, Korada S, Schwartz IR,Sanes DH (1998) A developmental shift from GABAergic to glycinergic transmission in the central auditory system. J Neurosci 18:4646–4655. [DOI] [PMC free article] [PubMed] [Google Scholar]
- Kuo SP, Bradley LA, Trussell LO (2009) Heterogeneous kinetics and pharmacology of synaptic inhibition in the chick auditory brainstem. J Neurosci 29:9625–9634. 10.1523/JNEUROSCI.0103-09.2009 [DOI] [PMC free article] [PubMed] [Google Scholar]
- Lim R, Alvarez FJ, Walmsley B (2000) GABA mediates presynaptic inhibition at glycinergic synapses in a rat auditory brainstem nucleus. J Physiol 525:447–459. 10.1111/j.1469-7793.2000.t01-1-00447.x [DOI] [PMC free article] [PubMed] [Google Scholar]
- Liu HH, Huang CF, Wang X (2014) Acoustic signal characteristic detection by neurons in ventral nucleus of the lateral lemniscus in mice. Dongwuxue Yanjiu 35:500–509. 10.13918/j.issn.2095-8137.2014.6.500 [DOI] [PMC free article] [PubMed] [Google Scholar]
- Loftus WC, Bishop DC, Oliver DL (2010) Differential patterns of inputs create functional zones in central nucleus of inferior colliculus. J Neurosci 30:13396–13408. 10.1523/JNEUROSCI.0338-10.2010 [DOI] [PMC free article] [PubMed] [Google Scholar]
- Lu HW, Trussell LO (2016) Spontaneous activity defines effective convergence ratios in an inhibitory circuit. J Neurosci 36:3268–3280. 10.1523/JNEUROSCI.3499-15.2016 [DOI] [PMC free article] [PubMed] [Google Scholar]
- Lu T, Rubio ME, Trussell LO (2008) Glycinergic transmission shaped by the corelease of GABA in a mammalian auditory synapse. Neuron 57:524–535. 10.1016/j.neuron.2007.12.010 [DOI] [PubMed] [Google Scholar]
- Ma CL, Kelly JB, Wu SH (2002) Presynaptic modulation of GABAergic inhibition by GABAB receptors in the rat's inferior colliculus. Neuroscience 114:207–215. 10.1016/S0306-4522(02)00130-6 [DOI] [PubMed] [Google Scholar]
- Milbrandt JC, Hunter C, Caspary DM (1997) Alterations of GABAA receptor subunit mRNA levels in the aging Fischer 344 rat inferior colliculus. J Comp Neurol 379:455–465. 10.1002/(SICI)1096-9861(19970317)379:3%3C455::AID-CNE10%3E3.0.CO;2-F [DOI] [PubMed] [Google Scholar]
- Muller E, Le Corronc H, Triller A, Legendre P (2006) Developmental dissociation of presynaptic inhibitory neurotransmitter and postsynaptic receptor clustering in the hypoglossal nucleus. Mol Cell Neurosci 32:254–273. 10.1016/j.mcn.2006.04.007 [DOI] [PubMed] [Google Scholar]
- Nabekura J, Katsurabayashi S, Kakazu Y, Shibata S, Matsubara A, Jinno S, Mizoguchi Y, Sasaki A, Ishibashi H (2004) Developmental switch from GABA to glycine release in single central synaptic terminals. Nat Neurosci 7:17–23. 10.1038/nn1170 [DOI] [PubMed] [Google Scholar]
- Nayagam DA, Clarey JC, Paolini AG (2005) Powerful, onset inhibition in the ventral nucleus of the lateral lemniscus. J Neurophysiol 94:1651–1654. 10.1152/jn.00167.2005 [DOI] [PubMed] [Google Scholar]
- Nerlich J, Kuenzel T, Keine C, Korenic A, Rübsamen R, Milenkovic I (2014) Dynamic fidelity control to the central auditory system: synergistic glycine/GABAergic inhibition in the cochlear nucleus. J Neurosci 34:11604–11620. 10.1523/JNEUROSCI.0719-14.2014 [DOI] [PMC free article] [PubMed] [Google Scholar]
- Oertel D, Wickesberg RE (2002) Ascending pathways through ventral nuclei of the lateral lemniscus and their possible role in pattern recognition in natural sounds. In: Integrative functions in the mammalian auditory pathway (Oertel D, Fay RR, Popper AN, eds), pp 207–237. New York: Springer. [Google Scholar]
- Oliver DL. (2005) Neuronal organization in the inferior colliculus. In: The inferior colliculus (Winer JA, Schreiner CE, eds), pp 69–114. New York: Springer. [Google Scholar]
- Ono M, Yanagawa Y, Koyano K (2005) GABAergic neurons in inferior colliculus of the GAD67-GFP knock-in mouse: electrophysiological and morphological properties. Neurosci Res 51:475–492. 10.1016/j.neures.2004.12.019 [DOI] [PubMed] [Google Scholar]
- Paxinos G, Franklin KBJ (2001) The mouse brain in stereotaxic coordinates. San Diego: Academic Press. [Google Scholar]
- Peruzzi D, Sivaramakrishnan S, Oliver DL (2000) Identification of cell types in brain slices of the inferior colliculus. Neuroscience 101:403–416. 10.1016/S0306-4522(00)00382-1 [DOI] [PubMed] [Google Scholar]
- Pollak GD, Xie R, Gittelman JX, Andoni S, Li N (2011) The dominance of inhibition in the inferior colliculus. Hear Res 274:27–39. 10.1016/j.heares.2010.05.010 [DOI] [PMC free article] [PubMed] [Google Scholar]
- Reetz G, Ehret G (1999) Inputs from three brainstem sources to identified neurons of the mouse inferior colliculus slice. Brain Res 816:527–543. 10.1016/S0006-8993(98)01230-X [DOI] [PubMed] [Google Scholar]
- Riquelme R, Saldaña E, Osen KK, Ottersen OP, Merchán MA (2001) Colocalization of GABA and glycine in the ventral nucleus of the lateral lemniscus in rat: an in situ hybridization and semiquantitative immunocytochemical study. J Comp Neurol 432:409–424. 10.1002/cne.1111 [DOI] [PubMed] [Google Scholar]
- Roberts MT, Bender KJ, Trussell LO (2008) Fidelity of complex spike-mediated synaptic transmission between inhibitory interneurons. J Neurosci 28:9440–9450. 10.1523/JNEUROSCI.2226-08.2008 [DOI] [PMC free article] [PubMed] [Google Scholar]
- Robertson D, Mulders W (2012) The inferior colliculus: involvement in hyperactivity and tinnitus. In: Tinnitus (Eggermont JJ, Zeng FG, Popper AN, Fay RR, eds), pp 121–135. New York: Springer. [Google Scholar]
- Ropp TJ, Tiedemann KL, Young ED, May BJ (2014) Effects of unilateral acoustic trauma on tinnitus-related spontaneous activity in the inferior colliculus. JARO 15:1007–1022. 10.1007/s10162-014-0488-2 [DOI] [PMC free article] [PubMed] [Google Scholar]
- Rubio ME, Juiz JM (2004) Differential distribution of synaptic endings containing glutamate, glycine, and GABA in the rat dorsal cochlear nucleus. J Comp Neurol 477:253–272. 10.1002/cne.20248 [DOI] [PubMed] [Google Scholar]
- Russier M, Kopysova IL, Ankri N, Ferrand N, Debanne D (2002) GABA and glycine co-release optimizes functional inhibition in rat brainstem motoneurons in vitro. J Physiol 541:123–137. 10.1113/jphysiol.2001.016063 [DOI] [PMC free article] [PubMed] [Google Scholar]
- Saint Marie RL, Baker RA (1990) Neurotransmitter-specific uptake and retrograde transport of [3H]glycine from the inferior colliculus by ipsilateral projections of the superior olivary complex and nuclei of the lateral lemniscus. Brain Res 524:244–253. 10.1016/0006-8993(90)90698-B [DOI] [PubMed] [Google Scholar]
- Saint Marie RL, Ostapoff EM, Morest DK, Wenthold RJ (1989) Glycine-immunoreactive projection of the cat lateral superior olive: possible role in midbrain ear dominance. J Comp Neurol 279:382–396. 10.1002/cne.902790305 [DOI] [PubMed] [Google Scholar]
- Saint Marie RL, Shneiderman A, Stanforth DA (1997) Patterns of γ-aminobutyric acid and glycine immunoreactivities reflect structural and functional differences of the cat lateral lemniscal nuclei. J Comp Neurol 389:264–276. 10.1002/(SICI)1096-9861(19971215)389:2%3C264::AID-CNE6%3E3.0.CO;2-%23 [DOI] [PubMed] [Google Scholar]
- Sivaramakrishnan S, Oliver DL (2001) Distinct K currents result in physiologically distinct cell types in the inferior colliculus of the rat. J Neurosci 21:2861–2877. [DOI] [PMC free article] [PubMed] [Google Scholar]
- Sun H, Wu SH (2009) The physiological role of presynaptic and postsynaptic GABAB receptors in membrane excitability and synaptic transmission of neurons in the rat's dorsal cortex of the inferior colliculus. Neuroscience 160:198–211. 10.1016/j.neuroscience.2009.02.011 [DOI] [PubMed] [Google Scholar]
- Sun H, Ma CL, Kelly JB, Wu SH (2006) GABAB receptor-mediated presynaptic inhibition of glutamatergic transmission in the inferior colliculus. Neurosci Lett 399:151–156. 10.1016/j.neulet.2006.01.049 [DOI] [PubMed] [Google Scholar]
- Suneja SK, Potashner SJ, Benson CG (1998) Plastic changes in glycine and GABA release and uptake in adult brain stem auditory nuclei after unilateral middle ear ossicle removal and cochlear ablation. Exp Neurol 151:273–288. 10.1006/exnr.1998.6812 [DOI] [PubMed] [Google Scholar]
- Takazawa T, Choudhury P, Tong CK, Conway CM, Scherrer G, Flood PD, Mukai J, MacDermott AB (2017) Inhibition mediated by glycinergic and GABAergic receptors on excitatory neurons in mouse superficial dorsal horn is location-specific but modified by inflammation. J Neurosci 37:2336–2348. 10.1523/JNEUROSCI.2354-16.2017 [DOI] [PMC free article] [PubMed] [Google Scholar]
- Tanaka I, Ezure K (2004) Overall distribution of GLYT2 mRNA-containing versus GAD67 mRNA-containing neurons and colocalization of both mRNAs in midbrain, pons, and cerebellum in rats. Neurosci Res 49:165–178. 10.1016/j.neures.2004.02.007 [DOI] [PubMed] [Google Scholar]
- Tritsch NX, Granger AJ, Sabatini BL (2016) Mechanisms and functions of GABA co-release. Nat Rev Neurosci 17:139–145. 10.1038/nrn.2015.21 [DOI] [PMC free article] [PubMed] [Google Scholar]
- Trombley PQ, Blakemore LJ, Hill BJ (2011) Zinc modulation of glycine receptors. Neuroscience 186:32–38. 10.1016/j.neuroscience.2011.04.021 [DOI] [PMC free article] [PubMed] [Google Scholar]
- Vaughn MD, Pozza MF, Lingenhöhl K (1996) Excitatory acoustic responses in the inferior colliculus of the rat are increased by GABAB receptor blockade. Neuropharmacology 35:1761–1767. [DOI] [PubMed] [Google Scholar]
- Wallace MN, Shackleton TM, Palmer AR (2012) Morphological and physiological characteristics of laminar cells in the central nucleus of the inferior colliculus. Front Neural Circuits 6:55. 10.3389/fncir.2012.00055 [DOI] [PMC free article] [PubMed] [Google Scholar]
- Wässle H, Heinze L, Ivanova E, Majumdar S, Weiss J, Harvey RJ, Haverkamp S (2009) Glycinergic transmission in the mammalian retina. Front Mol Neurosci 2:6. 10.3389/neuro.02.006.2009 [DOI] [PMC free article] [PubMed] [Google Scholar]
- Weisz CJ, Rubio ME, Givens RS, Kandler K (2016) Excitation by axon terminal GABA spillover in a sound localization circuit. J Neurosci 36:911–925. 10.1523/JNEUROSCI.1132-15.2016 [DOI] [PMC free article] [PubMed] [Google Scholar]
- Winer JA, Larue DT, Pollak GD (1995) GABA and glycine in the central auditory system of the mustache bat: structural substrates for inhibitory neuronal organization. J Comp Neurol 355:317–353. 10.1002/cne.903550302 [DOI] [PubMed] [Google Scholar]
- Wojcik SM, Katsurabayashi S, Guillemin I, Friauf E, Rosenmund C, Brose N, Rhee JS (2006) A shared vesicular carrier allows synaptic corelease of GABA and glycine. Neuron 50:575–587. 10.1016/j.neuron.2006.04.016 [DOI] [PubMed] [Google Scholar]
- Xie R, Manis PB (2013) Target-specific IPSC kinetics promote temporal processing in auditory parallel pathways. J Neurosci 33:1598–1614. 10.1523/JNEUROSCI.2541-12.2013 [DOI] [PMC free article] [PubMed] [Google Scholar]
- Xie R, Gittelman JX, Pollak GD (2007) Rethinking tuning: in vivo whole-cell recordings of the inferior colliculus in awake bats. J Neurosci 27:9469–9481. 10.1523/JNEUROSCI.2865-07.2007 [DOI] [PMC free article] [PubMed] [Google Scholar]
- Yan L, Suneja SK, Potashner SJ (2007) Protein kinases regulate glycine receptor binding in brain stem auditory nuclei after unilateral cochlear ablation. Brain Res 1135:102–106. 10.1016/j.brainres.2006.12.013 [DOI] [PMC free article] [PubMed] [Google Scholar]
- Zeilhofer HU, Studler B, Arabadzisz D, Schweizer C, Ahmadi S, Layh B, Bösl MR, Fritschy JM (2005) Glycinergic neurons expressing enhanced green fluorescent protein in bacterial artificial chromosome transgenic mice. J Comp Neurol 482:123–141. 10.1002/cne.20349 [DOI] [PubMed] [Google Scholar]
- Zhang H, Kelly JB (2006) Responses of neurons in the rat's ventral nucleus of the lateral lemniscus to monaural and binaural tone bursts. J Neurophysiol 95:2501–2512. 10.1152/jn.01215.2005 [DOI] [PubMed] [Google Scholar]
- Zhang LL, Chen L, Xue Y, Yung WH (2008) Modulation of synaptic GABAA receptor function by zolpidem in substantia nigra pars reticulata. Acta Pharmacol Sin 29:161–168. 10.1111/j.1745-7254.2008.00735.x [DOI] [PubMed] [Google Scholar]