

Abstract
Racial disparities in obesity among women in the United States are substantial but the causes of these disparities are poorly understood. We examined changes in body mass index (BMI) trajectories for Black and White women as a function of neighborhood disadvantage and racial composition of the neighborhoods within which respondents are clustered. Using four waves of the Americans’ Changing Lives (ACL) survey, we estimated multilevel models predicting BMI trajectories over a 16 year period. Even after controlling for individual-level socio-demographics, risk and protective factors, and baseline neighborhood disadvantage and racial composition, substantial racial disparities in BMI persisted at each time point, and widened over time (p<.05). Baseline neighborhood disadvantage is associated with BMI and marginally reduces racial disparities in BMI, but it does not predict BMI changes over time. However, without neighborhood-level variables, the BMI trajectory model is misspecified, highlighting the importance of including community factors in future research.
Keywords: BMI, trajectories, neighborhood effects, racial disparities
Racial health disparities are a persistent problem in the United States and their elimination is a current public health goal (HHS, 2000). Unfortunately, evidence suggests that health disparities for many conditions have not narrowed over the last decade, and may have even widened in recent decades (Pappas, et al., 1993; Reither, et al., 2006; Singh and Siahpush, 2002; Steenland, 2002). Many scholars suggest that obesity is a serious public health crisis that threatens to perpetuate and/or exacerbate racial disparities in health and premature mortality (Flegal, Carroll, Ogden, and Johnson, 2002; Kumanyika, 2005; Mokdad et al., 2001; Olshansky, et al., 2005). Increases in body mass have been pervasive in the U.S., with about two out of every three adults now falling into Centers for Disease Control and Prevention (CDC) defined categories for being overweight or obese (Wang and Beydoun, 2007). According to the CDC, BMI of 25 to 29 denotes overweight status and BMI of 30 or more denotes obesity (Wang and Beydoun, 2007).
Beyond the ubiquitous increases in obesity, also disturbing are the large and persistent disparities in overweight and obesity by gender and race/ethnicity. Although racial/ethnic differences in the prevalence of obesity tend to be relatively small for men, they are pronounced for women (Ogden, et al., 2006; Seo and Torabi, 2006). A recent study showed that nearly half (49.0%) of all non-Hispanic Black women in the U.S. are obese, far exceeding the prevalence of obesity for non-Hispanic White women (30.7%), which in turn slightly exceeds that of non-Hispanic White men (28.2 %) and Black men (27.9 %) (Wang and Beydoun, 2007).
Reducing rates of obesity and disparities in obesity between non-Hispanic Black and White women (use of these terms throughout the paper implies non-Hispanic) is contingent upon understanding their causes. One explanation is that individual socioeconomic characteristics, such as income and education, account for Black-White disparities through their joint association with race/ethnicity and obesity. However, prior research demonstrates that individual socioeconomic factors account for only a small portion of observed racial disparities in obesity (Ogden, et al., 2006; Robert and Reither, 2004; Seo and Torabi, 2006; Wang and Beydoun, 2007).
Beyond individual SES, neighborhood socioeconomic and racial context may hold important clues to understanding the etiology of Black-White disparities in obesity. Socioeconomically disadvantaged neighborhoods tend to have an abundance of fast food outlets and convenience stores (Reidpath, et al., 2002), but limited numbers of grocery stores or supermarkets, which tend to offer healthier foods (Morland, et al., 2001). Decaying infrastructure and relatively high crime rates in such neighborhoods may also discourage healthy leisure-time physical activity (Yen and Kaplan, 1998).
Blacks are more likely than Whites to reside in disadvantaged, stressful neighborhoods that discourage healthy choices with regard to physical activity and nutrition. Moreover, even at the same level of family income, middle class Blacks are less successful than middle class Whites at translating their socioeconomic status into the best neighborhoods (Logan, et al., 1996). Therefore, compared to middle class Whites, both poor and more affluent Blacks are more likely to reside in disadvantaged neighborhoods that may encourage obesity.
One cross-sectional, nationally-representative study found that neighborhood disadvantage explained a statistically significant but small portion of Black-White disparities in BMI among women (b was reduced to 2.21 from 2.50, p<=.001) beyond the contribution of individual-level factors (Robert and Reither, 2004). Do and colleagues (2007) also examined neighborhood effects on racial disparities, using cross-sectional data from NHANES III. They demonstrated that racial disparities in BMI among women actually increased after controlling for many neighborhood characteristics, and that neighborhood effects have a very small association with BMI. Contrary to expectations, these two cross-sectional studies suggest only a small influence of neighborhood characteristics on BMI among Black and White women.
There are few longitudinal studies that have investigated neighborhood effects on racial disparities in BMI trajectories. As an exception, Mujahid et al. (2005) used longitudinal data from the Arthrosclerosis Risk in Communities (ARIC) Study to find ubiquitous BMI increases over five years, with the largest increase found for White women (BMI increased by 0.92). For Black women, BMI increased over the same period, but by a smaller amount (0.68). Importantly, Mujahid et al. (2005) did not find that BMI increases were greater among disadvantaged individuals or individuals living in disadvantaged neighborhoods. A second study using ARIC data found that neighborhood disadvantage was associated with BMI for women at baseline (first time period), but not over time (Mujahid, et al., 2008). Thus, Mujahid et al. (2008) find a correlation, but not a causal relationship, between neighborhood disadvantage and BMI.
The Moving to Opportunity Study (MTO) used an experimental design to examine the causal effects of neighborhood disadvantage on a range of health and other social outcomes among public housing residents living in five cities (Baltimore, Boston, Chicago, Los Angeles, and New York) (Kling, et al., 2004). In this experiment, one group of public housing residents was given special vouchers requiring them to move into low poverty neighborhoods; another group was given traditional vouchers but no stipulation on where they could move; the control group was not given a voucher to leave their current public housing. Five years after the relocations, the experimental group required to move into low poverty neighborhoods demonstrated a significant decline in obesity (b=−.103, p<=.05) compared to the control group that remained in public housing. The experimental group that was not required to live in a low poverty neighborhood showed no improvements or reductions in obesity compared to the control group five years later. Thus, Kling et al. (2004) provide some evidence that disadvantaged neighborhoods produce obesity (or that less advantaged neighborhoods reduce obesity), at least among those living in poverty.
The MTO study did not examine race. Residents of public housing are predominantly Black, and live in neighborhoods with high concentrations of Blacks. We do not know if moving to less racially segregated neighborhoods accounted for some of the decline in obesity, although this seems plausible. Segregated Black neighborhoods are associated with neighborhood disadvantage (Massey and Eggers, 1990), which makes it difficult to disentangle race and SES at the neighborhood level. In fact, some scholars assert that racial residential segregation is the fundamental cause of racial differences in neighborhood-level SES (Williams and Collins, 2001). If residents moving to low poverty neighborhoods also enter more racially integrated neighborhoods, this racial context may be a determinant of obesity outcomes and trajectories.
Racial residential segregation is hypothesized to affect health through both structural and interpersonal pathways (Acevedo-Garcia, et al. 2003; Collins and Williams, 1999; LaVeist, 1989, 1993; Polednak, 1993, 1996; Schulz, et al., 2002). Racial segregation can reinforce racial differences in opportunity structures and access to resources that affect obesity. This means that residents of highly segregated areas have differential access to health care, quality food stores, recreational facilities and safe, walkable streets. The interpersonal pathway suggests that living in segregated areas can increase experiences or perceptions of racism that can increase stress and other psychosocial factors (e.g., fatalism) that may be more proximal determinants of obesity.
One study that examined the influence of racial residential segregation on BMI found no association for Whites, but a small effect for Blacks (Chang 2006). For Blacks, a one percent increase in segregation was associated with an average BMI increase of .25, controlling for population size, median MSA income, region of country, and individual-level predictors.
Unfortunately, previous research has tended to focus on either neighborhood disadvantage or neighborhood racial segregation when examining racial disparities in BMI, but not both. Moreover, most studies have used only cross-sectional data to examine the effects of neighborhood context on racial disparities in body mass.
Our study examines the effects of neighborhood disadvantage and neighborhood racial composition on body mass trajectories of Black and White women over a 16 year period, thereby extending prior research in three ways: First, we model the effects of both neighborhood disadvantage and racial segregation on BMI trajectories. Neighborhood socioeconomic disadvantage and racial context provide useful proxies that capture many of the poor conditions of these neighborhoods noted earlier in the paper. Second, we examine how neighborhood disadvantage and racial segregation may explain Black-White disparities in women’s BMI trajectories. Third, we use a nationally-representative, longitudinal study to model BMI trajectories over a period of 16 years. Our hypotheses are:
Living in neighborhoods with higher levels of neighborhood disadvantage and racial residential segregation will be associated with higher body mass (cross-sectional results at baseline, or time 1);
Living in neighborhoods with higher levels of neighborhood disadvantage and racial residential segregation will be associated with increases in body mass over 16 years for both Black and White women (longitudinal results);
Racial disparities in body mass will be partly explained by neighborhood disadvantage and racial residential segregation (cross-sectional results); and
Growth in racial disparities in body mass over 16 years will be partly explained by neighborhood disadvantage and racial residential segregation (longitudinal results).
METHODS
Sample
Individual-level data were drawn from four waves of the ACL panel survey (1986, 1989, 1994, and 2002). The first wave of the ACL was a multistage, stratified area probability sample of the non-institutionalized population age 24 years or older in 1986, including an over-sample of Blacks and older adults, living in the coterminous United States (n=3,617) and consisted of home administered face to face surveys (House, 1989). The response rates were 68 percent, 83 percent, 83 percent, and 74 percent respectively for each wave, among the surviving respondents. This study limited analyses to women (n=2,259), as a prior study using ACL data found no significant BMI differences between Black and White men (Robert and Reither, 2004). Sixty-five individuals who report their race as neither Black nor White were excluded. Selection bias is often a problem with panel data as respondents are differentially likely to exit a study. In order to reduce selection bias, we dropped women over age 70 at baseline because this age group was least likely to survive the span of the study (n=492 dropped). Another 215 observations of BMI were missing at waves 2, 3 or 4, and thus were dropped from the analysis. Black women were more likely to attrite than White women. Results in Table 1 show, however, that the analysis sample has a slightly higher average BMI for both Black and White women compared to the full wave 1 sample. Thus, it does not appear that attrition is related to BMI differentially for Black and White women. The sample consists of 1,487 Black or White female respondents across the U.S. across four time periods (or 5,145 person-periods). Sampling weights were used to adjust for the complex sampling design and attrition across waves (Winship and Radbill, 1994).
Table 1.
Descriptive Statistics of Sample Restricted to Complete Cases by Wave and Full Wave 1 Sample: means and (Std. Dev.)
| Analysis Dataset: Complete across Waves | Wave 1 Sample | |||||||||
|---|---|---|---|---|---|---|---|---|---|---|
| Black | White | Black | White | |||||||
| 1986 | 1989 | 1994 | 2002 | 1986 | 1989 | 1994 | 2002 | 1986 | 1986 | |
| N= | 533 | 481 | 426 | 287 | 954 | 898 | 854 | 712 | 778 | 1481 |
| BMI | 27.69 | 28.17 | 29.03 | 30.41 | 24.81 | 25.30 | 25.94 | 26.94 | 27.52 | 24.78 |
| Range 14.41–54.68 | (3.45) | (3.59) | (3.54) | (3.91) | (5.76) | (5.93) | (6.18) | (6.69) | (3.11) | (5.21) |
| Proportion Age 24–30 | 0.20 | – | – | – | 0.19 | – | – | – | 0.18 | 0.16 |
| (0.24) | (0.46) | (0.21) | (0.40) | |||||||
| Proportion Age 31–40 | 0.30 | – | – | – | 0.28 | – | – | – | 0.27 | 0.25 |
| (0.27) | (0.53) | (0.24) | (0.46) | |||||||
| Education | 11.74 | – | – | – | 12.72 | – | – | – | 11.28 | 12.31 |
| Range 0–17 | (1.75) | (3.09) | (1.81) | (3.13) | ||||||
| Number of Children | 2.99 | – | – | – | 2.40 | – | – | – | 2.89 | 2.36 |
| Range 0–7 | (1.21) | (1.94) | (1.13) | (1.80) | ||||||
| Prior Smoker | 0.25 | – | – | – | 0.28 | – | – | – | 0.17 | 0.21 |
| Range 0–1 | (0.26) | (0.52) | (0.21) | (0.44) | ||||||
| Had Baby last year | 0.06 | 0.06 | 0.03 | 0.01 | 0.07 | 0.06 | 0.02 | 0.02 | 0.05 | 0.06 |
| Range 0–1 | (0.14) | (0.14) | (0.10) | (0.07) | (0.30) | (0.27) | (0.15) | (0.17) | (0.12) | (0.26) |
| Married | 0.48 | 0.45 | 0.45 | 0.37 | 0.72 | 0.71 | 0.71 | 0.66 | 0.44 | 0.66 |
| Range 0–1 | (0.29) | (0.29) | (0.30) | (0.29) | (0.52) | (0.53) | (0.54) | (0.57) | (0.27) | (0.50) |
| Log Family Income | 9.46 | 9.54 | 9.86 | 10.17 | 10.11 | 10.26 | 10.42 | 10.69 | 9.33 | 9.92 |
| (0.60) | (0.61) | (0.58) | (0.54) | (1.01) | (1.03) | (0.96) | (1.03) | (0.57) | (1.00) | |
| Family Income | 19,939 | 22,070 | 29,039 | 37,290 | 33,513 | 39,072 | 43,817 | 65,366 | 18,260 | 29,382 |
| Range 2500–1,500,00 | (10,301) | (11,677) | (15,036) | (18,388) | (29,211) | (33,455) | (33,577) | (141,852) | (9,225) | (25,766) |
| Have 10K + Assets | 0.22 | 0.30 | 0.50 | 0.66 | 0.53 | 0.55 | 0.70 | 0.83 | 0.22 | 0.49 |
| (0.25) | (0.27) | (0.30) | (0.29) | (0.58) | (0.58) | (0.54) | (0.46) | (0.22) | (0.53) | |
| Physical Activity | −0.29 | −0.53 | −0.10 | −0.12 | 0.07 | −0.10 | 0.04 | −0.06 | -.36 | −0.09 |
| Range −2 – 1.5 (more) | (0.60) | (0.59) | (0.61) | (0.53) | (1.11) | (1.04) | (1.11) | (1.09) | (0.56) | (1.09) |
| Smoke | 0.33 | 0.28 | 0.20 | 0.17 | 0.32 | 0.27 | 0.23 | 0.16 | 0.31 | 0.29 |
| Range 0–1 | (0.27) | (0.26) | (0.24) | (0.23) | (0.55) | (0.52) | (0.50) | (0.45) | (0.25) | (0.48) |
| Acute Stress | 0.89 | 1.06 | 1.24 | 1.50 | 0.90 | 0.81 | 1.11 | 1.39 | 0.88 | 0.90 |
| Range 0–6 (more) | (0.52) | (0.56) | (0.63) | (0.63) | (1.07) | (0.96) | (1.08) | (1.30) | (0.48) | (0.95) |
| Financial Strain | 0.44 | 0.41 | 0.23 | 0.07 | 0.04 | −0.07 | −0.06 | −0.26 | 0.42 | −0.01 |
| Range −1.8 – 2.7 (more) | (0.61) | (0.59) | (0.60) | (0.58) | (1.17) | (1.10) | (1.08) | (1.10) | (0.57) | (1.08) |
| Social Support | 0.07 | 0.09 | 0.31 | 0.31 | 0.24 | 0.24 | 0.39 | 0.34 | 0.09 | 0.22 |
| Range −3.7 – 1.3 (more) | (0.61) | (0.62) | (0.62) | (0.59) | (1.03) | (0.96) | (0.99) | (1.08) | (0.56) | (0.98) |
|
| ||||||||||
| 139 Tracts | 318 Tracts | 200 Tracts | 377 Tracts | |||||||
| Neigh. Disadvantage | 112.61 | – | – | – | 88.66 | – | – | – | 113.30 | 90.41 |
| Range 27–179 (more) | (25.66) | (22.61) | (26.22) | (23.07) | ||||||
| Percent Black | 59.22 | – | – | – | 7.02 | – | – | – | 56.82 | 8.96 |
| Range 0–100 | (31.94) | (15.23) | (32.21) | (17.60) | ||||||
Neighborhood-level data for each respondent were taken from the 1980 Census extract files (Adams, 1992). To create neighborhood-level variables, respondents’ residence at the time of the 1986 baseline survey was linked to the 1980 Census at the census tract or enumeration district level (if not tracted). Census tracts, on average, contain about 4,000 residents, but can range from 2,500 to 8,000 residents (US Bureau of the Census, 2000). We estimated the effects of wave 1 neighborhood racial and socioeconomic context on BMI trajectories over a 16 year period. Our sample consists of 509 census tracts with an average of 2.92 persons per census tract, with a range of 1 to 14 persons.
Variables
The dependent variable in our study was Quetelet body mass index (BMI), a continuous measure calculated by dividing self-reported weight in kilograms by self-reported height in meters squared.1 We focus on BMI, rather than on a dichotomous obese versus not obese variable2 because the continuous measure provides more nuanced information on people’s BMI changes over the 16 year period. Although we model continuous BMI, we also interpret some of our results by applying the CDC cut points for obesity and overweight.
We created 3 birth cohorts, age 24–30, age 31–40, and age 41–70 (reference category) at baseline. Preliminary analyses showed that BMI was related to aging and that this age categorization best modeled the aging process in this sample.
Race was measured as an indicator variable with Black, non-Hispanic=1 and White, non-Hispanic=0 (reference category). Educational attainment was measured at baseline as years spent in school. Number of children was measured at time one, and top-coded at seven. Number of children may have a cumulative effect on BMI. Some women in the sample may not have completed their child bearing, so we supplemented number of children with a time-varying dummy variable for having had a baby in the last year. Marital status was measured by a time-varying dummy variable with married =1 and not married =0. Family income was time-varying and consisted of the respondent’s and her spouse/partner’s income, and was log transformed to normalize it. Assets were measured as a time-varying dummy variable for having $10,000 in assets or more =1, or having less than $10,000 in assets =0.
Other risk and protective factors were all time-varying except for prior smoking status. We used 2 variables to measure smoking behavior. Smoking was measured as currently smoking =1 and not currently smoking =0 in each wave. To distinguish those who never smoked from prior but not current smokers at baseline, a non-time-varying indicator variable was created: those who have smoked in the past, but were not smoking at baseline =1 and those who have never smoked=0. Physical activity was a standardized scale created as the arithmetic mean of three items asking respondents about the frequency of working in the garden/yard, active sport or exercise participation, and taking walks (range −2 to 1.5). Acute stress was measured by an index ranging from 0–6 that summed the number of stressful negative life events experienced (e.g., widowhood, death of a child, divorce and assault). Financial strain was a standardized scale measured by the arithmetic mean of three items of income satisfaction and difficulty, and ranges from −1.8 to 2.7 (higher scores reflect more strain). Social support was a standardized scale consisting of the arithmetic mean of two items: support received from friends and relatives (range −3.7 to 1.3). Wherever possible (and substantively compelling), we included covariates in the models as time-varying because individual circumstances can change substantially over a 16 year period and these changes may contribute to BMI trajectories.
A neighborhood disadvantage scale was constructed as a sum of the percent of households receiving public assistance, percent adult unemployment, and percent of families with more than $30,000 in income (reverse coded). It ranged from 27, which was lowest neighborhood disadvantage, to 179, the highest level of disadvantage. This particular measure of neighborhood disadvantage has been shown to work well with obesity in cross-sectional analyses (Robert and Reither, 2004). Racial composition was measured as percent Black living in the respondent’s census tract, ranging from zero to 100 percent. Traditional measures of segregation have been designed for use with urban areas. Since we are examining a nationally representative sample that comes from nonurban areas and urban areas, racial composition is a useful proxy measure of racial segregation. Percent Black was used to represent the relative racial residential segregation of respondents’ neighborhoods, theorized as a mechanism by which racial groups are differentially exposed to material and psychosocial resources, challenges, and opportunities (Mason et al., 2009). The correlation between neighborhood disadvantage and percent Black is .61, which while quite high is not a threat to collinearity. All continuous variables were centered on their grand means to facilitate model interpretation and reduce potential collinearity.
Statistical Analysis
We model neighborhood effects and racial disparities in BMI trajectories over four time points. A two-level hierarchical model was estimated (4 time points nested within individuals), treating the neighborhood-level variables as characteristics of individuals. That is, we modeled growth curve trajectories of individual BMI over time, with all persons living in the same census tract sharing the same values on neighborhood disadvantage and percent Black.
Hierarchical models have the advantage of properly estimating autocorrelated errors, partitioning BMI variance into its within- and between-person components, modeling individual change in BMI, and testing whether there is significant variation across persons in average BMI growth (Bryk and Raudenbush, 1992). Coefficients were estimated based on all available information across ACL waves; thus, if a person provided data for only three time points, that person and those data were included in the analysis.
Time was measured as 0 for 1986 to establish our baseline; subsequent waves were measured as deviations in years from baseline. Thus, the 1989 wave was captured by time=3, the 1994 wave was captured by time=8, and the 2002 wave was captured by time=16. Time represents the average growth in BMI as individuals age, while cohort captures inter-cohort differences in BMI growth.
Two random effects were modeled, allowing for a random intercept (baseline or time 1 BMI) and a random slope (growth in BMI) at each time point, using SAS v9.1 proc mixed procedure. Except where mentioned previously (e.g. neighborhood disadvantage and racial composition), all predictors were entered into the models as time-varying variables. We assessed the covariance structure of BMI and tested several covariance structures in our models. We ultimately modeled the covariance structure as unstructured, as baseline BMI and growth in BMI over time are correlated; this structure provides us with random effects for the intercept (baseline), slope (time), and the interaction between the intercept and slope. Sensitivity analyses were run in order to determine the robustness of our findings. We ran models stratified by initial BMI status to determine if the trajectories might vary by initial BMI status. Our findings were robust to this, as the trajectories were similar across the entire distribution compared to the models stratified by initial BMI status.
Our next step was to estimate the BMI trajectory starting with a linear model, a quadratic model, and a quadratic model with birth cohort dummies. The best fitting model (model 1) included a linear time effect and dummy variables for cohorts 24–30 and 31–40 with cohort 40–70 at baseline used as the reference category.3 growth in BMI over the life course was controlled for in all the models prior to introducing predictors and controls into the models.
RESULTS
Table 1 presents weighted point estimates of BMI separately for Black and White women at all four waves. The first eight columns present complete cases (cases with missing data were dropped) within each wave for Black and White women. The last two columns include complete wave 1 information (all cases were included in wave 1) as a comparison to examine for possible selection bias in our analysis data. Between 1986 and 2002, Black women’s average BMI increased from 27.69 to 30.41, while White women’s average BMI increased from 24.81 to 26.94 in the analysis dataset. On average, Black women were overweight in 1986 and obese by 2002. White women, on average, were of normal weight in 1986 and overweight by 2002.
There were no significant differences between Black and White women in terms of prior smoking status, current smoking, or acute stress (Table 1). However, White and Black women were significantly different in terms of certain demographic, socioeconomic and health-related variables. For instance, Black women exhibited more financial strain than White women at all time points. Black women, on average, were also less physically active, and received less social support than White women across all four waves. The analysis dataset and the complete wave 1 sample did not differ greatly on any of these measures. Black women, on average, lived in neighborhoods with greater disadvantage (112.6 on a scale ranging from 27 to 179) and neighborhood percent Black (59.2) compared to White women (88.7 and 7.0 respectively).
Table 2 presents four nested models estimating continuous BMI. Fixed effects are presented in the top portion of the table; random effects are presented next, followed by model fit statistics. Model 1 presents racial disparities in baseline BMI (coefficient for Black) and over time (Black*time) controlling for cohort. This model does not test any of our hypotheses, but it does inform us of both baseline differences in BMI as well as differences in BMI growth over time. On average, Black women’s baseline BMI score was 2.91 units higher than White women’s BMI score (p < 0.001). The statistically significant coefficient for time demonstrates that average BMI increased by .10 with each passing year for White women. The BMI trajectory disparity between Black and White women was also positive and significant, such that over time, Black women had a rate of increase in BMI that was greater than that of Whites (b = 0.052; p < 0.05). Thus, average Black-White difference in BMI among women over the study period is: 2.91 (1986), 3.07 (1989), 3.33 (1994) and 3.74 (2001/2).
Table 2.
Estimating BMI Trajectories Using Two Level Hierarchical Models
| Level 2 N=1,487 | Model 1 | Model 2 | Model 3 | Model 4 |
|---|---|---|---|---|
| Intercept | 25.675*** | 25.815*** | 24.712*** | 24.885*** |
| (0.19) | (0.23) | (0.34) | (0.38) | |
| Black | 2.909*** | 2.564*** | 2.349*** | 2.305*** |
| (0.30) | (0.49) | (0.49) | (0.49) | |
| Time | 0.099*** | 0.080*** | 0.135*** | 0.127** |
| (0.01) | (0.01) | (0.02) | (0.02) | |
| Black*Time | 0.052* | 0.107*** | 0.118* | 0.111** |
| (0.02) | (0.03) | (0.03) | (0.03) | |
| Age 24–30 | −2.433*** | −2.533*** | −2.053*** | −1.779*** |
| (0.39) | (0.39) | (0.41) | (0.41) | |
| Age 31–40 | −0.902** | −0.931** | −0.561+ | −0.363 |
| (0.33) | (0.33) | (0.34) | (0.33) | |
| Neigh. Disadvantage | 0.031*** | 0.017* | 0.017* | |
| (0.01) | (0.01) | (0.01) | ||
| Disadvantage*Time | −0.000 | 0.001 | 0.001+ | |
| (0.00) | (0.00) | (0.00) | ||
| Neighborhood % Black | −0.009 | −0.004 | −0.004 | |
| (0.01) | (0.01) | (0.01) | ||
| Neigh. % Black*Time | −0.001* | −0.001* | −0.001* | |
| (0.000) | (0.00) | (0.00) | ||
| Education | −0.189*** | −0.182*** | ||
| (0.05) | (0.05) | |||
| Married | 0.642** | 0.658** | ||
| (0.12) | (0.13) | |||
| Number of Children | 0.181* | 0.188* | ||
| (0.08) | (0.08) | |||
| Had a Baby Last Year | −0.146 | −0.071 | ||
| (0.22) | (0.21) | |||
| Logged Family Income | −0.355*** | −0.473*** | ||
| (0.08) | (0.08) | |||
| Have at least $10k in Assets | 0.254* | 0.193* | ||
| (0.12) | (0.12) | |||
| Number of Children*Time | −0.007 | −0.008+ | ||
| (0.01) | (0.08) | |||
| Had a Baby Last Year*Time | 0.082 | 0.074 | ||
| (0.05) | (0.05) | |||
| Logged Income*Time | 0.056*** | 0.069*** | ||
| (0.01) | (0.01) | |||
| $10k Assets*Time | −0.073*** | −0.061** | ||
| (0.02) | (0.02) | |||
| Currently Smoke | 0.196*** | |||
| (0.04) | ||||
| Prior Smoker | 0.154 | |||
| (0.30) | ||||
| Physical Activity | −0.273*** | |||
| (0.06) | ||||
| Social Support | 0.043 | |||
| (0.05) | ||||
| Financial Strain | −0.283*** | |||
| (0.06) | ||||
| Acute Stress | −0.028 | |||
| (0.05) | ||||
| Smoke*Time | 0.010* | |||
| (0.00) | ||||
| Physical Activity*Time | 0.018* | |||
| (0.00) | ||||
| Financial Strain*Time | 0.045*** | |||
| (0.01) | ||||
| Acute Stress*Time | 0.008 | |||
| (0.01) | ||||
| Random Effects | ||||
|
| ||||
| Intercept | 25.237*** | 24.744*** | 24.204*** | 23.912*** |
| (1.06) | (1.04) | (1.02) | (1.01) | |
| Intercept by Time | −0.151** | −0.144** | −0.122** | −0.135** |
| (0.05) | (0.04) | (0.04) | (0.04) | |
| Time | 0.045*** | 0.045*** | 0.042*** | 0.041*** |
| (0.00) | (0.00) | (0.00) | (0.00) | |
| Residual | 2.979*** | 2.978*** | 2.934*** | 2.871*** |
| (0.08) | (0.08) | (0.08) | (0.08) | |
| Model Fit Statistics | ||||
|
| ||||
| −2LogL | 27656.4 | 27627.7 | 27514.6 | 27402.7 |
| AIC | 27676.4 | 27655.7 | 27562.6 | 27470.7 |
| BIC | 27729.4 | 27730.0 | 27689.9 | 27651.1 |
Note: Raw Coefficients and (Standard Errors.)
p<.001
p<.01
p<.05
p<.10
Model 2 added the neighborhood variables to the baseline model to test our four hypotheses before adding additional controls (unconditioned). Hypothesis 1 stated that living in disadvantaged neighborhoods and neighborhoods with a high percentage of Blacks will be associated with higher baseline BMI. Hypothesis 2 stated that that living in disadvantaged neighborhoods and neighborhoods with a high percentage of Blacks will be associated with increased growth in BMI. The results demonstrate that baseline neighborhood disadvantage (b = .031; p < 0.001), but not percent Black, was associated with higher BMI at baseline, thus partially supporting hypothesis 1. Results do not support hypothesis 2; neighborhood disadvantage is not significantly associated with growth in BMI (b=−.009), and as neighborhood percent Black increases by 1%, average BMI actually declines by −.001 (p < 0.05) per year.
Hypothesis 3 stated that the neighborhood effects will attenuate baseline racial disparities in BMI, and hypothesis 4 stated that they will attenuate racial disparities in BMI growth over time. We found that including neighborhood variables reduced the racial disparity in baseline BMI by .35 (from 2.91 to 2.56), which supports hypothesis 3. Interestingly, after including neighborhood contextual variables, the racial disparity in BMI trajectories increased in magnitude, which is the opposite of what we expected; thus we reject hypothesis 4.
Not including neighborhood racial context in Model 1 confounded individual-level racial BMI trajectories with the effect of neighborhood-level racial context. The coefficient for Black*time increased from .05 in Model 1 to .11 in Model 2, while the trajectory for White women decreased from .10 in Model 1 to .08 in Model 2. In Model 2, White women’s BMI increased by an average of .08 for every passing year, while Black women’s BMI increased by an average of .19, which is more than twice as fast. Based on model 2, average Black-White difference in BMI over the study period is: 2.56 (1986), 2.89 (1989), 3.42 (1994) and 4.28 (2001/2).
Model 3 added controls for individual-level SES and family characteristics. Hypothesis 1 continues to be partially supported as neighborhood disadvantage continues to be directly and significantly associated with baseline BMI (b = .017, p ≤ .05), though the effect is somewhat attenuated. Neighborhood percent Black is still not associated with baseline BMI. Neighborhood disadvantage is still not associated with growth in BMI over time, and percent Black continues to be inversely associated with growth in BMI (b=−.001, p < .001), so we continue to reject hypothesis 2. Controlling for individual-level SES, family characteristics, and neighborhood characteristics caused an increase in Black-White BMI trajectory disparities; thus we continue to reject hypothesis 4. For every year that passed, White women’s average BMI increased by .14, while Black women’s average BMI increased by .25. Thus, based on Model 3, the average Black-White difference in BMI over the study period is: 2.35 (1986), 2.70 (1989), 3.29 (1994) and 4.24 (2001/2).
Model 4 adds controls for known risk and protective factors for BMI; very little changes upon introducing these variables. Hypotheses 1 and 3 continue to be supported and hypotheses 2 and 4 continue to be rejected. Neighborhood disadvantage continues to be associated with baseline BMI, and neighborhood percent Black continues to be inversely associated with growth in BMI, even adjusting for a range of known risk and protective factors. Adjusting for intervening risk and protective factors, White women’s average BMI grew by .13 per year and Black women’s average BMI grew by .24 per year. Even after controlling for individual- and neighborhood-level risk and protective factors over 16 years, average Black-White difference in women’s BMI continues to increase over time but at a reduced rate due to controlling for risk and protective factors over the study period; these differences are: 2.31 (1986), 2.64 (1989), 3.19 (1994) and 4.08 (2001/2).
The random effects, which provide us with information on average deviation for each census tract from the overall mean, demonstrated that there was considerable heterogeneity both in baseline BMI and in BMI trajectories. That is, both within and between individuals over time, there remained a large amount of unexplained variation in BMI. This suggests that more work is needed to explain determinants of BMI and changes in BMI, both generally, and within and between racial groups.
Figure 1 summarizes Model 4 findings in graphic form for easier interpretation, with separate trajectories for Black and White women and for each age cohort. Across all four waves, and for each of the three age cohorts, White women had lower BMI on average than Black women. Furthermore, the disparity between Black and White women’s average BMI increased slowly over time. For example, at baseline, the youngest cohort (age 24–30) of Black women had an average BMI that was about 2.3 units higher than White women’s and, by 2002, the difference was about 4.1 BMI units. Estimated average BMI for Black women in each age cohort in 1986 is over 25 units, which is defined as “overweight”. By 2002, the two oldest cohorts have average BMI scores that place them in the “obese” category. Only the oldest age cohort of White women had an average BMI score close to (but still under) 25 in 1986. By 2002, the two oldest cohorts of White women had average BMI scores that placed them in the overweight category.
Figure 1. Model 4 Growth in BMI Disparities over 16 Years between Black and White Women.
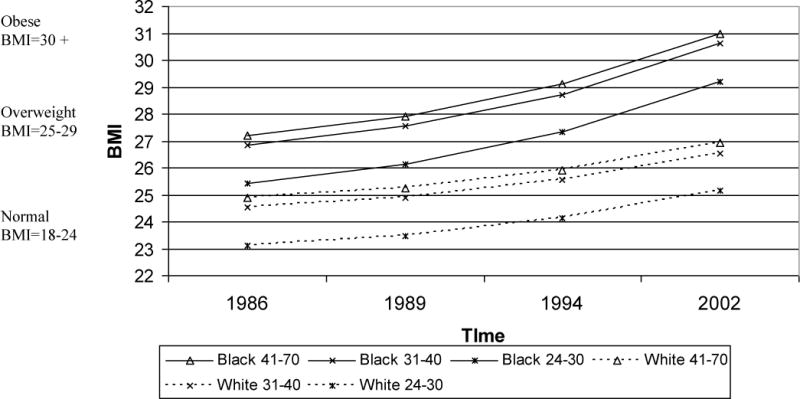
Note: Model 4 controls for the following variables: Black (and interacted with time), time, age, neighborhood disadvantage (and interacted with time),, percent Black, percent Black*time, education, Marital status, number of children (and interacted with time), had baby last year (and interacted with time), family income (and interacted with time), assets (and interacted with time), smoker status (and interacted with time), physical activity (and interacted with time), social support (and interacted with time), financial strain (and interacted with time), and acute stress (and interacted with time).
CONCLUSION
We investigated BMI trajectories over a 16 year period for Black and White women. Results showed that BMI increased over time for both Black and White women in all age groups. However, Black women not only had higher BMI at baseline, but their rate of increase in BMI over time was significantly greater than that for White women. Racial disparities in BMI actually grew between 1986 and 2002 between Black and White women. Our findings suggest that average BMI was in the overweight and obese ranges for Black women at all four time points, but remained in healthy ranges for younger White women. Among White women, only the oldest group had BMI estimates consistently in the overweight range.
The goal of our paper was to examine whether neighborhood characteristics are associated with BMI and BMI trajectories, and whether they help explain racial disparities in BMI and BMI trajectories among Black and White women. While some prior studies examined the role of neighborhood context in explaining racial disparities in BMI in national samples (Robert and Reither, 2004; Do et al., 2007), they were cross-sectional. Our longitudinal analyses demonstrate that neighborhood variables do account for a portion of racial disparities in BMI at baseline, but BMI nevertheless increased more quickly over time for Black women compared to White women.
We found that neighborhood disadvantage slightly attenuated racial disparities in BMI and BMI trajectories, but neighborhood racial composition did not. Indeed, the effect of neighborhood percent Black is the opposite of what we expected—living in a neighborhood with a greater concentration of Blacks was associated with reductions in BMI over time, controlling for neighborhood disadvantage. While we cannot state with absolute certainty what this means, we can speculate. Neighborhood disadvantage is associated with predominately Black neighborhoods that are heavily segregated (Massey and Eggers, 1990), which makes it difficult to disentangle race and SES at the neighborhood level. We include both neighborhood disadvantage and racial context in our models, thus our findings of neighborhood percent Black are adjusted for neighborhood disadvantage. That is, within each level of neighborhood disadvantage, as the percent Black increases, BMI decreases slightly. This suggests that for Black women, living around other Blacks (regardless of neighborhood disadvantage) may encourage lower BMI. Perhaps Black women living around Black people experience less stress and other negative psychosocial factors due to less racism in their home environment and their social, work, and neighborhood networks. Clearly this is an area that needs more research.
This research extends prior work by modeling change in BMI over a 16 year period, examining racial disparities in BMI trajectories, and including both individual and neighborhood risk and protective factors as potential mediators of the relationship between race and BMI. Despite the strengths of this study, there are limitations that need to be considered and addressed in future research. As with all longitudinal studies, sample attrition over time is a concern. Although the retained sample compares well to the full sample, and although we used weights to partially adjust for attrition, future work could attempt to account for or model this attrition in more detail. In addition, although dynamic changes in neighborhood context are related to health (Ruel and Robert, 2009), neighborhood context was examined only at baseline in this study. Moreover, neighborhood context was limited to socioeconomic and racial context. Future research could include other potentially-relevant neighborhood variables such as walkability, safety, and social norms.
In conclusion, our results reveal that racial disparities in BMI and BMI trajectories between Black and White women are substantial, even after controlling for neighborhood socioeconomic and racial context, individual socioeconomic factors, family context variables, and other risk and protective factors such as health behaviors, social support, and stress. Without a better understanding of the complex causation of racial disparities in obesity among women, and in light of the heterogeneity within each racial group and between individuals, it is difficult to determine which approach, or combination of approaches, will best help us address obesity and obesity disparities in the U.S.
Footnotes
Self reported weight has been found to have a downward bias (Cawley 2004), and self-reported height is less accurately reported as people age (Kuczmarski, et al., 2001). Thus, we used NHANES III and NHANES continuous data to make corrections to self-reported BMI. We regressed the exam-based BMI on self-reported BMI and self-reported BMI squared. We also regressed it on age and age squared, but these did not improve model fit and were dropped. We then re-analyzed the corrected BMI self-reports and found that the associations in our models did not change; thus, we present analyses based on the uncorrected BMI based on self-reports. For more information or to see the results on corrected BMI, please contact the author.
We also ran these analyses on a dichotomous obese versus not obese variable; the results in terms of associations with race, neighborhood disadvantage and neighborhood percent Black were very much the same. These results are available upon request.
We tried several robustness checks to make sure this was the best fitting model. We entered time into the model as three dummy variables, and then we examined interaction effects between neighborhood variables and the set of year dummies. These modifications did not change the results and did not improve the model fit. Thus, we chose the linear trend as the best fitting, most parsimonious model. The age categories used were based on earlier analyses of BMI trajectories rather than on theory. Persons age 40 and above show little difference in BMI growth, but differ significantly from those under age 40.
Contributor Information
Erin Ruel, Georgia State University.
Eric N. Reither, Utah State University
Stephanie A. Robert, University of Wisconsin-Madison
Paula M. Lantz, University of Michigan
References
- Acevedo-Garcia D, Lochner KA, Osypuk TL, Subramanian SV. Future directions in residential segregation and health research: A multilevel approach. American Journal of Public Health. 2003;93:215–222. doi: 10.2105/ajph.93.2.215. [DOI] [PMC free article] [PubMed] [Google Scholar]
- Adams TK. Census of population and housing, 1980 (United States): Extract data. Ann Arbor, MI: Economic Behavior Program, Survey Research Center, University of Michigan; 1992. distributed by ICPSR, Ann Arbor, MI. [Google Scholar]
- Bryk AS, Raudenbush SW. Hierarchical Linear Models. Newbury Park: Sage Publications; 1992. [Google Scholar]
- Cawley J. The impact of obesity on wages. The Journal of Human Resources. 2004;39:451–474. [Google Scholar]
- Chang VW. Racial Residential Segregation and Weight Status among U.S. Adults. Social Science & Medicine. 2006;63(5):1289–1303. doi: 10.1016/j.socscimed.2006.03.049. [DOI] [PubMed] [Google Scholar]
- Collins CA, Williams DR. Segregation and mortality: The deadly effects of racism? Sociological Forum. 1999;14:495–533. [Google Scholar]
- Do DP, Dubowitz T, Bird CE, Lurie N, Escarce JJ, Finch BK. Neighborhood context and ethnicity differences in body mass index: A multilevel analysis using the NHANES III survey (1988–1994) 2007 doi: 10.1016/j.ehb.2007.03.006. [DOI] [PMC free article] [PubMed] [Google Scholar]
- Flegal KM, Carroll MD, Ogden CL, Johnson CL. Prevalence and trends in obesity among US adults, 1999–2000. Journal of the American Medical Association. 2002;288:1723–7. doi: 10.1001/jama.288.14.1723. [DOI] [PubMed] [Google Scholar]
- House JS. American’s changing lives: wave I. Ann Arbor, MI: Survey Research Center [producer]; Ann Arbor, MI: ICPSR [distributor]; 1989. [Google Scholar]
- Kling J, Liebman J, Katz L, Sanbonmatsu L. Moving to opportunity and tranquility: neighborhood effects on adult economic self-sufficiency and health from a randomized housing voucher experiment Report. NBER and Harvard University; Cambridge, MA: 2004. [Google Scholar]
- Kuczmarski MF, Kuczmarski RJ, Najjar M. Effects of age on validity of self-reported height, weight, and body mass index: Findings from the third National Health and Nutrition Examination Survey, 1988–1994. Journal of the American Dietetic Association. 2001;101:28–34. doi: 10.1016/S0002-8223(01)00008-6. [DOI] [PubMed] [Google Scholar]
- Kumanyika S. Obesity, health disparities, and prevention paradigms: hard questions and hard choices. Preventing Chronic Disease. 2005;2:A02. [PMC free article] [PubMed] [Google Scholar]
- LaVeist TA. Linking residential segregation to the infant mortality race disparity in U.S. cities. Sociology and Social Research. 1989;73:90–94. [Google Scholar]
- LaVeist TA. Segregation, poverty, and empowerment: Health consequences for African Americans. Milbank Quarterly. 1993;71:41–64. [PubMed] [Google Scholar]
- Logan JR, Alba RD, McNulty T, Fischer MJ. Making a place in the metropolis: locational attainment in cities and suburbs. Demography. 1996;33:443–453. [PubMed] [Google Scholar]
- Massey D, Eggers M. The ecology of inequality: minorities and the concentration of poverty, 1970–1980. The American Journal of Sociology. 1990;95:1153–1188. [Google Scholar]
- Mason SJ, Messer LC, Laraia BA, Mendola P. Segregation and preterm birth: The Effects of neighborhood racial composition in North Carolina. Health & Place. 2009;15:1–9. doi: 10.1016/j.healthplace.2008.01.007. [DOI] [PMC free article] [PubMed] [Google Scholar]
- Mokdad AH, Bowman BA, Ford ES, Vinicor F, Marks JS, Koplan JP. The continuing epidemics of obesity and diabetes n the United States. Journal of the American Medical Association. 2001;286:1195–200. doi: 10.1001/jama.286.10.1195. [DOI] [PubMed] [Google Scholar]
- Morland K, Wing S, Diez-Roux AV, Poole C. Neighborhood characteristics associated with the location of food stores and food service places. American Journal of Preventive Medicine. 2001;22:23–29. doi: 10.1016/s0749-3797(01)00403-2. [DOI] [PubMed] [Google Scholar]
- Mujahid MS, Diez Roux AV, Borrell LN, Nieto FJ. Cross-sectional and longitudinal associations of BMI with socioeconomic characteristics. Obesity Research. 2005;13:1412–21. doi: 10.1038/oby.2005.171. [DOI] [PubMed] [Google Scholar]
- Mujahid MS, Diez Roux AV, Shen M, Gowda D, Sánchez B, Shea S, Jacobs DR, Jr, Jackson SA. Relation between neighborhood environments and obesity in the multi-ethnic study of atherosclerosis. American Journal of Epidemiology. 2008;167(11):1349–1357. doi: 10.1093/aje/kwn047. [DOI] [PubMed] [Google Scholar]
- Ogden CL, Carroll MD, Curtin LR, McDowell MA, Tabak CJ, Flegal KM. Prevalence of overweight and obesity in the United States, 1999–2004. Journal of the American Medical Association. 2006;295:1549–1555. doi: 10.1001/jama.295.13.1549. [DOI] [PubMed] [Google Scholar]
- Olshansky SJ, Passaro DJ, Hershow RC, Layden J, Carnes BA, Brody J, Hayflick L, Butler RN, Allison DB, Ludwig DS. A potential decline in life expectancy in the United States in the 21st century. New England Journal of Medicine. 2005;352(11):1138–1145. doi: 10.1056/NEJMsr043743. [DOI] [PubMed] [Google Scholar]
- Pappas G, Queen S, Hadden W, Fisher G. The increasing disparity in mortality between socioeconomic groups in the United States, 1960 and 1986. New England Journal of Medicine. 1993;329:103–109. doi: 10.1056/NEJM199307083290207. [DOI] [PubMed] [Google Scholar]
- Polednak AP. Poverty, residential segregation and Black/White mortality ratios in urban areas. Journal of Health Care for the Poor and Underserved. 1993;4:363–373. doi: 10.1353/hpu.2010.0094. [DOI] [PubMed] [Google Scholar]
- Polednak AP. Trends in U.S. urban Black infant mortality, by degree of residential segregation. American Journal of Public Health. 1996;86:723–726. doi: 10.2105/ajph.86.5.723. [DOI] [PMC free article] [PubMed] [Google Scholar]
- Reidpath DD, Burns C, Garrard J, Mahoney M, Townsend M. An ecological study of the relationship between social and environmental determinants of obesity. Health & Place. 2002;8:141–145. doi: 10.1016/s1353-8292(01)00028-4. [DOI] [PubMed] [Google Scholar]
- Reither EN, Peppard PE, Remington PL, Kindig DA. Increasing educational disparities in premature adult mortality, Wisconsin, 1990–2000. Wisconsin Medical Journal. 2006;105(7):38–41. [PubMed] [Google Scholar]
- Robert SA, Reither EN. A multilevel analysis of race, community disadvantage, and body mass index among adults in the US. Social Science & Medicine. 2004;59(12):2421–2434. doi: 10.1016/j.socscimed.2004.03.034. [DOI] [PubMed] [Google Scholar]
- Ruel E, Robert SA. A model of racial residential history and its association with self-rated health and mortality among Black and white adults in the U.S. Sociological Spectrum. 2009;29:443–466. doi: 10.1080/02732170902904616. [DOI] [PMC free article] [PubMed] [Google Scholar]
- Schulz AJ, Williams DR, Israel BA, Lempert LB. Racial and spatial relations as fundamental determinants of health in Detroit. Milbank Quarterly. 2002;80:677–707. doi: 10.1111/1468-0009.00028. [DOI] [PMC free article] [PubMed] [Google Scholar]
- Seo D, Torabi M. Racial/ethnic differences in body mass index, morbidity and attitudes toward obesity among U.S. adults. Journal of the National Medical Association. 2006;98(8):1300–1308. [PMC free article] [PubMed] [Google Scholar]
- Singh G, Siahpush M. Increasing inequalities in all-cause and cardiovascular mortality among US adults aged 25–64 years by area socioeconomic status, 1969–1998. International Journal of Epidemiology. 2002;31:600–613. doi: 10.1093/ije/31.3.600. [DOI] [PubMed] [Google Scholar]
- Steenland KHJTM. All-cause and cause-specific death rates by educational status for two million people in two American Cancer Society cohorts, 1959–1996. American Journal of Epidemiology. 2002;156:11–21. doi: 10.1093/aje/kwf001. [DOI] [PubMed] [Google Scholar]
- U.S., Bureau of the Census. Census 2000 geographic terms and concepts. Washington DC: U.S. Department of Commerce; 2000. [Google Scholar]
- U.S. Department of Health and Human Services. Healthy People 2010: Understanding and Improving Health. 2nd. Washington DC: US Government Printing Office; 2000. [Google Scholar]
- Wang Y, Beydoun MA. The obesity epidemic in the United States: gender, age, socioeconomic, racial/ethnic, and geographic characteristics: a systematic review and meta-regression analysis. Epidemiology Review. 2007;29:6–28. doi: 10.1093/epirev/mxm007. [DOI] [PubMed] [Google Scholar]
- Williams D, Collins C. Racial residential segregation: a fundamental cause of racial disparities in health. Public Health Reports. 2001;116:404–416. doi: 10.1093/phr/116.5.404. [DOI] [PMC free article] [PubMed] [Google Scholar]
- Winship C, Radbill L. Sampling weights and regression analysis. Sociological Methods & Research. 1994;23:230–257. [Google Scholar]
- Yen IH, Kaplan GA. Poverty area residence and changes in physical activity level: Evidence from the Alameda county study. American Journal of Public Health. 1998;88:1709–1712. doi: 10.2105/ajph.88.11.1709. [DOI] [PMC free article] [PubMed] [Google Scholar]