

Abstract
Reuptake of neurotransmitters from the brain interstitium shapes chemical signaling processes and is disrupted in several pathologies. Serotonin reuptake in particular is important for mood regulation and is inhibited by first-line drugs for treatment of depression. Here we introduce a molecular-level fMRI technique for micron-scale mapping of serotonin transport in live animals. Intracranial injection of an MRI-detectable serotonin sensor complexed with serotonin, together with serial imaging and compartmental analysis, permits neurotransmitter transport to be quantified as serotonin dissociates from the probe. Application of this strategy to much of the striatum and surrounding areas reveals widespread non-saturating serotonin removal with maximal rates in lateral septum. The serotonin reuptake inhibitor fluoxetine selectively suppresses serotonin removal in septal subregions, whereas both fluoxetine and a dopamine transporter blocker depress reuptake in striatum. These results highlight promiscuous pharmacological influences on the serotonergic system and demonstrate utility of molecular fMRI for characterization of neurochemical dynamics.
INTRODUCTION
Mechanisms of neurotransmitter transport within and around synapses govern the temporal characteristics and intensity of neural transmission (Amara and Kuhar, 1993; Kanner and Zomot, 2008; Masson et al., 1999). For several neurotransmitters, cellular reuptake following activity-dependent release is one of the most important determinants of signaling dynamics. Modulation of neurotransmitter reuptake therefore contributes to tuning neural network activity across the central nervous system (Castrén, 2005). Potent addictive drugs such as cocaine act by inhibiting neurotransmitter reuptake transporters (Sulzer, 2011), and artificial manipulation of reuptake also provides a therapeutic strategy for the management of several psychiatric and neurological diseases (Iversen, 2000; Jensen et al., 2015). A particularly well-known example is the use of selective serotonin reuptake inhibitors (SSRIs) in the treatment of depression (Vaswani et al., 2003; Wong and Licinio, 2001). SSRIs competitively inhibit the serotonin transporter (SERT) and exert widespread effects ranging from reduction of pain and stress (Gorman and Kent, 1999) to induction of neurogenesis, plasticity, and learning (Chamberlain et al., 2006; Chen et al., 2011; Santarelli et al., 2003).
Experimental analysis of neurotransmitter kinetics in vivo is critical to understanding how these processes influence neural function on a regional or global level. Efforts to characterize neurotransmitter reuptake and redistribution patterns could also facilitate better understanding of neuropharmacological therapies (Kirsch et al., 2008; Kirsch et al., 2002), and might inform the development of improved treatments. Real-time measurements of serotonin (5HT), dopamine, and norepinephrine clearance in laboratory animals have been performed using chronamperometry and voltammetry (Bucher and Wightman, 2015), revealing some regional differences in uptake parameters and susceptibility to pharmacological perturbations (Callaghan et al., 2005; Park et al., 2010; Shu et al., 2014). Because these measurements sample only discrete points in the brain however, they are ill suited to large-scale mapping of kinetic parameters. Radioligand imaging techniques such as positron emission tomography (PET) do provide spatially comprehensive information about tracer distribution, and have been used to measure SERT in vivo (Huang et al., 2010). With competition-based strategies, slowly varying neurotransmitter concentrations can sometimes be estimated (Laruelle, 2000; Paterson et al., 2013), but neurotransmitter transport rates based on these approaches have not been reported.
We previously introduced a family of imaging agents that enables mapping of extracellular neurotransmitter release using molecular-level functional magnetic resonance imaging (fMRI) (Brustad et al., 2012; Lee et al., 2014; Shapiro et al., 2010). The imaging probes are paramagnetic proteins that brighten T1-weighted images in the absence but not the presence of bound monoamines, providing a means for quantifying concentrations of these neurotransmitters. Although the sensors must be invasively injected into the brain, their application in conjunction with MRI in animals permits molecular measurements over relatively large fields of view, with voxel volumes on the order of 0.1 μL and temporal resolution of seconds (Lee et al., 2014). For sensitivity reasons, our earlier in vivo studies were performed in the presence of neurotransmitter reuptake blockers, meaning that native monoamine reuptake rates could not be reliably inferred from the imaging measurements. We speculated however that a different experimental strategy based on co-infusion of a sensor and its analyte could enable measurements of reuptake even for neurotransmitters like serotonin that rarely reach concentrations detectable by previous methods.
Here we put this idea to the test using a monoamine sensor called BM3h-2G9C6 (2G9C6), which displays a 0.7 μM dissociation constant for serotonin with more than 200-fold specificity compared with dopamine and norepinephrine (Brustad et al., 2012). We demonstrate that molecular imaging with this probe, in conjunction with compartmental modeling, enables three dimensional mapping of serotonin transport in rat brains by fMRI. The method provides spatially resolved estimates of serotonin removal rates and their perturbation by monoamine transporter blockers, constituting a potentially powerful tool for in vivo analysis of neurochemistry and drug mechanisms.
RESULTS
An MRI sensor enables in vivo measurement of serotonin dynamics
The MRI sensor 2G9C6 is an engineered mutant of the 53 kD bacterial cytochrome heme domain P450-BM3h. The sensor’s potency as an MRI contrast agent is expressed by its T1 relaxivity (r1). The 2G9C6 r1 at 37 °C and 9.4 T undergoes a five-fold reduction upon serotonin (5HT) binding in vitro, dropping from 0.99 mM−1 s−1 to 0.19 mM−1 s−1 with addition of saturating 5HT (Figure S1A). A straightforward approach to imaging 5HT transport in vivo could be based on analysis of MRI signal following co-injection of the sensor with exogenous 5HT in rats, a strategy that parallels earlier point measurement studies with electrochemistry (Daws et al., 1997). Our prediction was that gradual removal of 5HT bound to the sensor during and after infusion would increase the sensor’s mean relaxivity and produce a spatial profile of time dependent T1-weighted MRI signal increases that depend on diffusion, convection, and localized reuptake in the brain; these parameters could then be quantified using kinetic modeling approaches. Monitoring transport using the sensor-5HT co-injection procedure optimizes sensitivity to 5HT reuptake vs. release and enables the full dynamic range of the sensor to be exploited, while also resulting in continuously buffered 5HT concentrations within physiologically relevant, low micromolar levels.
To test our approach, we began by injecting 500 μM 2G9C6 either with or without equimolar 5HT, via paired cannulae implanted into the striatum of anesthetized rats (Figure 1A). The 2G9C6-5HT co-infusion condition is predicted to yield maximal free 5HT concentrations of 18 μM in the infusion cannula, as determined by the Kd of the sensor for 5HT. Infusions were performed over a 60 minute period at a rate of 0.1 μL/min. MRI images were acquired continuously with 16 s per frame and in-plane resolution of 200 μm over six coronal 1 mm slices near the infusion cannula locations, both while the infusion was in progress, and for a subsequent interval of 60 minutes. The injections themselves resulted in significant contrast enhancements over an approximately 3 mm diameter area (Figure 1B) that included regions of the caudate putamen (CPu), nucleus accumbens (Acb), lateral globus pallidus (LGP), lateral septum (LS), and the bed nucleus of the stria terminalis (BST). To further analyze these enhancements, we defined rectangular regions of interest (ROIs) around each infusion site and examined the magnitude of MRI signal changes in areas that received clearly discernable doses of contrast agent, defined as those voxels that showed greater than 2% signal increase during the injections, corresponding to at least roughly 1 μM 5HT-bound sensor or 0.2 μM unbound sensor. Among such voxels across five animals, an average image signal enhancement of 19.4 ± 4.6% was observed during infusion of 2G9C6 in the absence of 5HT, whereas a lesser enhancement of 10.5 ± 1.4% was observed during co-infusion of the MRI sensor with 5HT. If the infused 2G9C6-5HT complex remained intact, without dissociation or removal of 5HT, the five-fold lower r1 of 2G9C6-5HT with respect to ligand-free 2G9C6 would have given rise to an approximately five-fold lower signal change upon its injection. The fact that the 2G9C6-5HT signal change is only a factor of two lower therefore implies that close to 50% of the infused complex converts to the more MRI-visible 2G9C6, likely as a result of 5HT unbinding or removal during 2G9C6-5HT infusion.
Figure 1.
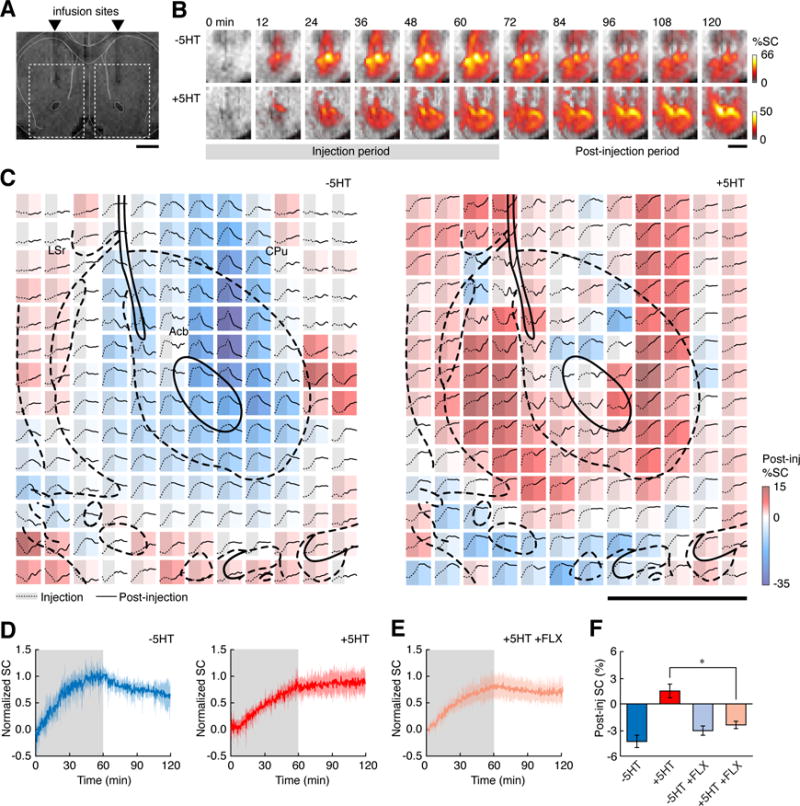
The MRI sensor 2G9C6 detects serotonin transport in rat brain. (A) 500 μM 2G9C6 is injected with or without equimolar serotonin (5HT) bilaterally into rat striatum, 1.2 mm rostral to bregma. Scale bar = 3 mm. (B) Representative image series obtained during (gray underline) and after injection of 2G9C6 without (top) and with (bottom) 5HT show percent signal change from pre-injection baseline (%SC, color scale) as a function of time (labels at top). Regions of interest (ROIs) shown correspond to dashed rectangles in panel (a), and grayscale underlays are anatomical MRI data. (C) Signal changes observed after injection of 2G9C6-5HT (left) or +5HT (right) in a representative experiment. Each colored square represents a single 200 μm × 200 μm voxel, color coded by the percent change in signal during the 60 minutes following infusion (Post-inj %SC, color bar at right). Each voxel’s time course is inset as a graph showing time points both during (left, gray shading, dotted line) and after injection (right, solid line). The color-coded values indicate systematic differences in the MRI signal dynamics observed following injection of 2G9C6 −5HT vs. +5HT. Scale bar = 1 mm; atlas overlay (thick black lines) indicates local brain regions. (D) ROI-averaged MRI signal changes observed during (shaded regions) and after infusion of 2G9C6 −5HT (left) or +5HT (right). Shading indicates s.e.m. (n = 5 animals). (E) ROI-averaged molecular fMRI time course following injection of 2G9C6 +5HT in animals pretreated with 5 mg/kg fluoxetine (FLX, n = 5). (F) Mean post-infusion signal changes observed following injection of 2G9C6 −5HT and +5HT in animals with or without FLX pretreatment.
During the post-infusion period, molecular fMRI time courses observed in the presence vs. absence of 5HT differed qualitatively. In the absence of co-injected 5HT, clear decreases in MRI signal were observed for most voxels near the cannula tip (Figure 1B top). In contrast, in the presence of co-injected 5HT, minimal signal decreases and in some cases MRI signal increases were observed following the injection period (Figure 1B bottom). These effects could be quantified at the level of single voxels (Figure 1C) and show that the extent of post-injection signal change varied systematically with position in both +5HT and −5HT infusion conditions. Similar findings were obtained in each individual experiment, and the data could be compared in the form of MRI signal changes averaged over animals in rectangular regions of interest (ROIs) defined as in Figure 1A. Results of this analysis (Figure 1D) indicated that the average signal change following injection of 2G9C6 without 5HT was a decrease of 4.3 ± 0.7%, whereas the change following co-infusion with 5HT was an increase of 1.5 ± 0.8%.
SERT inhibition alters molecular fMRI time courses
The molecular imaging time courses of Figure 1D were consistent with our prediction that 5HT reuptake would lead to MRI signal increases in the sensor-neurotransmitter co-injection approach, but we sought to establish the contribution of SERT activity more directly. To do so, we again performed the injection of 2G9C6 in the absence or presence of co-infused 5HT, but now in a separate group of five animals that were pretreated by systemic injection of the SSRI fluoxetine (FLX, 5 mg/kg). The average MRI time course from animals that received 2G9C6-5HT co-injection after FLX (Figure 1E) in fact displayed little or no evidence of 5HT unbinding from the sensor, as would be expected if SERT-catalyzed removal of 5HT was reduced. Voxel-level time courses obtained in the presence of FLX (Figure S1B) were also similar to those observed during and after 2G9C6 injection without 5HT (Figure 1C, left). Quantification of the post-injection MRI signal changes (Figure 1F) showed that an average signal decrease of 2.4 ± 0.4% was observed following co-injection of 2G9C6 in the presence of 5HT and FLX. This decrease was significantly different from the increase seen under comparable conditions in the absence of FLX (t-test p = 0.013), and was not significantly different from the percent signal decrease observed following injection 2G9C6 in the absence of 5HT (p = 0.8). These results confirm that neurotransmitter reuptake contributes importantly to the MRI signal observed in the period following injection of 2G9C6 with 5HT.
FLX dependence of the molecular fMRI time courses could be resolved in individual brain regions. We examined image signal dynamics in six anatomically defined ROIs corresponding to Acb, BST, CPu, LGP, and rostral and caudal subdivisions of LS (LSr and LSc, respectively; Figure 2A). MRI signals observed after infusion of 2G9C6-5HT in the presence or absence of FLX were compared for each ROI (Figure 2B). All regions except LSc showed substantially depressed MRI signal in the presence of FLX, consistent with inhibition of 5HT reuptake and its removal from the sensor. The largest responses to FLX were observed in Acb, CPu and LSr. These data suggest that SERT-dependent 5HT transport parameters vary spatially and can be measured by MRI. The time courses are difficult to interpret rigorously in terms of 5HT unbinding from 2G9C6, however, because they reflect combined influences of diffusion, convection, and 5HT clearance over the course of the experiments.
Figure 2.
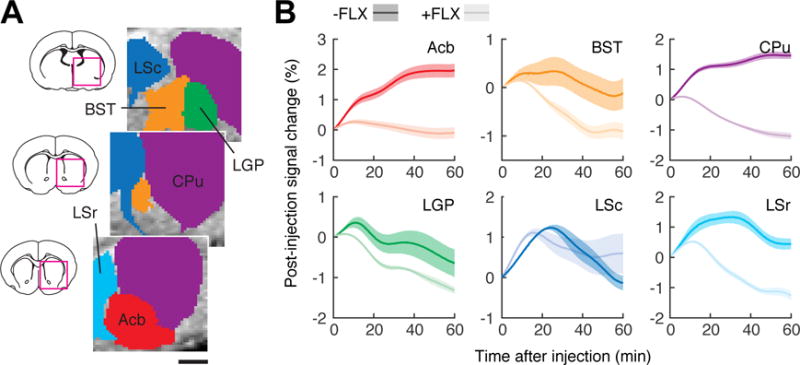
FLX-dependent MRI time courses in individual brain regions. (A) Definition of six anatomically-based ROIs (colored regions) corresponding to bed nucleus of the stria terminals (BST), caudate-putamen (CPu), lateral globus pallidus (LGP), lateral septum caudal part (LSr) and rostral part (LSc), and nucleus accumbens (Acb). Scale bar = 1 mm. Brain sections (left) show areas of detail (magenta squares) for ROIs centered at the rostrocaudal coordinates indicated in white. (B) Post-injection MRI signal time courses observed in the six ROIs, in animals that did not (dark colors) or did (light colors) receive FLX pretreatment. Shaded margins around each curve denote s.e.m. of six measurements each.
Compartmental modeling yields 5HT transport parameter estimates
In order to extract quantitative voxel-level 5HT transport parameters from the molecular fMRI data, we devised a simple compartmental modeling approach (Figure 3A). The model accounted for five microscopic processes: (1) infusion of 2G9C6-5HT complex at the cannula tips, modeled as a constant influx during the 60 min. injection period; (2) transformation from 2G9C6-5HT to unbound 2G9C6, modeled as a first order rate process with a rate constant of kU, describing net 5HT removal; (3) diffusion of bound or unbound sensor between adjacent voxels, modeled using a fixed diffusion rate matched to reported values in the literature (Syková and Nicholson, 2008; Tao and Nicholson, 1996); (4) convection of bound and unbound sensor through the brain during the infusion period, modeled using individual convection rates for transfer out of each voxel; and (5) trapping of both bound and unbound sensor, according to a single rate constant for each voxel. This last process was included because of our observation that MRI signal time courses did not return completely to their original baseline after injection (cf. Figure 1C), and by postmortem histological evidence (Figure S2) suggesting intracellular localization of some of the MRI probe—both of these phenomena were assumed to arise from endocytosis of the sensor.
Figure 3.
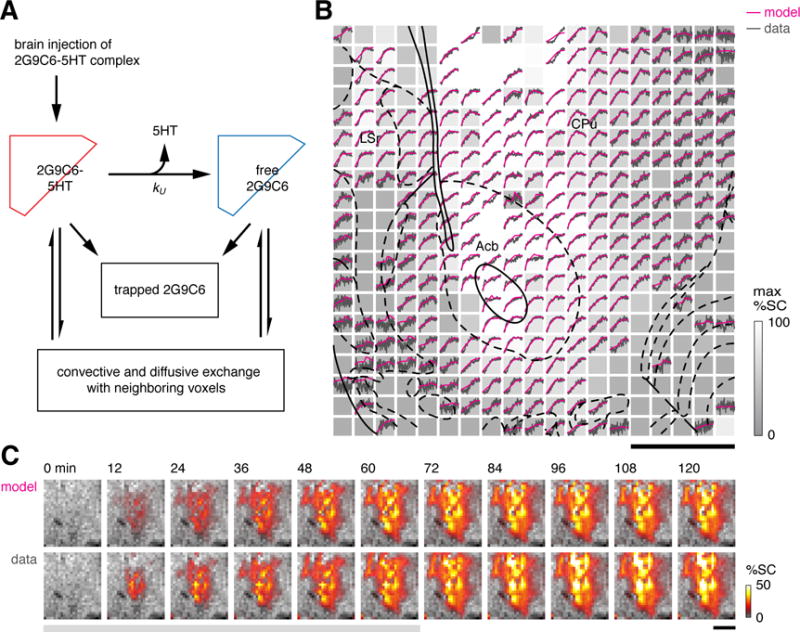
Compartmental modeling of molecular fMRI data. (A) Schematic showing the compartmental model for kinetic analysis of time courses from 2G9C6 injection experiments. Conversion of 2G9C6-5HT to uncomplexed 2G9C6 takes place with 5HT unbinding rate constant kU. 2G9C6-5HT and 2G9C6 were assumed to account for T1-weighted MRI signal changes according to their respective r1 values (see text for further details). (B) Representative results from model fitting. Data are represented as an array of voxels analogous to Figure 1C, with normalized experimental time courses inset in black. Each voxel is grayscale-coded according to its maximum observed signal change (max %SC, bar at right). Magenta traces show modeled time courses fit to the data. Voxels exhibiting sub-threshold signal change were excluded from the analysis. Scale bar = 1 mm; atlas overlay as in Figure 1C. (C) Comparison of modeled (top) and observed (bottom) ROI image series showing percent signal change (%SC, colorbar) during injection (gray underline) and post-injection time periods.
To keep the computations tractable, diffusion and convection of free 5HT were not explicitly modeled. Removal of 5HT from the brain interstitium is embodied in the conversion rate from 2G9C6-5HT to uncomplexed 2G9C6, without direct consideration of binding and unbinding of 5HT from the sensor. Omitting the kinetics of 5HT binding and unbinding from 2G9C6 was justified by stopped-flow measurements that revealed relatively short time constants for 5HT binding and unbinding from 2G9C6 (~40 s, Figure S3), compared with the much slower observed changes in 2G9C6-related MRI contrast within each voxel. At equimolar or excess sensor concentrations, 5HT levels would be restricted to low, buffered levels determined by the balance of 2G9C6-5HT and 2G9C6 in each voxel.
The modeling approach was able to simulate individual voxel MRI signal time courses with high accuracy (Figure 3B). R2 values averaged over voxels ranged from 0.85 to 0.95 for all animals; in each case, only voxels that showed minimal or negative signal change during contrast agent injection were excluded from the analysis. Comparison of observed and modeled image series also show excellent agreement (Figure 3C), with both gross temporal features and spatial details reproduced in the best-fit simulation. The analysis procedure was applied to data obtained both in the absence and presence of FLX. In both cases, fitted convection constants ranged from zero to 0.1 s−1. The spatial distribution of convection constants was approximately centrosymmetric and similar across animals, indicating reproducibility of the experimental and modeling approaches.
5HT removal varies spatially and suggests multiple clearance mechanisms
Maps of 5HT unbinding rates kU were obtained from the compartmental modeling procedure. Figure 4A displays kU values averaged across animals in both the −FLX and +FLX conditions (both n = 5). Data obtained in the absence of FLX show that substantial 5HT unbinding is apparent across much of the area for which data were obtained, and that particularly high 5HT removal is observed in a dorsomedial region including LS, BST, and parts of LGP and CPu. Values of kU are sharply reduced in animals pretreated with FLX, although some other areas appear less affected than others. Average 5HT unbinding rates were quantified in the six previously defined anatomical ROIs (Figure 4B). Consistent with the maps, mean kU values were highest for the LS regions, where the observed unbinding rates were significantly higher than in Acb, CPu, and LGP (p ≤ 0.037). All ROIs except BST showed significant reduction of average kU upon FLX treatment (p ≤ 0.049). Percent reduction in mean kU varied from 40 ± 16% for LSc to 74 ± 8% for Acb. Both ROI and voxel-level model fitting results therefore reveal significant but varying effects of FLX on 5HT removal kinetics.
Figure 4.
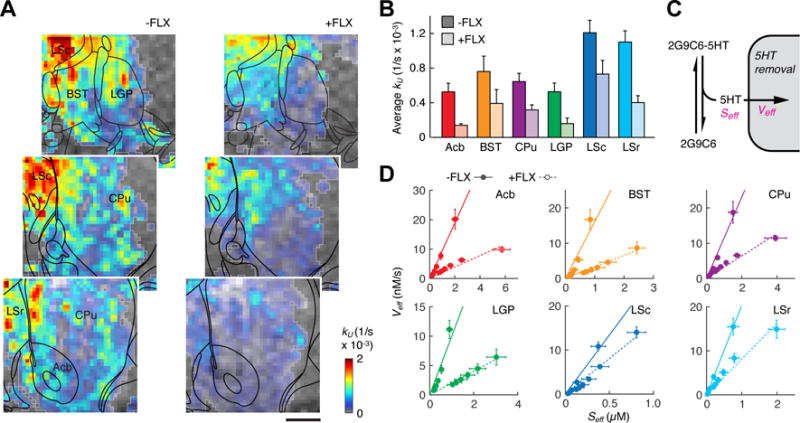
5HT transport parameters obtained from compartmental modeling. (A) Maps of 5HT unbinding rates (color-coded kU values, color scale bottom right) observed in the absence (left) and presence (right) of FLX pretreatment. Anatomical MRI data is shown as a grayscale underlay, and voxels included in the kinetic analysis are outlined in light gray (all n ≥ 2 animals). Coordinates with respect to bregma indicated in white, atlas overlays in black, and scale bar = 1 mm. (B) Average kU values observed in six anatomical ROIs in the absence (dark colors) or presence (light colors) of FLX pretreatment. All differences except BST were significant with p < 0.049. (C) Schematic illustrating definition of Seff as the estimated 5HT concentration arising from fast equilibrium between 2G9C6-5HT and 2G9C6, and definition of Veff as the total rate of 5HT removal from its equilibrium with 2G9C6. (D) Graphs of average Seff vs. Veff for six post-infusion time points in each ROI, both with (solid circles) and without (open circles, dashed lines) FLX pretreatment. Linearity of the plots suggests non-saturating 5HT removal in each region, while differences in the slopes suggest variable effects of FLX consistent with the images in panel (A).
Kinetic modeling of the 2G9C6 molecular fMRI data also enables estimation of classical enzyme kinetic parameters (Figure 4C). By assuming a fast equilibrium between 2G9C6-5HT and 2G9C6 after the sensor infusion period, we determined effective free 5HT concentrations Seff, given by Kd[2G9C6-5HT]/[2G9C6]. We also computed effective velocities of 5HT removal Veff, given by kU[2G9C6-5HT]. Seff and Veff values are plotted for each ROI in the presence and absence of FLX (Figure 4D). The range of Seff values for each ROI results from time-dependent depletion of free 5HT during the post-infusion period. These estimated free 5HT concentrations range from 0–6 μM, consistent with the effects of sensor dilution and 5HT unbinding as the infused molecules spread throughout the brain during the imaging experiments. Corresponding 5HT removal velocities range from 0–20 nM/s. Veff values in the 10−9–10−8 M/s range are consistent with kinetic measurements from SERT expressing cells (Blakely et al., 1991) and 5HT clearance rates recorded by in vivo voltammetry (Dankoski et al., 2014).
Several points about the graphs of Seff vs. Veff are notable. First, Seff values are systematically higher in the +FLX condition for all ROIs, showing that our molecular imaging and modeling methods successfully measure this expected result of SSRI treatment. Second, the graphs of Seff vs. Veff in both −FLX and +FLX conditions are approximately linear (R2 > 0.84), with only minimal evidence of asymptotic behavior even for the highest values of Seff. Although these graphs are partially constrained by the kinetic model, the absence of maximal Veff values even for effective 5HT concentrations over 1 μM suggests that the dominant mechanisms of 5HT clearance do not saturate with increasing [5HT]. This adds to previous evidence that 5HT transporters behave more like non-saturating channels (DeFelice and Goswami, 2007; Petersen and DeFelice, 1999) than like conventional saturating Michaelis-Menten enzymes at 5HT concentrations above the reported Km values of 0.1–0.3 μM (Blakely et al., 1991; Hagan et al., 2010). Finally, the FLX-dependent difference in slope for each ROI varies among regions, consistent with the calculated differences in kU (Figure 4B). Slopes of Seff vs. Veff in principle indicate the rate constants for 5HT transport more directly than the kU values, and therefore provide further support for contributions of both FLX-inhibited and FLX-independent mechanisms to 5HT clearance in each region.
Dopamine transporters contribute to striatal serotonin removal
A possible mechanism for FLX-independent 5HT removal from the brain is the nonspecific transport of 5HT by dopamine transporter (DAT) proteins. Electrochemical measurements and experiments in slices have shown that low micromolar 5HT concentrations can be taken up via DAT and packaged for rerelease by dopaminergic neurons (Daws, 2009; Zhou et al., 2005). To assess the contribution of this route to the 5HT removal profiles obtained by molecular fMRI, we repeated the experiments of Figs. 1–4 in five additional rats treated with 20 mg/kg of the DAT inhibitor GBR-12909 (GBR). Like FLX, GBR administration inhibited the relative increase of MRI signal observed following coinjection of 5HT with the 2G9C6 sensor into rat brain (Figure 5A), consistent with partial suppression of 5HT reuptake. Kinetic analysis of the data following methods of Figure 3 yielded a spatial map of 5HT removal rates in the presence of GBR (Figure 5B). The quality of fits (R2 ≥ 0.85) was comparable to those obtained without drugs or in the presence of FLX. The distribution of kU values appeared intermediate between those observed in the absence of drugs and in the presence of FLX (Figure 4A).
Figure 5.
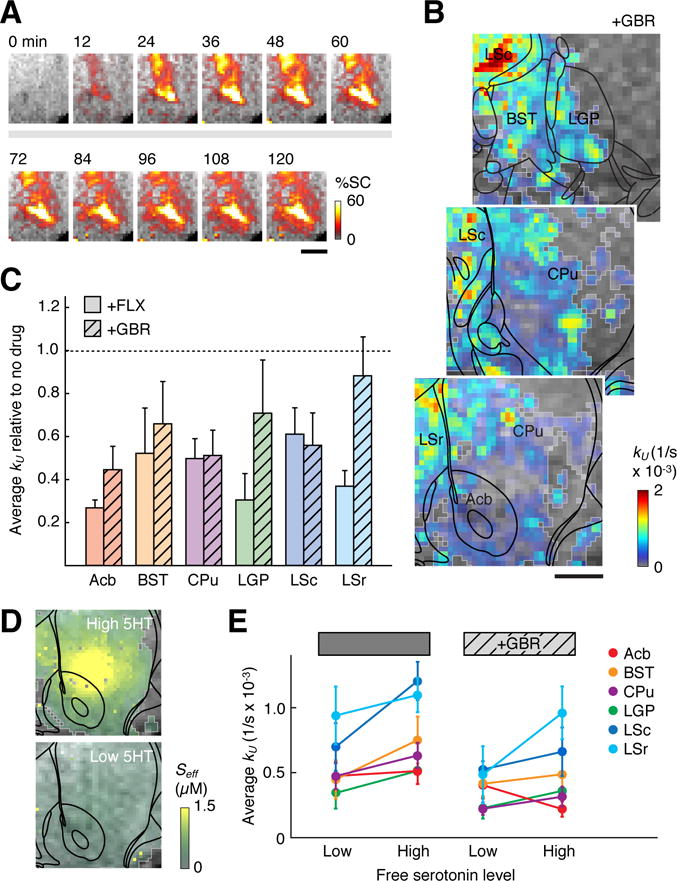
Perturbation of 5HT transport by inhibition of dopamine transporters. (A) Time series images similar to Figure 1B, showing sustained MRI signal increases following brain infusion of 2G9C6-5HT in the presence of the DAT blocker GBR. (B) A map of 5HT unbinding rates observed after GBR pretreatment, color coded and labeled as in Figure 4A. Scale bar = 1 mm. (C) Graph showing mean values of the 5HT removal rate constant kU observed for six ROIs in the presence of FLX or GBR, both shown relative to values observed in the absence of drug treatment. (D) Effective free 5HT concentrations (Seff) following infusion of 1:1 5HT:2G9C6 (top, high 5HT) or 1:2 5HT:2G9C6 (bottom, low 5HT) into rat brain, as estimated from compartmental model fitting. Scale bar = 1 mm. (E) Mean 5HT unbinding rates (kU values) for six ROIs, determined by compartmental modeling of data obtained in the low and high 5HT regimes of panel D, in the presence and absence of DAT inhibition with GBR. Suppression of kU by GBR in CPu is significant under both high and low 5HT regimes (p = 0.03–0.05), while suppression of kU in Acb and LSc is significant only at high 5HT (p = 0.05).
Averaging the kU values over anatomically-defined ROIs permitted quantitative comparison of the effects of GBR and FLX with respect to 5HT transport observed in the absence of drugs (Figure 5C). Whereas FLX-dependent suppression of 5HT removal was statistically significant (p ≤ 0.049) in every ROI other than BST, GBR-dependent uptake suppression was significant only in Acb (p = 0.03), CPu (p = 0.03), and LSc (p = 0.05). Interestingly, GBR suppressed 5HT removal in CPu to approximately the same extent as FLX did, by about 50%; this may reflect the particularly high concentration of DAT available for promiscuous 5HT uptake in this region (Richfield, 1991). In LSr by contrast, where some of the greatest effects of FLX on 5HT removal were observed (64 ± 14% suppression, p = 0.002), GBR barely reduced kU values at all (13 ± 18% suppression, p = 0.6); the mean kU difference following FLX vs. GBR treatment in LSr was significant (p = 0.03).
In the experiments of Figure 5A–C, free 5HT concentrations in the brain were estimated to reach maximal values of about 6 μM near the injection cannula, falling to submicromolar levels in areas further from the injection site (Figure S4A). 5HT concentrations above 1 μM are higher than reported stimulus-evoked 5HT concentrations in the brain (Bunin and Wightman, 1998), and we wondered whether the apparent role of dopamine transporters in 5HT removal would persist if we adjusted the experimental conditions to maintain lower, uniformly submicromolar 5HT concentrations. We therefore applied our imaging and compartmental modeling approach following co-injection of 500 μM 2G9C6 with 250 μM 5HT, a 2:1 2G9C6:5HT mixture predicted to produce buffered free 5HT concentrations of at most 0.7 μM. Raw MRI signal changes obtained following infusion of this low 5HT solution into rat striatum (Figure S4B) were similar to those shown in Figure 1C, with post-injection signal increases consistent with 5HT removal from 2G9C6 predominating over much of the ROI; as in Figure 1 and Figure S1B, signal increases were reversed in animals pretreated with the SERT inhibitor FLX, indicating the suppression of 5HT removal by the drug.
A group analysis of 2:1 2G9C6:5HT infusion experiments performed in the absence and presence of GBR (both n = 5) was performed. Results indicated that DAT inhibition with GBR continued to affect raw molecular imaging trajectories and 5HT unbinding rate maps obtained from model fitting (R2 ≥ 0.84), even though free 5HT (Seff) levels were observed to remain below 600 nM—about tenfold lower than peak 5HT concentrations following equimolar 2G9C6-5HT infusion (Figure 5D & Figure S5). Comparison of ROI-averaged kU values (Figure 5E) showed a trend toward higher kU values in experiments where higher [5HT] was present (Figure 5E), although the differences were not statistically significant for individual ROIs (t-test p > 0.06). Similar results were observed in the presence of FLX (Figure S6). Most ROIs showed a GBR-dependent reduction in mean 5HT unbinding rates in both low and high 5HT conditions, on average by 29% and 34%, respectively. Importantly, the kU reductions in CPu were statistically significant in both experimental regimes (p ≤ 0.05), suggesting that DAT-mediated 5HT transport remains a factor over a wide range of 5HT concentrations. In contrast, the GBR-induced kU reductions in Acb and LSc observed at high 5HT levels were not significant at low 5HT. In each ROI, GBR-dependent kU decreases were less than or equal to those observed in the presence of FLX (Figure S6D), but the differences between the two drugs were not statistically significant.
DISCUSSION
This work demonstrates that three-dimensional functional imaging of neurotransmitter transport can be performed in vivo using the MRI-detectable 5HT sensor 2G9C6. The approach involves co-infusing exogenous 5HT initially in complex with 2G9C6 into the brain, and then analyzing fMRI signal changes that result from neurotransmitter dissociation from the sensor. A customized multivoxel compartmental modeling approach is used to extract transport parameters from the raw MRI data and to calculate the rate of 5HT removal at each point, notwithstanding the inhomogeneous distributions of both neurotransmitter and MRI sensor. The effects of drugs such as the antidepressant FLX and the DAT blocker GBR can be mapped and compared.
During intracranial infusion of the 5HT-2G9C6 mixture, convective forces allow the sensor to spread over volumes of several microliters, permitting kinetic measurements over brain regions far more expansive than those accessible by point measurement techniques like electrochemistry and microdialysis. In principle, the coverage of the molecular fMRI technique could be further extended by performing multiple injections in parallel, or by using minimally-invasive trans-blood-brain barrier delivery techniques (Lelyveld et al., 2010). Although the brain coverage might still be limited compared with radioligand-based neurotransmitter measurements, these other methods cannot distinguish between intracellular and extracellular ligand and are therefore inherently ill suited to monitoring microscopic intravoxel transport processes such as 5HT reuptake. In contrast, our approach could monitor the process of 5HT removal from its binding equilibrium with the MRI sensor 2G9C6 within each voxel of the tissue, reflecting combined contributions from both extrasynaptic and synaptic regions accessible to the sensor because of its small diameter (~6 nm).
The fact that we did not include unbound 5HT in our modeling approach is a possible source of error, but the decision to treat 5HT only via its interactions with 2G9C6 was required for computational efficiency and justified by the relatively low concentrations of free 5HT in equilibrium with neurotransmitter bound to the sensor. Because of the limited sensitivity afforded by 2G9C6, our molecular fMRI experiments involved intracranial injection of relatively concentrated solutions including total [5HT] up to 500 μM. Although our procedure introduced high total amounts of 5HT into the injected regions, the concentration of free 5HT—the unbound neurotransmitter level actually “seen” by transporters and other interaction partners—could be experimentally set by manipulating the ratio of 2G9C6 and 5HT infused into the brain. Using this approach, we performed separate sets of experiments that resulted in free 5HT concentrations of approximately 0–6 μM or 0–0.6 μM in the brain, and we observed largely similar transport constants and susceptibility to pharmacological perturbation in the two regimes.
The most immediate outcome of our study is the determination of unprecedented volumetric maps of 5HT transport parameters and their perturbation by FLX and GBR. Such data were not accessible to previous techniques and required development of the molecular imaging and compartmental modeling paradigm we introduce here. Unlike radioligand or immunohistochemical studies of SERT and DAT localization, the molecular fMRI data we present directly reflect 5HT dynamics themselves, as detected via binding of 5HT to the 2G9C6 MRI sensor. For this reason, the sensor unbinding rates we determined (kU values) could be affected by multiple processes, including but not limited to SERT or DAT-mediated cell uptake of 5HT. Additional factors include 5HT removal mediated by other transporters (Daws et al., 1998; Eiden et al., 2004; Eiden and Weihe, 2011) or bulk transport mechanisms (Iliff et al., 2012), sequestration of 5HT by specific or nonspecific cell binding, leakage of interstitial 5HT into the bloodstream (particularly near cannula implantation sites), and destruction of 5HT via cell-independent mechanisms such as spontaneous oxidation (Wegener et al., 2000). With the exception of injury, all of these factors are relevant to normal brain biology.
Several observations suggest that SERT activity was a major contributor to 5HT sensor unbinding rates. First, both raw post-infusion MRI signal (Figure 2) and kU rates (Figure 4) were suppressed in each ROI by application of the SSRI FLX. 5HT removal rates were reduced by an average of over 50% among all ROIs in the presence of FLX, and were statistically significant in all regions except BST. Second, quantitative interpretation of the molecular fMRI data in terms of free 5HT transport velocities (Figure 4D) produced results comparable to previously reported transport rates and supports a previously proposed mode of non-saturating SERT activity dependence on 5HT concentration (DeFelice and Goswami, 2007; Petersen and DeFelice, 1999). Spatial features of the MRI-based 5HT transport maps reported in Figure 4 may also suggest a dominant role for SERT. In particular, the peak kU values we discovered in regions of LS are consistent with earlier autoradiographic results indicating higher SERT expression in LS compared with CPu and surrounding structures (De Souza and Kuyatt, 1987; Jupp et al., 2013), as well as with microdialysis measurements showing greater effects of FLX on extracellular 5HT concentrations in LS than in striatum (Kirby and Lucki, 1997). LS subregions also displayed relatively high kU in the presence of FLX, as well as suppression of kU values by the DAT inhibitor GBR, suggesting that SERT-independent 5HT removal mechanisms may be especially active in this region.
A striking result of the experiments is the finding that the dopamine transport inhibitor GBR substantially perturbs 5HT removal in some of the brain areas examined, a likely consequence of promiscuous DAT activity (Daws, 2009) which can now be measured and mapped in vivo by our imaging method. Our observation of DAT-dependent 5HT transport in regions of the basal ganglia is consistent with earlier studies documenting GBR-mediated reduction of 5HT uptake in striatum (Callaghan et al., 2005; Shu et al., 2014) as well as with evidence that striatal concentrations of 5HT and 5HT metabolites are increased by selective DAT inhibition in normal or SERT knock-out animals (Shen et al., 2004; Wong et al., 1995). In our molecular fMRI studies, GBR-mediated kU suppression was most pronounced in the CPu, an area known for high DAT expression (Ciliax et al., 1995; Richfield, 1991), where inhibition of 5HT removal was consistently observed in the presence of free 5HT concentrations that peaked from 0.6 to 6 μM. In the presence of micromolar concentrations of free 5HT, but not nanomolar levels, GBR also significantly depressed 5HT uptake in Acb. The difference between Acb and CPu may arise in part the fact that Acb displays lower DAT and higher SERT expression than CPu (De Souza and Kuyatt, 1987; Wilson et al., 1994); this expression pattern could also explain the comparatively greater effect of FLX on kU values in Acb than CPu (Figure 5C).
The sensitivity of 5HT transport to both FLX and GBR in striatal areas contrasts with the more selective effects of FLX in LSr, which are particularly notable at higher neurotransmitter concentrations. LS receives extensive serotonergic projections from dorsal raphe (Waselus et al., 2011) and also expresses particularly high levels of 5HT1A receptor (Pazos and Palacios, 1985), the 5HT receptor subtype most directly implicated in the clinical efficacy of SSRI antidepressant drugs (Celada et al., 2013). Activation of these receptors appears to produce anxiolytic effects (Singewald et al., 2011). Although the mechanisms by which SSRIs affect the serotonergic system are complex (Stahl, 1998; Walker, 2013), it is possible that the relative potency of FLX in subregions of LS is specifically important for its antidepressant effects. This idea could be further developed in part by application of the 5HT molecular imaging methodology in conjunction with additional drugs or manipulations. More generally, the molecular fMRI paradigm we introduce here provides unique capability for spatial and temporal analysis of drug action on neurochemical processes in the brain, and could aid importantly in the characterization or selection of substances destined for clinical use.
EXPERIMENTAL PROCEDURES
Protein expression and purification
The hexahistidine tagged cytochrome P450 BM3 heme domain variant BM3h-2G9C6 (2G9C6) was prepared following previously described procedures (Brustad et al., 2012; Lee et al., 2014; Shapiro et al., 2010). Briefly, overnight cultures of E. coli BL21(DE3) cells carrying a pCWori(+) plasmid encoding 2G9C6 regulated by a tandem Ptac promoter were inoculated at a 1:100 volumetric ratio into terrific broth (TB) medium containing carbenicillin at 100 μg/mL. Cultures were grown at 37 °C to an optical density at 600 nm in the 0.8–1.0 range, and expression was induced by addition of 0.6 mM iso-propyl β-D-1-thiogalactopyranoside for 12–16 h at 30 °C in the presence of 0.6 mM δ-aminolevulinate. Harvested cell pellets were lysed in BugBuster (EMD Millipore, Billerica, MA) with lysozyme and benzonase, according to the manufacturer’s protocol, and a protease inhibitor cocktail (Set III EDTA-free, EMD Millipore) was added at 1:1000 dilution. 2G9C6 was affinity purified from centrifugally clarified lysate using Ni-NTA agarose resin (Qiagen, Valencia, CA), concentrated in a 30 kDa molecular weight cutoff ultracentrifugation device (Amicon Ultra, EMD Millipore), further purified by anion exchange chromatography (HiTrap Q XL, GE Healthcare Biosciences, Pittsburgh, PA), and exchanged into phosphate buffered saline (PBS), pH 7.4, using a desalting column (PD10, GE Healthcare Biosciences). Aliquots of purified protein were flash frozen in liquid nitrogen and stored at −80 °C. 2G9C6 concentrations were determined spectrophotometrically as the reduced CO complex with molar extinction coefficient 91 mM−1 cm−1 at 450 nm.
Relaxivity measurement
Longitudinal T1 relaxivity (r1) of purified 2G9C6 was quantified in a 9.4 T Avance II MRI scanner (Bruker Instruments, Ettlingen, Germany) at 37 °C. One half of a 384-well microtiter plate was loaded with protein solutions with a range of concentrations in PBS, pH 7.4, with or without saturating serotonin (5HT, 2 mM). Temperature of the sample was maintained in the scanner bore using a circulating water bath and monitored using an MRI compatible temperature probe during the scan. A series of T1-weighted scans of a 2 mm slice across the plate were acquired using a spin echo pulse sequence with echo time (TE) of 10 ms and recycle times (TR) of 116–3125 ms. Intensity values in square regions of interest centered on each plate well were determined from reconstructed magnitude images and fit to exponential decay curves to determine relaxation rates (R1 values) for each well using custom routines written in Matlab (Mathworks, Natick, MA). The slopes of R1 vs. protein concentration were evaluated to determine r1 values.
Stopped-flow analysis of protein-ligand binding kinetics
Kinetics of 5HT binding and unbinding to BM3h-2G9C6 in vitro were studied using an Applied Photophysics (Surrey, UK) DX-18MV SF stopped-flow spectrophotometry system operating at room temperature. Protein and 5HT solutions formulated in PBS were mixed in 1:1 volume ratio to final concentrations of 2.5 μM 2G9C6 and 20, 30, 40, or 60 μM 5HT. First order rate constants were determined by exponential fitting to absorbance traces measured at 415 nm, with four or more replicates performed per condition. Forward and reverse rate constants were determined by linear fitting to these data, to obtain values of kon = 3.2 × 10⁴ M−1s−1 and koff = 0.023 s−1. Data analysis was performed in Matlab.
Animal use
Male Sprague-Dawley rats (250–300 g) were purchased from Charles River Laboratories (Wilmington, MA) and used for all in vivo experiments. Animals were housed and maintained on a 12 hr light/dark cycle and permitted ad libitum access to food and water in strict compliance with the Committee on Animal Care (CAC) guidelines of the Massachusetts Institute of Technology.
Preparation for intracranial injection and imaging
Intracerebral guide cannulae were implanted surgically to facilitate intracranial injection of 2G9C6 in MRI experiments. Each animal was anesthetized with isoflurane (4% induction, 2% maintenance), shaved, and mounted on a rodent stereotaxic device (Kopf Instruments, Tujunga, CA) with heating pad. Heart rate and blood oxygenation were continuously monitored using a pulse oximeter (Nonin Medical, Plymouth, MN) during all subsequent procedures. The scalp was retracted and small holes were drilled into the skull above the target sites. Two MRI-compatible 2 mm long guide cannulae (22 gauge; PlasticsOne, Roanoke, VA) were implanted approximately 1.2 mm anterior and 1.5 mm lateral to bregma. A custom fabricated plastic headpost was placed in front of the guide cannulae. Dental cement was applied to secure the implants rigidly in place. Each animal recovered from anesthesia under supervision. Buprenorphin (0.05 mg/kg) was injected subcutaneously after surgery and then twice daily over a three-day monitoring period.
Immediately prior to contrast agent injection, MRI compatible injection cannulae (7.1 mm long below a pedestal, PlasticsOne) were connected to microtubing pre-filled with 15 μL of 500 μM 2G9C6 with 0, 250, or 500 μM 5HT, resulting in predicted free 5HT concentrations of up to 0, 0.7, and 18 μM, respectively, as determined by 2G9C6-dependent buffering with the reported Kd of 0.7 μM (Brustad et al., 2012). Injection mixtures were all formulated in PBS. The injection cannulae were slowly lowered into the previously implanted guide cannulae while infusing contrast agent at a small injection rate to prevent air from becoming trapped during insertion. Injection cannulae were secured to the guide cannula with dental cement and contrast agent injection was paused. The animal was then transferred to a plexiglass cradle covered with a water heating blanket to maintain body temperature, and inserted into a transmission-only volume coil (Bruker Instruments) in conjunction with a receive-only surface coil (Doty Scientific, Columbia, SC) mounted on the head of the animal. The animal was positioned at the isocenter of a 9.4 T Bruker Avance II scanner (Bruker Instruments). The heart rate, spO2 level and expired CO2 levels were monitored throughout the scan using Nonin 8600V pulse oximeter (Nonin Medical, Plymouth, MN). Heart rate was maintained at 360–380 bpm. The animal was maintained with continuous delivery of 1.5% isoflurane for the duration of the scanning session. Some animals were pretreated by intraperitoneal injection of the SSRI fluoxetine hydrochloride (FLX, 5 mg/kg) or the dopamine transporter blocker GBR-12909 (GBR, 20 mg/kg). Imaging and 2G9C6 infusion commenced approximately 90 minutes after drug pretreatment in these cases.
MRI data acquisition
Anatomical scans, T1 maps, and T1-weighted scan series were obtained from each animal. Multislice anatomical images with 200 μm in-plane resolution over six 1 mm coronal slices were obtained using a gradient echo pulse sequence with a repetition time (TR) of 250 ms, echo time (TE) of 15.7 ms, field of view (FOV) of 25.6 × 12.8 mm, data matrix of 128 × 64 points, 4 averages, and 64 s total scan time. T1 maps were computed using data from a rapid acquisition with refocused echoes (RARE) pulse sequence with 8 TR values (321, 600, 900, 1000, 1500, 2000, 2500, and 3000 ms), TE of 10 ms, RARE factor of 4, FOV of 25.6 × 12.8 mm, data matrix of 64 × 32 points, and six 1 mm coronal slices with 4 averages and 378 s total scan time. Scan series for functional imaging were obtained using a gradient echo pulse sequence with a flip angle of 30°, TR of 250 ms, TE of 10 ms, FOV of 25.6 × 12.8 mm, data matrix of 128 × 64 points, and 1 mm coronal slice thickness, with 16 s scan time per image. Scans were obtained consecutively for 120 minutes; during the first 60 minutes only, 2G9C6 solutions were infused at a constant rate of 0.12 μL/min.
Histology and confocal imaging
Following MRI experiments described above, rats were placed under terminal anes-thesia using 5% isoflurane and transcardially perfused with phosphate buffer containing heparin (Hospira, Lake Forest, IL) and then with 4% wt/vol paraformaldehyde (Sigma-Aldrich, St. Louis, MO). Brains were then removed and left overnight in 4% paraformaldehyde, followed by a wash in phosphate buffer saline. Coronal section of 30 m thickness were cut using a vibratome (VT1200, Leica Biosystems, IL) across a range extending ~3 mm anterior and posterior from the injection cannula site. Antibody staining for 5HT transporter was done using standard procedures at a dilution of 1:200 of primary antibody (anti-HTT/SERT, Frontiers Institute Co., Ishikari, Japan). Confocal imaging was performed using Nikon A1R Ultra-Fast Spectral Scanning Confocal Microscope.
Compartmental modeling
Post-processing and model fitting to the data was performed using customized routines in Matlab and C. Raw image time series were temporally low-pass filtered (< 0.1 Hz) and time courses from voxels in a 4.8 × 4.8 × 3 mm region of interest near the 2G9C6 infusion sites were obtained.
These time courses were then jointly fitted to a compartmental model. The model describes the transfer and evolution of both 5HT-bound and unbound 2G9C6 according to four processes: (1) diffusion of bound and unbound sensor between adjacent non-diagonal voxels was modeled using a single first order rate constant kD; (2) convective transfer of bound and unbound 2G9C6 to adjacent non-diagonal voxels was modeled using voxel-specific first order rate constants kCi,j,k (i, j, and k are voxel indices); (3) endocytosis and trapping of bound or unbound sensor was modeled using voxel-specific rate constants kTi,j,k; (4) Removal of 5HT resulting in net conversion of 5HT-bound to unbound 2G9C6 was modeled using voxel-specific first order rate constants kUi,j,k.
R1 values observed for each voxel at time t were therefore described by the following expressions:
| [1] |
where R10 is the average background R1 value observed in uninjected brain, determined to be 0.24 s−1. Amounts of the bound and unbound 2G9C6 sensor Bi,j,k(t) and Ui,j,k(t), as well as corresponding trapped species B*i,j,k(t) and U*i,j,k(t) were updated for each time step t to t + 1, according to the following rules:
| [2] |
| [3] |
| [4] |
| [5] |
V is a parameter that adjusts diffusion and convection rates to account for the longer voxel dimension in the MRI slice direction. Setting this parameter to 0.075 resulted in a physically justified equivalent spread of contrast agent between vs. within slices. kCi,j,k values were set to zero for the second half of each time series, when contrast agent infusion had stopped. The only model parameter which was arbitrarily fixed was kD, the diffusion rate constant; this parameter was set to 0.0004 s−1, which resulted in diffusion equivalent to that observed for macromolecules similar in size to 2G9C6 according to previously published biophysical measurements (Syková and Nicholson, 2008; Tao and Nicholson, 1996). Fixing kD limited the potential for overfitting or unphysical refinement of this parameter during model fitting.
Parameter optimization was performed using Matlab’s internal least-squares fit routines. Voxels included were those exhibiting positive signal changes throughout the 60 minutes of injection. The input data to the fitting algorithm consisted of a 24 × 24 × 3 matrix of MRI signal intensities in three adjacent image slices, sampled from the low-pass filtered experimental data at 11 equally spaced time points over the 120 min long injection and post-injection periods. The output consisted of best fit values for parameters kC, kU, and kT, as well as corresponding time trajectories calculated using these values. Function tolerance for the termination of the optimization algorithm was set to 10−7. All refined models fit the data with average R2 values ranging from 0.84 to 0.97 in each animal. To ensure that the literature-based choice of kD did not substantially bias the fitting results, we varied kD while recomputing the goodness of fit for representative datasets obtained under no drug or +FLX conditions. In these tests, we artificially chose diffusion rate constants from across a tenfold range which exceeds any natural variability likely to be found in brain tissue. We found that disparate kD values only slightly compromised the goodness of fit, from an average R2 of 0.90 to an average of 0.87. This demonstrates that the precise value of the diffusion parameter has minimal effect on the performance of our modeling.
Mean kU maps (Figures 4A, 5B, S5, and S6) were generated by averaging model data from individual animals among voxels for which data from two or more animals were available. An analogous procedure was used to compute the free 5HT concentration maps in Figures 5D, S4, S5, and S6. Average ROI values were computed by first averaging the ROI signal for a given dataset, and then averaging across datasets from each animal. Effective free 5HT concentrations (Seff) and 5HT removal velocities (Veff) were computed using the formulae Seff = Kd[2G9C6-5HT]/[2G9C6] and Veff = kU[2G9C6-5HT]. Statistical tests were performed using Matlab. All error bars and error margins noted in the text denote standard error of the mean (s.e.m.) of multiple measurements, unless otherwise noted.
Supplementary Material
Acknowledgments
This research was funded by NIH grants R01 DA028299, R01 DA038642, and R01 NS076462 to AJ. The authors would like to thank Alexandria Liang and Stephen Lippard for help with stopped flow measurements and Robert Marini for veterinary guidance. AH was supported by postdoctoral fellowships from the Edmond & Lily Safra Center for Brain Sciences (ELSC) and the European Molecular Biology Organization (EMBO).
Abbreviations
- BST
Bed Nucleus of the Stria Terminalis
- CPu
Caudate-Putamen
- DAT
Dopamine Transporter
- fMRI
Functional Magnetic Resonance Imaging
- Hippo
Hippo-campus
- LGP
Lateral Globus Pallidus
- LSr
Lateral Septum Caudal Part
- LSr
Lateral Septum Rostral Part
- MRI
Magnetic Resonance Imaging
- Acb
Nucleus Accumbens
- ROI
Region of Interest
- SERT
Serotonin Transporter
Footnotes
Publisher's Disclaimer: This is a PDF file of an unedited manuscript that has been accepted for publication. As a service to our customers we are providing this early version of the manuscript. The manuscript will undergo copyediting, typesetting, and review of the resulting proof before it is published in its final citable form. Please note that during the production process errors may be discovered which could affect the content, and all legal disclaimers that apply to the journal pertain.
AUTHOR CONTRIBUTIONS
AH performed the molecular fMRI experiments. AH and AJ designed the research, analyzed the data and wrote the paper. LXC and TL participated in preliminary in vivo measurements. AH and VSL performed in vitro measurements.
References
- Amara SG, Kuhar MJ. Neurotransmitter transporters: recent progress. Annu Rev Neurosci. 1993;16:73–93. doi: 10.1146/annurev.ne.16.030193.000445. [DOI] [PubMed] [Google Scholar]
- Blakely RD, Berson HE, Fremeau RT, Jr, Caron MG, Peek MM, Prince HK, Bradley CC. Cloning and expression of a functional serotonin transporter from rat brain. Nature. 1991;354:66–70. doi: 10.1038/354066a0. [DOI] [PubMed] [Google Scholar]
- Brustad EM, Lelyveld VS, Snow CD, Crook N, Jung ST, Martinez FM, Scholl TJ, Jasanoff A, Arnold FH. Structure-Guided Directed Evolution of Highly Selective P450-Based Magnetic Resonance Imaging Sensors for Dopamine and Serotonin. J Mol Biol. 2012;422:245–262. doi: 10.1016/j.jmb.2012.05.029. [DOI] [PMC free article] [PubMed] [Google Scholar]
- Bucher ES, Wightman RM. Electrochemical Analysis of Neurotransmitters. Annu Rev Anal Chem. 2015;8:239–261. doi: 10.1146/annurev-anchem-071114-040426. [DOI] [PMC free article] [PubMed] [Google Scholar]
- Bunin MA, Wightman RM. Quantitative evaluation of 5-hydroxytryptamine (serotonin) neuronal release and uptake: an investigation of extrasynaptic transmission. J Neurosci. 1998;18:4854–4860. doi: 10.1523/JNEUROSCI.18-13-04854.1998. [DOI] [PMC free article] [PubMed] [Google Scholar]
- Callaghan PD, Irvine RJ, Daws LC. Differences in the in vivo dynamics of neurotransmitter release and serotonin uptake after acute paramethoxyamphetamine and 3,4-methylenedioxymethamphetamine revealed by chronoamperometry. Neurochem Int. 2005;47:350–361. doi: 10.1016/j.neuint.2005.04.026. [DOI] [PubMed] [Google Scholar]
- Castrén E. Is mood chemistry? Nat Rev Neurosci. 2005;6:241–246. doi: 10.1038/nrn1629. [DOI] [PubMed] [Google Scholar]
- Celada P, Bortolozzi A, Artigas F. Serotonin 5-HT1A receptors as targets for agents to treat psychiatric disorders: rationale and current status of research. CNS Drugs. 2013;27:703–716. doi: 10.1007/s40263-013-0071-0. [DOI] [PubMed] [Google Scholar]
- Chamberlain SR, Muller U, Blackwell AD, Clark L, Robbins TW, Sahakian BJ. Neurochemical modulation of response inhibition and probabilistic learning in humans. Science. 2006;311:861–863. doi: 10.1126/science.1121218. [DOI] [PMC free article] [PubMed] [Google Scholar]
- Chen JL, Lin WC, Cha JW, So PT, Kubota Y, Nedivi E. Structural basis for the role of inhibition in facilitating adult brain plasticity. Nat Neurosci. 2011;14:587–594. doi: 10.1038/nn.2799. [DOI] [PMC free article] [PubMed] [Google Scholar]
- Ciliax BJ, Heilman C, Demchyshyn LL, Pristupa ZB, Ince E, Hersch SM, Niznik HB, Levey AI. The dopamine transporter: immunochemical characterization and localization in brain. J Neurosci. 1995;15:1714–1723. doi: 10.1523/JNEUROSCI.15-03-01714.1995. [DOI] [PMC free article] [PubMed] [Google Scholar]
- Dankoski EC, Agster KL, Fox ME, Moy SS, Wightman RM. Facilitation of serotonin signaling by SSRIs is attenuated by social isolation. Neuropsychopharmacology. 2014;39:2928–2937. doi: 10.1038/npp.2014.162. [DOI] [PMC free article] [PubMed] [Google Scholar]
- Daws LC. Unfaithful neurotransmitter transporters: focus on serotonin uptake and implications for antidepressant efficacy. Pharmacol Ther. 2009;121:89–99. doi: 10.1016/j.pharmthera.2008.10.004. [DOI] [PMC free article] [PubMed] [Google Scholar]
- Daws LC, Toney GM, Davis DJ, Gerhardt GA, Frazer A. In vivo chronoamperometric measurements of the clearance of exogenously applied serotonin in the rat dentate gyrus. J Neurosci Methods. 1997;78:139–150. doi: 10.1016/s0165-0270(97)00144-1. [DOI] [PubMed] [Google Scholar]
- Daws LC, Toney GM, Gerhardt GA, Frazer A. In vivo chronoamperometric measures of extracellular serotonin clearance in rat dorsal hippocampus: contribution of serotonin and norepinephrine transporters. J Pharmacol Exp Ther. 1998;286:967–976. [PubMed] [Google Scholar]
- De Souza EB, Kuyatt BL. Autoradiographic localization of 3H-paroxetine-labeled serotonin uptake sites in rat brain. Synapse. 1987;1:488–496. doi: 10.1002/syn.890010513. [DOI] [PubMed] [Google Scholar]
- DeFelice LJ, Goswami T. Transporters as channels. Annu Rev Physiol. 2007;69:87–112. doi: 10.1146/annurev.physiol.69.031905.164816. [DOI] [PubMed] [Google Scholar]
- Eiden LE, Schäfer MK, Weihe E, Schütz B. The vesicular amine transporter family (SLC18): amine/proton antiporters required for vesicular accumulation and regulated exocytotic secretion of monoamines and acetylcholine. Pflugers Arch. 2004;447:636–640. doi: 10.1007/s00424-003-1100-5. [DOI] [PubMed] [Google Scholar]
- Eiden LE, Weihe E. VMAT2: a dynamic regulator of brain monoaminergic neuronal function interacting with drugs of abuse. Ann N Y Acad Sci. 2011;1216:86–98. doi: 10.1111/j.1749-6632.2010.05906.x. [DOI] [PMC free article] [PubMed] [Google Scholar]
- Gorman JM, Kent JM. SSRIs and SNRIs: broad spectrum of efficacy beyond major depression. J Clin Psychiatry. 1999;60(Suppl 4):33–38. [PubMed] [Google Scholar]
- Hagan CE, Neumaier JF, Schenk JO. Rotating disk electrode voltammetric measurements of serotonin transporter kinetics in synaptosomes. J Neurosci Methods. 2010;193:29–38. doi: 10.1016/j.jneumeth.2010.08.009. [DOI] [PMC free article] [PubMed] [Google Scholar]
- Huang Y, Zheng MQ, Gerdes JM. Development of effective PET and SPECT imaging agents for the serotonin transporter: has a twenty-year journey reached its destination? Curr Top Med Chem. 2010;10:1499–1526. doi: 10.2174/156802610793176792. [DOI] [PubMed] [Google Scholar]
- Iliff JJ, Wang M, Liao Y, Plogg BA, Peng W, Gundersen GA, Benveniste H, Vates GE, Deane R, Goldman SA, et al. A paravascular pathway facilitates CSF flow through the brain parenchyma and the clearance of interstitial solutes, including amyloid β. Sci Transl Med. 2012;4:147ra111. doi: 10.1126/scitranslmed.3003748. [DOI] [PMC free article] [PubMed] [Google Scholar]
- Iversen L. Neurotransmitter transporters: fruitful targets for CNS drug discovery. Mol Psychiatry. 2000;5:357–362. doi: 10.1038/sj.mp.4000728. [DOI] [PubMed] [Google Scholar]
- Jensen AA, Fahlke C, Bjorn-Yoshimoto WE, Bunch L. Excitatory amino acid transporters: recent insights into molecular mechanisms, novel modes of modulation and new therapeutic possibilities. Curr Opin Pharmacol. 2015;20:116–123. doi: 10.1016/j.coph.2014.10.008. [DOI] [PubMed] [Google Scholar]
- Jupp B, Caprioli D, Saigal N, Reverte I, Shrestha S, Cumming P, Everitt BJ, Robbins TW, Dalley JW. Dopaminergic and GABA-ergic markers of impulsivity in rats: evidence for anatomical localisation in ventral striatum and prefrontal cortex. Eur J Neurosci. 2013;37:1519–1528. doi: 10.1111/ejn.12146. [DOI] [PubMed] [Google Scholar]
- Kanner BI, Zomot E. Sodium-coupled neurotransmitter transporters. Chem Rev. 2008;108:1654–1668. doi: 10.1021/cr078246a. [DOI] [PubMed] [Google Scholar]
- Kirby LG, Lucki I. Interaction between the forced swimming test and fluoxetine treatment on extracellular 5-hydroxytryptamine and 5-hydroxyindoleacetic acid in the rat. J Pharmacol Exp Ther. 1997;282:967–976. [PubMed] [Google Scholar]
- Kirsch I, Deacon BJ, Huedo-Medina TB, Scoboria A, Moore TJ, Johnson BT. Initial severity and antidepressant benefits: a meta-analysis of data submitted to the Food and Drug Administration. PLoS Med. 2008;5:e45. doi: 10.1371/journal.pmed.0050045. [DOI] [PMC free article] [PubMed] [Google Scholar]
- Kirsch I, Moore TJ, Scoboria A, Nicholls SS. The emperor’s new drugs: an analysis of antidepressant medication data submitted to the US Food and Drug Administration. Prevention Treatment. 2002;5:23a. [Google Scholar]
- Laruelle M. Imaging synaptic neurotransmission with in vivo binding competition techniques: a critical review. J Cereb Blood Flow Metab. 2000;20:423–451. doi: 10.1097/00004647-200003000-00001. [DOI] [PubMed] [Google Scholar]
- Lee T, Cai LX, Lelyveld VS, Hai A, Jasanoff A. Molecular-level functional magnetic resonance imaging of dopaminergic signaling. Science. 2014;344:533–535. doi: 10.1126/science.1249380. [DOI] [PMC free article] [PubMed] [Google Scholar]
- Lelyveld VS, Atanasijevic T, Jasanoff A. Challenges for Molecular Neuroimaging with MRI. Int J Imaging Syst Technol. 2010;20:71–79. doi: 10.1002/ima.20221. [DOI] [PMC free article] [PubMed] [Google Scholar]
- Masson J, Sagné C, Hamon M, El Mestikawy S. Neurotransmitter transporters in the central nervous system. Pharmacol Rev. 1999;51:439–464. [PubMed] [Google Scholar]
- Park J, Aragona BJ, Kile BM, Carelli RM, Wightman RM. In vivo voltammetric monitoring of catecholamine release in subterritories of the nucleus accumbens shell. Neuroscience. 2010;169:132–142. doi: 10.1016/j.neuroscience.2010.04.076. [DOI] [PMC free article] [PubMed] [Google Scholar]
- Paterson LM, Kornum BR, Nutt DJ, Pike VW, Knudsen GM. 5-HT radioligands for human brain imaging with PET and SPECT. Med Res Rev. 2013;33:54–111. doi: 10.1002/med.20245. [DOI] [PMC free article] [PubMed] [Google Scholar]
- Pazos A, Palacios JM. Quantitative autoradiographic mapping of serotonin receptors in the rat brain. I. Serotonin-1 receptors. Brain Res. 1985;346:205–230. doi: 10.1016/0006-8993(85)90856-x. [DOI] [PubMed] [Google Scholar]
- Petersen CI, DeFelice LJ. Ionic interactions in the Drosophila serotonin transporter identify it as a serotonin channel. Nat Neurosci. 1999;2:605–610. doi: 10.1038/10158. [DOI] [PubMed] [Google Scholar]
- Richfield EK. Quantitative autoradiography of the dopamine uptake complex in rat brain using [3H]GBR 12935: binding characteristics. Brain Res. 1991;540:1–13. doi: 10.1016/0006-8993(91)90486-f. [DOI] [PubMed] [Google Scholar]
- Santarelli L, Saxe M, Gross C, Surget A, Battaglia F, Dulawa S, Weisstaub N, Lee J, Duman R, Arancio O, et al. Requirement of hippocampal neurogenesis for the behavioral effects of antidepressants. Science. 2003;301:805–809. doi: 10.1126/science.1083328. [DOI] [PubMed] [Google Scholar]
- Shapiro MG, Westmeyer GG, Romero PA, Szablowski JO, Kuester B, Shah A, Otey CR, Langer R, Arnold FH, Jasanoff A. Directed evolution of a magnetic resonance imaging contrast agent for noninvasive imaging of dopamine. Nature Biotechnology. 2010;28:264–U120. doi: 10.1038/nbt.1609. [DOI] [PMC free article] [PubMed] [Google Scholar]
- Shen HW, Hagino Y, Kobayashi H, Shinohara-Tanaka K, Ikeda K, Yamamoto H, Yamamoto T, Lesch KP, Murphy DL, Hall FS, et al. Regional differences in extracellular dopamine and serotonin assessed by in vivo microdialysis in mice lacking dopamine and/or serotonin transporters. Neuropsychopharmacology. 2004;29:1790–1799. doi: 10.1038/sj.npp.1300476. [DOI] [PubMed] [Google Scholar]
- Shu Z, Taylor IM, Walters SH, Michael AC. Region- and domain-dependent action of nomifensine. Eur J Neurosci. 2014;40:2320–2328. doi: 10.1111/ejn.12604. [DOI] [PMC free article] [PubMed] [Google Scholar]
- Singewald GM, Rjabokon A, Singewald N, Ebner K. The modulatory role of the lateral septum on neuroendocrine and behavioral stress responses. Neuropsychopharmacology. 2011;36:793–804. doi: 10.1038/npp.2010.213. [DOI] [PMC free article] [PubMed] [Google Scholar]
- Stahl SM. Mechanism of action of serotonin selective reuptake inhibitors. Serotonin receptors and pathways mediate therapeutic effects and side effects. J Affect Disord. 1998;51:215–235. doi: 10.1016/s0165-0327(98)00221-3. [DOI] [PubMed] [Google Scholar]
- Sulzer D. How addictive drugs disrupt presynaptic dopamine neurotransmission. Neuron. 2011;69:628–649. doi: 10.1016/j.neuron.2011.02.010. [DOI] [PMC free article] [PubMed] [Google Scholar]
- Syková E, Nicholson C. Diffusion in brain extracellular space. Physiol Rev. 2008;88:1277–1340. doi: 10.1152/physrev.00027.2007. [DOI] [PMC free article] [PubMed] [Google Scholar]
- Tao L, Nicholson C. Diffusion of albumins in rat cortical slices and relevance to volume transmission. Neuroscience. 1996;75:839–847. doi: 10.1016/0306-4522(96)00303-x. [DOI] [PubMed] [Google Scholar]
- Vaswani M, Linda FK, Ramesh S. Role of selective serotonin reuptake inhibitors in psychiatric disorders: a comprehensive review. Prog Neuropsychopharmacol Biol Psychiatry. 2003;27:85–102. doi: 10.1016/s0278-5846(02)00338-x. [DOI] [PubMed] [Google Scholar]
- Walker FR. A critical review of the mechanism of action for the selective serotonin reuptake inhibitors: do these drugs possess anti-inflammatory properties and how relevant is this in the treatment of depression? Neuropharmacology. 2013;67:304–317. doi: 10.1016/j.neuropharm.2012.10.002. [DOI] [PubMed] [Google Scholar]
- Waselus M, Valentino RJ, Van Bockstaele EJ. Collateralized dorsal raphe nucleus projections: a mechanism for the integration of diverse functions during stress. J Chem Neuroanat. 2011;41:266–280. doi: 10.1016/j.jchemneu.2011.05.011. [DOI] [PMC free article] [PubMed] [Google Scholar]
- Wegener G, Volke V, Rosenberg R. Endogenous nitric oxide decreases hippocampal levels of serotonin and dopamine in vivo. Br J Pharmacol. 2000;130:575–580. doi: 10.1038/sj.bjp.0703349. [DOI] [PMC free article] [PubMed] [Google Scholar]
- Wilson JM, Nobrega JN, Carroll ME, Niznik HB, Shannak K, Lac ST, Pristupa ZB, Dixon LM, Kish SJ. Heterogeneous subregional binding patterns of 3H-WIN 35,428 and 3H-GBR 12,935 are differentially regulated by chronic cocaine self-administration. J Neurosci. 1994;14:2966–2979. doi: 10.1523/JNEUROSCI.14-05-02966.1994. [DOI] [PMC free article] [PubMed] [Google Scholar]
- Wong ML, Licinio J. Research and treatment approaches to depression. Nat Rev Neurosci. 2001;2:343–351. doi: 10.1038/35072566. [DOI] [PubMed] [Google Scholar]
- Wong PT, Feng H, Teo WL. Interaction of the dopaminergic and serotonergic systems in the rat striatum: effects of selective antagonists and uptake inhibitors. Neurosci Res. 1995;23:115–119. doi: 10.1016/0168-0102(95)90023-3. [DOI] [PubMed] [Google Scholar]
- Zhou FM, Liang Y, Salas R, Zhang L, De Biasi M, Dani JA. Core-lease of dopamine and serotonin from striatal dopamine terminals. Neuron. 2005;46:65–74. doi: 10.1016/j.neuron.2005.02.010. [DOI] [PubMed] [Google Scholar]
Associated Data
This section collects any data citations, data availability statements, or supplementary materials included in this article.