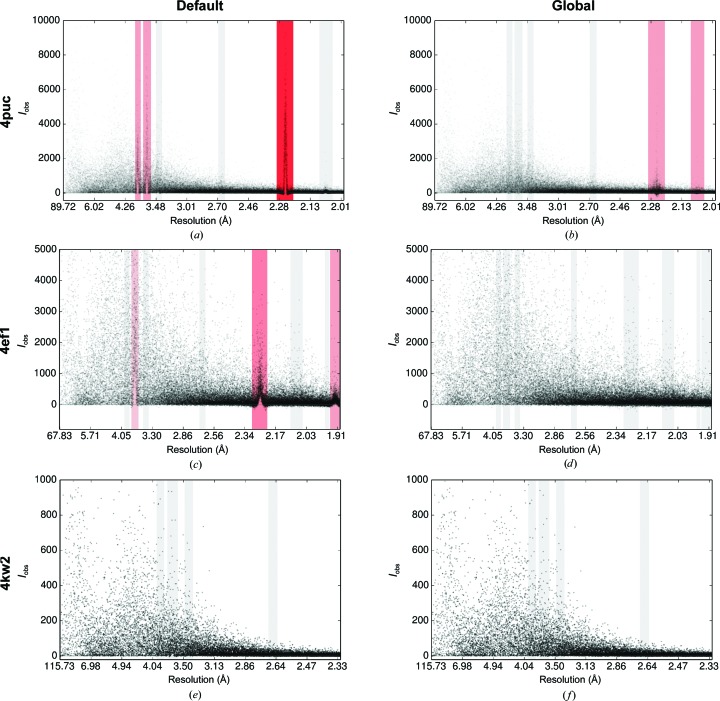
Figure 6.
The intensity versus resolution of reflections processed using the default background algorithm (left) and the new global background-model algorithm (right) for data sets 4puc (a, b), 4ef1 (c, d) and 4kw2 (e, f). All plots were generated by AUSPEX (Thorn et al., 2017 ▸). The points represent the individual intensities and the vertical bars show the resolutions at which ice rings may be found. The red bars refer to suspected ice rings found by AUSPEX.

