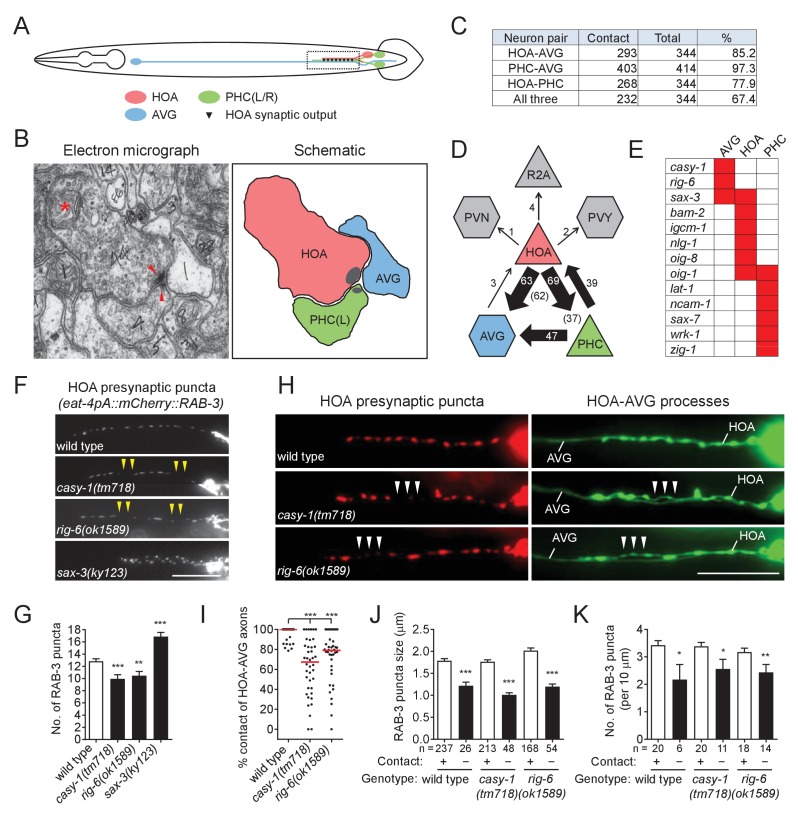
Figure 1. Cell adhesion protein genes casy-1 and rig-6 are required for axon fasciculation.
(A) Schematic of the position of cell bodies and axons of three neurons HOA (red), AVG (blue) and a pair of PHC (green) in the male (ventral view). The dashed box indicates the axons and HOA synaptic output analyzed in (C and D) and imaged in (F and H). (B) Electron micrograph showing the axons and synapses of HOA, PHC and AVG. Arrowheads indicate presynaptic density of dyadic synapses of HOA and PHC. Asterisk indicates a mitochondrion. In the schematic, axons are colored as in (A), and presynaptic density is indicated as gray. (C) The number of electron micrograph sections for axon-axon contact between neuron pairs. N2Y series were analyzed from section #13906 to #14249, except for the PHC-AVG (from #13836 to #14249) (WormWiring: http://wormwiring.org). See also Supplementary file 1. (D) Synaptic output of HOA and the connectivity of HOA, AVG and PHC in the boxed region shown in (A). (HOA makes additional connections outside this region.) Synaptic weight determined by electron micrograph section numbers is indicated. The number of sections that contain dyadic synapses (HOA > AVG,PHC or PHC > HOA,AVG) is indicated in parenthesis. (E) Expression of transcriptional reporters for neural cell adhesion genes in the three neurons. One hundred out of 106 neural cell adhesion genes (94%) have been examined and the genes having expression in the three neurons are shown. (F) Distribution of a mCherry-tagged presynaptic marker RAB-3 in HOA axon of wild type or indicated mutants. Arrowheads indicate gaps between the presynaptic puncta. (G) Number of mCherry::RAB-3 puncta in mutants was counted and compared to wild type (n = 30). Error bars are SEM. (H) HOA presynaptic puncta (mCherry::RAB-3; red) were simultaneously visualized with GFP-labeled HOA and AVG axons (green) in wild type, or casy-1 or rig-6 mutant animals. Arrowheads indicate the gap region containing smaller or fewer presynaptic puncta. (I) Percentage of axon-axon contact between HOA and AVG in wild type or mutant animals (n = 40). Each dot represents individual animal. Red bar represents the median. (J and K) The mCherry::RAB-3 puncta size (J) or number (K) was measured and compared in the contacting and non-contacting axonal segments between HOA and AVG for the indicated genotypes. The number of the puncta (J) or of axon segments (K) analyzed is indicated below each column. Error bars are SEM. Scale bars, 20 μm. *p<0.05; **p<0.01; ***p<0.001 (by Mann-Whitney test). For the data and statistics, see Figure 1—source data 1.


