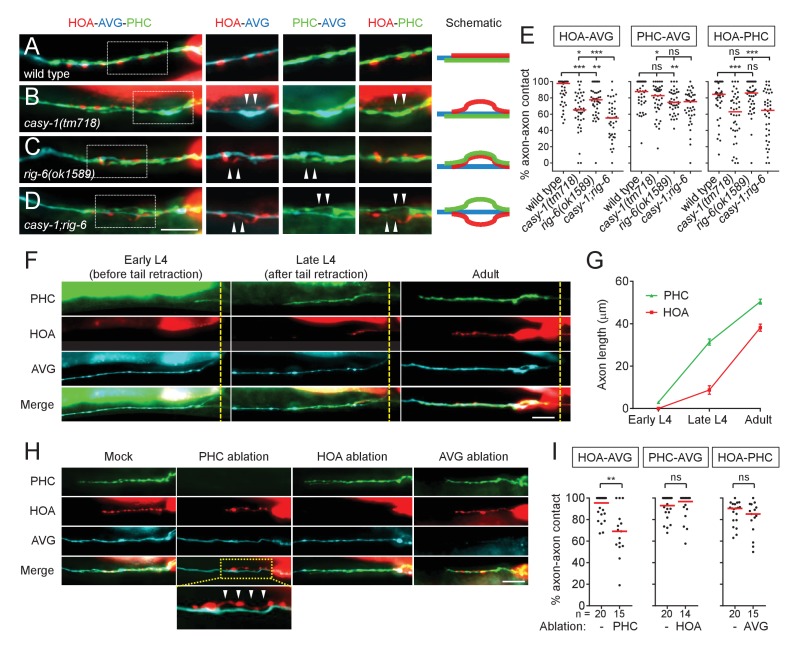
Figure 2. Axon fasciculation defects of casy-1 and rig-6 are distinguishable.
(A–D) The axons of the three neurons were individually labeled with wCherry (HOA; red), TagBFP (AVG; blue), and GFP (PHC; green) in wild type (A), casy-1(tm718) (B), rig-6(ok1589) (C), or casy-1;rig-6 double mutants (D). Axon fasciculation between each neuronal pair in the dashed box region and schematic of axon fasciculation are shown on the right. Arrowheads indicate the region where two axons are detached from each other. (E) Percentage of axon-axon contact between each neuronal pair in wild type or mutant animals (n = 40). Each dot represents individual animal. Red bar represents the median. (F) Developmental timing of axon extension of the three neurons in males. Each developmental stage was determined by the tail morphology of the male. Dashed lines indicate the posterior end of the intestine. (G) Axon length was measured from the point where the AVG axon makes a turn in the pre-anal ganglion (n = 15). Error bars are SEM. (H) Axon fasciculation of the three neurons in mock-, PHC-, HOA-, or AVG-ablated animal. Arrowheads indicate the region where HOA and AVG axons are detached from each other. (I) Percentage of axon-axon contact between each neuronal pair in mock-, PHC-, HOA-, or AVG-ablated animals. The number of animals analyzed is indicated. Scale bars, 20 μm. *p<0.05; **p<0.01; ***p<0.001; ns, not significant (by Mann-Whitney test). For the data and statistics, see Figure 2—source data 1.


