

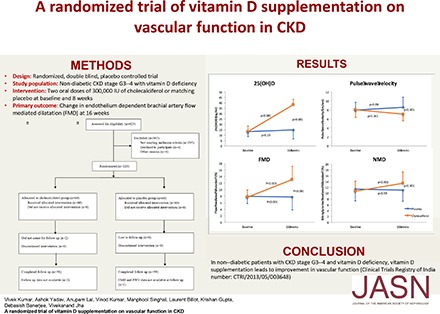
Abstract
Vitamin D deficiency associates with mortality in patients with CKD, and vitamin D supplementation might mitigate cardiovascular disease risk in CKD. In this randomized, double-blind, placebo-controlled trial, we investigated the effect of cholecalciferol supplementation on vascular function in 120 patients of either sex, aged 18–70 years, with nondiabetic CKD stage 3–4 and vitamin D deficiency (serum 25-hydroxyvitamin D ≤20 ng/ml). We randomized patients using a 1:1 ratio to receive either two directly observed oral doses of cholecalciferol (300,000 IU) or matching placebo at baseline and 8 weeks. The primary outcome was change in endothelium-dependent brachial artery flow-mediated dilation at 16 weeks. Secondary outcome measures included changes in pulse wave velocity and circulating biomarkers. Cholecalciferol supplementation significantly increased endothelium-dependent brachial artery flow-mediated dilation at 16 weeks, whereas placebo did not (between-group difference in mean change: 5.49%; 95% confidence interval, 4.34% to 6.64%; P<0.001). Intervention also led to significant favorable changes in pulse wave velocity and circulating IL-6 levels. Thus, in nondiabetic patients with stage 3–4 CKD and vitamin D deficiency, vitamin D supplementation may improve vascular function. This study is registered with the Clinical Trials Registry of India (no.: CTRI/2013/05/003648).
Keywords: cardiovascular disease, chronic kidney disease, Vitamin D
Because most patients with early CKD die of cardiovascular disease (CVD) before developing advanced kidney failure, CVD risk reduction is an important management goal in CKD. The widespread recognition of vitamin D deficiency, and the strong epidemiologic data linking vitamin D deficiency to cardiovascular mortality in the general population and patients with CKD, has kindled interest in examination of vitamin D deficiency as a potentially modifiable CVD risk factor.1 In a meta-analysis, each 10 ng/ml reduction in vitamin D increased the risk of all-cause mortality by 14% in patients with CKD.2 Another meta-analysis showed a 37% reduction of cardiovascular mortality with active vitamin D therapy in patients with CKD.3
Endothelial dysfunction sets in early in patients with CKD and correlates with future CVD.4,5 Vitamin D induces concentration dependent increase in endothelial nitric oxide production.6 Low serum 25-hydroxyvitamin D [25(OH)D] has been shown to be an independent predictor of impaired endothelial function in CKD.4 Small observational and case control studies have shown improvement in endothelial function with vitamin D supplementation.7,8 Despite strong epidemiologic links, clinical trial evidence on the effect of native vitamin D supplementation on CVD risk or outcomes in patients with CKD is lacking.
Vitamin D repletion strategies in CKD have largely involved use of activated vitamin D because of the belief that vitamin D activation will be hampered in patients with CKD, and the greater affinity of vitamin D receptor (VDR) for activated forms.9–11 The recognition that many tissues, including endothelial cells, possess 1-α-hydroxylase suggests that correction of native vitamin D deficiency can lead to therapeutic benefits as a result of endocrine and/or paracrine functions of vitamin D, and has generated interest in therapy with native forms.12
Flow-mediated dilation (FMD), a well established technique for assessing endothelial function,13–15 predicts CVD events in patients with CKD.5,16 CVD risk factor modification improves FMD, making it a relevant and accepted surrogate for CVD events.13 The Paricalcitol and Endothelial Function in Chronic Kidney Disease (PENNY) 17 Trial showed for the first time that paricalcitol favorably affected FMD in patients with CKD, which was subsequently confirmed in another study.18
We investigated whether supplementation with cholecalciferol would improve brachial artery FMD in nondiabetic patients with CKD and vitamin D deficiency. We also evaluated changes in pulse wave velocity (PWV; a marker of vascular stiffness) and biomarkers of endothelial function (E-selectin and vWF) and inflammation (high-sensitivity C-reactive protein [hs-CRP] and IL-6).
Results
A total of 423 patients were screened. After excluding 303 patients, 120 were enrolled, randomized and received the assigned intervention (Figure 1). In the cholecalciferol group, two patients did not attend follow-up visits and were excluded from the final analyses. In the placebo group, follow-up FMD could not be done in one patient who was therefore excluded from the analyses.
Figure 1.

Consolidated Standards of Reporting Trials 2010 flow diagram.
Baseline characteristics of the two groups are shown in Table 1. There were no differences between groups with respect to demographic details, causes of CKD, and current therapy. Baseline biochemical parameters, circulating biomarker levels, and vascular assessment parameters also did not differ between groups (Table 2).
Table 1.
Baseline characteristics of study participants
| Parameters | Placebo (n=59) | Cholecalciferol (n=58) |
|---|---|---|
| Sex, men/women | 40/19 | 41/17 |
| Age, yr | 45.20±11.61 | 43.17±11.79 |
| Body mass index, kg/m2 | 23.45±2.91 | 23.57±2.67 |
| SBP, mm Hg | 127.88±15.67 | 128.48±14.43 |
| DBP, mm Hg | 82.33±10.21 | 83.38±10.09 |
| Fasting blood sugar, mg/dl | 93.17±11.73 | 92.00±13.11 |
| Duration of disease, mo | 32.30±46.94 | 39.53±49.71 |
| No. of patients with proteinuria | 30 (51) | 31 (53) |
| History of smoking | 4 (7) | 5 (9) |
| Hypertension | 54 (92) | 53 (91) |
| Family history of CAD | 5 (8) | 6 (10) |
| Family history of diabetes | 17 (29) | 14 (24) |
| Family history of kidney disease | 7 (12) | 8 (14) |
| Cause of CKD | ||
| Chronic interstitial nephritis | 11 (19) | 10 (17) |
| Chronic GN | 5 (8) | 6 (10) |
| Polycystic kidney disease | 6 (10) | 6 (10) |
| Unknown | 30 (51) | 27 (47) |
| Others | 7 (12) | 9 (15.51) |
| Medications | ||
| ACE inhibitors | 23 (39) | 24 (41) |
| ARB | 16 (27) | 18 (31) |
| β-Blockers | 17 (29) | 20 (34) |
| Statins | 19 (32) | 27 (47) |
| Hypouricemic drugs | 14 (24) | 11 (19) |
| Calcitriol | 1 (2) | 3 (5) |
| Noncalcium-based phosphate binders | 1 (2) | 2 (3) |
| Calcium-based phosphate binders | 7 (12) | 6 (10) |
| Sodium bicarbonate | 41 (69) | 32 (55) |
| Calcium-channel blockers | 38 (64) | 36 (62) |
Data presented as mean±SD or number (percentage). SBP, systolic BP; DBP, diastolic BP; CAD, coronary artery disease; ACE, angiotensin-converting enzyme; ARB, angiotensin II receptor blockers.
Table 2.
Baseline biochemical, circulating biomarkers, and endothelial function in study participants
| Parameter | Placebo (n=59) | Cholecalciferol (n=58) |
|---|---|---|
| Hemoglobin, g/dl | 12.02±1.94 | 11.97±1.69 |
| eGFR, min/ml per 1.73 m2 | 34.63±12.25 | 35.77±12.37 |
| Albumin, g/dl | 4.62±0.63 | 4.74±0.54 |
| Calcium, mg/dl | 9.09±0.94 | 9.01±0.73 |
| Inorganic phosphorus, mg/dl | 4.03±1.39 | 3.65±0.91 |
| Uric acid, mg/dl | 7.66±2.37 | 8.01±2.32 |
| Alkaline phosphatase, IU/L | 136.07±59.83 | 135.17±58.32 |
| Total cholesterol, mg/dl | 167.11±54.20 | 166.15±42.87 |
| Triglyceride, mg/dl | 154.01±78.10 | 152.27±69.02 |
| 25(OH)D, ng/ml | 13.21±4.78 | 13.40±4.42 |
| 1,25(OH)2D, pg/ml | 20.11±12.54 | 19.10±10.69 |
| iPTH, pg/mla | 146 (102, 247) | 139(84, 212) |
| E-selectin, ng/ml | 55.71±22.10 | 57.91±20.90 |
| IL-6, pg/mla | 4.68 (2.59, 7.24) | 4.44 (2.58, 7.10) |
| hs-CRP, mg/La | 3.17 (0.94, 6.15) | 2.2 (1.00, 4.45) |
| iFGF-23, pg/mla | 57.66 (44.48, 88.90) | 57.88 (41.42, 69.04) |
| vWF, mU/mla | 1050 (518, 1404) | 1050 (704, 1362) |
| Brachial artery diameter, mm | 4.14±0.59 | 4.14±0.70 |
| FMD, % | 7.85±2.35 | 7.65±2.25 |
| NMD, % | 11.43±4.07 | 11.20±4.12 |
| FMD/NMD ratio | 0.69±0.47 | 0.80±0.57 |
| PWV, m/sec | 7.98±1.74 | 7.98±1.63 |
Data presented as mean±SD or median (25th, 75th percentile). 25(OH)D, 25 hydroxyvitamin D; 1,25(OH)2D, 1,25 dihydroxyvitamin D; iPTH, intact parathyroid hormone; iFGF-23, intact fibroblast growth factor 23; FMD, endothelial-dependent flow-mediated dilation; NMD, endothelial-independent flow-mediated dilation.
Compared using the Mann–Whitney U test.
Change in Serum 25(OH)D Levels
Serum 25(OH)D levels were similar in both groups at baseline (placebo and cholecalciferol group [mean±SD]: 13.21±4.78 and 13.40±4.42 ng/ml; P=0.88; Table 2). At 16 weeks, the serum 25(OH)D levels increased in the cholecalciferol group (between-group difference in mean change: 23.40 ng/ml; 95% confidence interval [95% CI], 19.76 to 27.06; P<0.001) (Table 3) but not in the placebo group.
Table 3.
Changes in endothelial function, biomarkers, and biochemical parameters at the 16-week follow-up visit
| Parameter | Placebo (n=59) | Cholecalciferol (n=58) | Between-Group Difference | |||
|---|---|---|---|---|---|---|
| Mean Change (95% CI) | P Value | Mean Change (95% CI) | P Value | Difference of Mean change (95% CI) | P Value | |
| Brachial artery diameter, mm | 0.10 (−0.01 to 0.21) | 0.07 | −0.08 (−0.20 to 0.04) | 0.22 | −0.18 (−0.52 to 0.07) | 0.13 |
| FMD, % | −0.07 (−0.71 to 0.57) | 0.83 | 5.42 (4.44 to 6.39) | <0.001 | 5.49 (4.34 to 6.64) | <0.001 |
| NMD, % | −0.74 (−1.86 to 0.38) | 0.19 | 2.11 (0.87 to 3.36) | 0.001 | 2.85 (1.41 to 4.84) | <0.001 |
| FMD/NMD ratio | 0.02(−0.08 to 0.16) | 0.54 | 0.27 (0.10 to 0.44) | 0.003 | 0.25 (0.05 to 0.46) | <0.02 |
| PWV, m/sec | 0.30 (−0.04 to 0.63) | 0.09 | −0.94 (−1.30 to −0.59) | <0.001 | −1.24 (−2.16 to −0.74) | <0.001 |
| SBP, mm Hg | 1.56 (−2.80 to 5.92) | 0.48 | 0.44 (−4.00 to 4.89) | 0.84 | −1.11 (−7.27 to 5.05) | 0.72 |
| DBP, mm Hg | 1.35 (−2.11 to 4.82) | 0.44 | 0.50 (−2.48 to 3.48) | 0.74 | −0.85 (−5.38 to 3.68) | 0.71 |
| 25(OH)D, ng/ml | 1.51 (−0.46 to 3.48) | 0.13 | 24.91 (21.77 to 28.06) | <0.001 | 23.40 (19.76 to 27.06) | <0.001 |
| 1,25(OH)2D, pg/ml | 0.48 (−4.65 to 5.62) | 0.85 | 15.46 (5.42 to 25.50) | 0.003 | 14.98 (4.48 to 27.18) | <0.01 |
| iPTH, pg/mla | 47.36 (6.63 to 88.10) | 0.05 | −53.37 (−82.37 to −24.36) | <0.001 | −100.73 (−150.50 to −50.95) | <0.001 |
| E-selectin, ng/ml | −2.43 (−6.78 to 1.92) | 0.27 | −4.71 (−8.89 to −5.25) | <0.03 | −2.28 (−8.26 to 3.70) | 0.45 |
| IL-6, pg/mla | 0.28 (−1.16 to 1.73) | 0.17 | −2.00(−2.96 to −0.83) | 0.002 | −2.28 (−3.96 to −0.38) | 0.001 |
| hs-CRP, mg/La | −0.41 (−1.07 to 2.45) | 0.26 | −0.25 (−0.99 to 0.43) | 0.30 | 0.16 (−0.82 to 1.14) | 0.94 |
| iFGF-23, pg/mla | −7.33 (−24.10 to 9.45) | 0.27 | −14.71 (−28.45 to −0.97) | 0.33 | −7.38 (−28.92 to 14.15) | 0.96 |
| vWF, mU/mla | 74 (−136 to 284) | 0.23 | −140 (−311 to 30) | 0.16 | −214 (−483 to 54) | 0.09 |
| eGFR, min/ml per 1.73 m2 | 1.57 (−0.93 to 4.01) | 0.21 | 1.42 (−0.55 to 3.40) | 0.15 | −0.15 (−3.31 to 3.01) | 0.92 |
| Hemoglobin, g/dl | −0.22 (−0.53 to 0.10) | 0.18 | −0.01 (−0.30 to 0.28) | 0.94 | 0.21 (−0.22 to 0.63) | 0.34 |
| Uric acid, mg/dl | −0.51 (−0.67 to 0.08) | 0.09 | −0.60 (−1.12 to −0.03) | <0.04 | −0.09 (−0.89 to 0.72) | 0.83 |
| Calcium, mg/dl | −0.48 (−0.76 to −0.19) | 0.001 | 0.21 (−0.05 to 0.46) | 0.11 | 0.69 (0.31 to 1.06) | 0.001 |
| Inorganic phosphorus, mg/dl | −0.30 (−0.67 to 0.08) | 0.12 | 0.19 (−0.19 to 0.59) | 0.31 | 0.49 (−0.37 to 1.03) | 0.07 |
| Serum alkaline phosphatase, IU/L | 9.40 (−2.08 to 20.89) | 0.11 | −10.85 (−20.70 to −1.01) | <0.03 | −20.25 (−35.14 to −5.38) | <0.01 |
| Total cholesterol, mg/dl | −3.03 (−13.14 to 7.09) | 0.55 | −8.15 (−17.22 to 0.92) | 0.08 | −5.12 (−21.56 to 5.46) | 0.29 |
| Triglyceride, mg/dl | 0.56 (−20.77 to 21.89) | 0.96 | −8.38 (−24.41 to 7.65) | 0.30 | −8.94 (−35.13 to 17.23) | 0.50 |
FMD, endothelial-dependent flow-mediated dilation; NMD, endothelial-independent flow-mediated dilation; SBP, systolic BP; DBP, diastolic BP; 25(OH)D, 25 hydroxyvitamin D; 1,25(OH)2D, 1,25 dihydroxyvitamin D; iPTH, intact parathyroid hormone; iFGF-23, intact fibroblast growth factor 23.
Compared using Wilcoxon signed-rank test within group and Mann–Whitney U test between groups.
Changes in Vascular Function
Baseline FMD was similar in both groups (placebo versus cholecalciferol [mean±SD]: 7.85%±2.35% versus 7.65%±2.25%; P=0.65; Table 2). At 16 weeks, the FMD improved in the cholecalciferol but not the placebo group (between-group difference in mean change: 5.49%; 95% CI, 4.34 to 6.64; P<0.001) (Table 3). This change in FMD remained significant after adjustment for baseline FMD (P<0.001). In the cholecalciferol group, the mean proportional increase in FMD was 80% (Supplemental Table 1). Change in FMD remained significant in all prespecified subgroups (P<0.001; Figure 2) with potential heterogeneity by sex and age. Change in serum 25(OH)D levels significantly correlated with change in FMD (r<0.57; P<0.001).
Figure 2.

The FMD change remained significant in subgroup analyses. Forest plot showing effect of interaction between treatment and subgroup variable (sex, baseline vitamin D level tertiles, age group, and use of renin-angiotensin system inhibitors or statins) on primary outcome (change in endothelium-dependent FMD). P value is from test statistics for interaction between treatment and subgroup variable. Data presented as mean change (95% confidence interval).
Nitroglycerin-mediated dilation (NMD) and FMD/NMD ratio were also improved in the cholecalciferol group (between-group difference in mean change: 2.85% [95% CI, 1.41 to 4.84; P<0.001] and 0.25% (95% CI, 0.05 to 0.46; P<0.02) for NMD and FMD/NMD, respectively) (Table 3). PWV decreased significantly at 16 weeks in the cholecalciferol group (between-group difference in mean change: −1.24 m/sec; 95% CI, −2.16 to −0.74; P<0.001) (Table 3). At 16 weeks, PWV in the cholecalciferol group was significantly lower compared with the placebo group (P<0.001; Supplemental Figure 1). Figure 3 shows change in FMD and NMD for individual patients in the two groups.
Figure 3.

FMD and NMD improved in the cholecalciferol-treated but not in the placebo group. Line plots showing FMD and NMD at baseline and 16 weeks for individual patients. (A) FMD and (B) NMD.
Antihypertensive drug doses remained unaltered, and there was no change in systolic or diastolic BPs in either group over the study period.
Change in Biochemical Parameters and Circulating Biomarkers
Serum calcium levels increased whereas alkaline phosphatase levels decreased in the cholecalciferol group (between-group difference in mean change: 0.69 mg/dl [95% CI, 0.31 to 1.06; P=0.001] and −20.25 U/L [95% CI, −35.14 to −5.38; P<0.01] for serum calcium and alkaline phosphatase, respectively) (Table 3). Serum inorganic phosphorus, serum FGF-23, serum creatinine, eGFR, and blood hemoglobin levels did not change in either group. There was no change in the proportion of patients with dipstick-positive proteinuria in intervention (53% versus 50%; P=0.71) or control (51% versus 51%; P>0.99) groups.
Serum 1,25-dihydroxyvitamin D [1,25(OH)2D] levels increased whereas intact parathyroid hormone (iPTH) and IL-6 levels decreased in the cholecalciferol group (between-group difference in mean change: 14.98 pg/ml [95% CI, 4.48 to 27.18; P<0.01], −100.73 pg/ml [95% CI, −150.50 to −50.95; P<0.001], and −2.28 pg/ml [95% CI, −3.96 to −0.38; P=0.001] for serum 1,25(OH)2D, iPTH, and IL-6, respectively) (Table 3). The decrease in serum iPTH was seen across all CKD stages. No significant interaction or effect modification of primary outcome was noted when patients were stratified according to tertiles on the basis of baseline values or change in values over 16 weeks for serum phosphorus, calcium, iPTH, and FGF-23 (data not shown).
Adverse Events
Supplemental Table 2 shows the adverse events recorded during the study. There were no hospitalizations or serious adverse events. One patient complained of mild headache and dizziness after NMD testing, which improved with 15 minutes of rest.
Discussion
This randomized placebo-controlled trial provides the strongest evidence so far that correction of vitamin D deficiency by cholecalciferol supplementation improves FMD and PWV in predialysis patients with CKD, both of which are predictors of future CVD risk. Change in serum 25(OH)D level significantly correlated with change in FMD, lending further support to vitamin D deficiency as a potentially modifiable CVD risk factor in patients with CKD.
This finding builds on existing observational and case control studies that have shown a link between vitamin D levels and endothelial function.4,8 These clinical findings are supported by the observation of a dose-dependent rise in endothelial nitric oxide synthase gene expression in cultured human aortic endothelial cells after ergocalciferol supplementation,19 and are concordant with the PENNY Trial, in which 12-week paricalcitol supplementation caused improvement in FMD in patients with CKD stage 3–4.17
Despite concerns about perceived resistance to the action of native vitamin D in CKD, our observations show that cholecalciferol supplementation has the ability to improve FMD. Cholecalciferol supplementation improved 1,25(OH)2 levels, and it could be argued that the cellular effects could have been mediated through activated vitamin D. Cholecalciferol supplementation improved not only FMD but also NMD. Though NMD has traditionally been used as a control test for FMD, association of impaired NMD with established CVD and risk factors of CVD have been recently reported.20,21 In a prospective observational study, impairment of NMD alone was an independent predictor of future CVD events.22 Recent studies have shown improvement in NMD after cholecalciferol supplementation but have been limited by study design.7,23 The ratio of FMD to NMD has been suggested as an index of endothelial function in the setting of significant change in NMD.24 In our study, FMD to NMD ratio also changed favorably. NMD is dependent on age, and generally follows endothelial dysfunction. Whether the NMD change was secondary to a modulation of global vascular function by vitamin D repletion due to the relatively younger population in our study, or whether it was an independent effect needs further study.
PWV, a marker of arterial stiffness and atherosclerotic transformation and an independent predictor of CVD and mortality, is regulated by vessel geometry and material properties of the vessel wall, and affected by endothelial as well as smooth muscle functions. Studies of vitamin D supplementation have shown inconsistent results in terms of effect on PWV,7,19,23 probably because of problems with study design and inadequate numbers. The improvement in PWV is likely a combination of improved endothelial function and direct vascular smooth muscle effects of vitamin D.
Understanding of the pleiotropic effects of vitamin D has been advanced by the discovery of VDR on a number of tissues, including endothelial and vascular smooth muscle cells.10,25 Although circulating 1,25(OH)2D levels are mainly influenced by renal 1-α-hydroxylase, conversion of 25(OH)D to 1,25(OH)2D by local 1-α-hydroxylase occurs in many tissues. It has been suggested that endothelial dysfunction in a vitamin D–deficient state could be related to decreased expression of local 1-α-hydroxylase and VDR, which is dependent on circulating 25(OH)D but independent of circulating 1,25(OH)2D levels.26
The decrease in iPTH after cholecalciferol supplementation remained consistent across CKD stages, unlike that reported by Zisman et al.,27 who observed significant decrease in PTH in patients with CKD stage 3 but not stage 4 after ergocalciferol supplementation in patients with CKD and vitamin D deficiency. In this study, the change in serum iPTH levels achieved with cholecalciferol supplementation is comparable to that reported in the PENNY Trial, which goes against the traditional argument favoring the use of activated vitamin D compounds for better suppression of elevated iPTH, at least in early stages of CKD.11,28 Of note, we enrolled patients with true vitamin D deficiency, which could explain the more impressive effects seen in our study. There are some other differences in the populations studied in the PENNY Trial and this study. In addition to racial differences, the mean age of the study participants was almost 18 years lower than that in the PENNY Trial.17
Cholecalciferol supplementation is safe, and led to an expected increase in circulating vitamin D levels. Although we gave two doses under direct observation, other supplementation strategies can be used in routine clinical practice to achieve vitamin D replenishment. The average daily dose of cholecalciferol was comparable to what has been reported previously.29 Supplementation did not have any adverse effect on eGFR, and no patient developed severe hypercalcemia.
Our study has several strengths: it used a directly observed therapy to ensure treatment compliance; used a rigorous, standardized methodology for FMD measurement; used automated image detection and acquisition; and used blinded randomized analysis, improving accuracy and reproducibility and removing bias. The limitations include its single center nature and exclusion of patients with diabetes. Serum hs-CRP levels did not change significantly in the cholecalciferol group in our study, in contrast to a significant decrease that was observed with use of paricalcitol in a small pilot trial that enrolled 24 patients with CKD.30 The differential effect of supplementation on IL-6 and CRP needs further study. It has been suggested that coupling between circulating IL-6 and hs-CRP levels can be affected by the presence or absence of obesity.31 The fact that the majority of study population had near normal body mass index might explain the significant decrease in circulating IL-6 levels but no change in hs-CRP levels. Consistent with the improved FMD, the intervention group showed a significant decline in the circulating E-selectin level, although the difference between groups did not reach significance.
In conclusion, correction of vitamin D deficiency by cholecalciferol supplementation improves CVD risk factor profile through positive effect on vascular function in nondiabetic patients with early CKD, likely due to improvement in both endothelial and vascular smooth muscle cell functions. Short of clinical trials assessing the effect of cholecalciferol supplementation on hard clinical end points, our observations provide strong evidence that cholecalciferol supplementation is safe and could be used for CV risk reduction in patients with CKD and vitamin D deficiency.
Concise Methods
Study Design
The study was a single center, parallel arm, randomized, double-blind, placebo-controlled trial performed at the Postgraduate Institute of Medical Education and Research (PGIMER), Chandigarh, India. The study was approved by the Institute’s Ethics Committee and registered with the Clinical Trials Registry of India in May of 2013 (no.: CTRI/2013/05/003648). Patient enrolment started in July of 2013 and was completed in April of 2015.
Study Population
Stable patients with CKD attending the Renal Clinic at PGIMER and having an eGFR between 15 and 60 ml/min per 1.73 m2 (using the four-variable Modification of Diet in Renal Disease equation32) were eligible for screening. Inclusion criteria were as follows: age 18–70 years, vitamin D deficiency [serum 25(OH)D levels ≤20 ng/ml], and absence of diabetes mellitus. Exclusion criteria were heart failure, present or past malignancy, pregnancy, or vitamin D (ergocalciferol or cholecalciferol) supplementation within the past 30 days. All patients provided written informed consent before enrolment.
Randomization and Blinding
Patients were randomized in a 1:1 allocation ratio, and entered a 2-week run-in period, during which usual treatment was verified and continued. Simple randomization was done by a computer-generated Bernoulli random number table. Neither the investigator nor the patient were aware of the randomization sequence. Blinding was achieved by opaque, sequentially numbered and sealed envelopes. Both the drug and placebo were similar in physical appearance, form, and packaging.
Intervention and Follow-Up
Upon completion of the run-in period, patients received their assigned interventions: two oral doses of either 300,000 IU of cholecalciferol or matching placebo at baseline and 8 weeks later. Both doses were given under direct observation. Follow-up visits were done at 8 and 16 weeks after the baseline visit. Serum creatinine, calcium, inorganic phosphorus, lipid profile, uric acid, and blood hemoglobin were measured at baseline and the 16-week visit, on fasting blood samples. Serum 25(OH)D was measured by enzyme immunoassay (EIA; Immunodiagnostic Systems, Tyne & Wear, UK), certified for calculation of 25(OH)D by Center for Disease Control Vitamin D Standardization Certification Program.33,34
Vascular Function Studies
FMD and endothelium-independent NMD were measured at baseline and 16 weeks.15 Patients came in a fasting state in the morning and withheld their morning medication dose until after their studies. FMD assessment was done in a quiet room with low ambient lighting at a temperature of 20°C–25°C by the same trained investigator, using a Philips IU22 xMatrix ultrasound system (Philips, Cambridge, MA) and Philips IU22 L12–5 linear transducer with extended operating frequency range of 5–12 MHz.
After a 30-minute rest, a 2-minute baseline recording of the right brachial artery was obtained, after which a cuff was tied 2 cm distal to the elbow and inflated to 300 mm Hg for 5 minutes. A 5-minute recording of the brachial artery was made, starting just before cuff deflation, to estimate FMD. After resting again for 15 minutes, a 2-minute recording was repeated, followed by sublingual administration of 0.4 mg of glyceryl trinitrate (GTN). Starting just before GTN administration, a 5-minute recording was obtained again to estimate NMD. Recordings were analyzed in a random order by a blinded independent investigator, using Brachial Analyzer for Research 6 (Vascular Research Tools 6; Medical Imaging Applications LLC, Coralville, IA), an automated continuous edge detection and wall tracking software. FMD and NMD were defined as the maximum percentage increase in brachial artery diameter during reactive hyperemia after cuff release and after GTN administration, respectively.
Carotid-femoral PWV were calculated by a trained investigator using the SphygmoCor CPV system (AtCor Medical, Inc., Itasca, IL) at baseline and 16 weeks on the same day as the brachial artery FMD assessment.
Biomarker Evaluation
Plasma and serum samples at baseline and the 16 weeks visit were stored at −80°C. Serum 1,25(OH)2D (EIA; Immunodiagnostic Systems), serum iPTH (EIA; Calbiotech Inc., El Cajon, CA), serum intact FGF-23 (second-generation ELISA; Immutopics, Inc., Athens, Ohio), serum E-selectin (Quantikine solid-phase sandwich ELISA; R&D Systems, Minneapolis, MN), serum hs-CRP (Quantikine solid-phase sandwich ELISA; R&D Systems), serum IL-6 (Quantikine solid-phase sandwich ELISA; R&D Systems), and plasma vWF (IMUBIND ELISA; Sekisui Diagnostic, Lexington, MA) were analyzed in all samples.
Outcomes
The primary outcome was change in brachial artery FMD at 16 weeks. Secondary outcome measures were changes in PWV and levels of serum 1,25(OH)2D, serum iPTH, serum FGF-23, serum E-selectin, serum hs-CRP, serum IL-6, and plasma vWF.
Sample Size Calculation and Statistical Analyses
Assuming a dropout rate of 10%, a sample size of 120 patients (60 in each group) was required to detect an absolute mean difference of 1.6% (SD 3%) with 80% power and two-sided α of 0.05. Assuming a mean FMD of 4% at baseline and no change in the placebo arm, this corresponds to a 40% relative improvement in the cholecalciferol arm.
All enrolled patients with nonmissing outcome data were included in the analysis. Continuous variables were compared with independent samples paired t test if normally distributed, or with Mann–Whitney U test if the distribution was skewed. Categorical variables were analyzed with chi-squared test or Fisher exact test as appropriate. Paired t test and Wilcoxon signed-rank test were used for within-group comparisons. ANCOVA was used to determine difference between groups for change in FMD over 16 weeks, with adjustment for baseline FMD. Two-tailed P values <0.05 were considered statistically significant. Analyses were conducted using SPSS software for Macintosh, version 21.0 (IBM SPSS, Chicago, IL) and SAS software (SAS Institute Inc., Cary, NC).
Prespecified subgroup analyses were conducted using a linear model of FMD change, including the subgroup variable (sex, tertiles on the basis of serum 25(OH)D levels at baseline, age <50 or ≥50 years, and use of statins or renin-angiotensin system inhibitors), the intervention, and the interaction between the intervention and the subgroup variable. Heterogeneity was assessed by testing the interaction term between the intervention and the subgroup variable. Post hoc analyses were correlation of change in FMD with change in serum 25(OH)D levels (Spearman rank correlation); comparison of change in FMD/NMD between two groups at 16 weeks; and subgroup analyses using a linear model of FMD change in tertiles on the basis of values at baseline or change in values over 16 weeks in serum phosphorus, serum calcium, serum FGF-23, and serum iPTH, the intervention, and the interaction between the intervention and the subgroup variable.
Disclosures
None.
Supplementary Material
Acknowledgments
We are thankful to Dr. Chetan Mittal for helping us with the use of Brachial Analyzer for Research 6 software.
D.B. and V.J. were responsible for concept and design. Vivek K. and K.L.G. were responsible for screening, enrolment, and follow-up of patients. A.K.Y. performed pulse wave analysis. A.L. performed flow mediated dilation. M.S. analyzed flow-mediated dilation data. A.K.Y. and Vinod K. performed laboratory experiments. L.B. performed the statistical analysis. Vivek K., A.K.Y., and V.J. wrote manuscript. All authors read and approved the manuscript.
The study was funded by the Department of Biotechnology, Government of India (grant no: BT/PR3150/MED/30/640/2011; awarded to V.J.).
This study was presented in the Late Breaking Clinical Trial Session at American Society of Nephrology Kidney Week on November 7, 2015 at San Diego, CA (SA-PO1104).
The funding agency had no role in design and conduct of this study.
Footnotes
Published online ahead of print. Publication date available at www.jasn.org.
This article contains supplemental material online at http://jasn.asnjournals.org/lookup/suppl/doi:10.1681/ASN.2017010003/-/DCSupplemental.
References
- 1.Pilz S, Tomaschitz A, Drechsler C, de Boer RA: Vitamin D deficiency and heart disease. Kidney Int Suppl 1: 111–115, 2011 [Google Scholar]
- 2.Pilz S, Iodice S, Zittermann A, Grant WB, Gandini S: Vitamin D status and mortality risk in CKD: A meta-analysis of prospective studies. Am J Kidney Dis 58: 374–382, 2011 [DOI] [PubMed] [Google Scholar]
- 3.Duranton F, Rodriguez-Ortiz ME, Duny Y, Rodriguez M, Daurès JP, Argilés A: Vitamin D treatment and mortality in chronic kidney disease: A systematic review and meta-analysis. Am J Nephrol 37: 239–248, 2013 [DOI] [PubMed] [Google Scholar]
- 4.Chitalia N, Recio-Mayoral A, Kaski JC, Banerjee D: Vitamin D deficiency and endothelial dysfunction in non-dialysis chronic kidney disease patients. Atherosclerosis 220: 265–268, 2012 [DOI] [PubMed] [Google Scholar]
- 5.Yilmaz MI, Stenvinkel P, Sonmez A, Saglam M, Yaman H, Kilic S, Eyileten T, Caglar K, Oguz Y, Vural A, Çakar M, Altun B, Yenicesu M, Carrero JJ: Vascular health, systemic inflammation and progressive reduction in kidney function; clinical determinants and impact on cardiovascular outcomes. Nephrol Dial Transplant 26: 3537–3543, 2011 [DOI] [PubMed] [Google Scholar]
- 6.Molinari C, Uberti F, Grossini E, Vacca G, Carda S, Invernizzi M, Cisari C: 1α,25-dihydroxycholecalciferol induces nitric oxide production in cultured endothelial cells. Cell Physiol Biochem 27: 661–668, 2011 [DOI] [PubMed] [Google Scholar]
- 7.Chitalia N, Ismail T, Tooth L, Boa F, Hampson G, Goldsmith D, Kaski JC, Banerjee D: Impact of vitamin D supplementation on arterial vasomotion, stiffness and endothelial biomarkers in chronic kidney disease patients. PLoS One 9: e91363, 2014 [DOI] [PMC free article] [PubMed] [Google Scholar]
- 8.Zhang QY, Jiang CM, Sun C, Tang TF, Jin B, Cao DW, He JS, Zhang M: Hypovitaminosis D is associated with endothelial dysfunction in patients with non-dialysis chronic kidney disease. J Nephrol 28: 471–476, 2015 [DOI] [PubMed] [Google Scholar]
- 9.Ritter CS, Armbrecht HJ, Slatopolsky E, Brown AJ: 25-Hydroxyvitamin D(3) suppresses PTH synthesis and secretion by bovine parathyroid cells. Kidney Int 70: 654–659, 2006 [DOI] [PubMed] [Google Scholar]
- 10.Christakos S, Dhawan P, Verstuyf A, Verlinden L, Carmeliet G: Vitamin D: metabolism, molecular mechanism of action, and pleiotropic effects. Physiol Rev 96: 365–408, 2016 [DOI] [PMC free article] [PubMed] [Google Scholar]
- 11.Agarwal R, Georgianos PI: Con: Nutritional vitamin D replacement in chronic kidney disease and end-stage renal disease. Nephrol Dial Transplant 31: 706–713, 2016 [DOI] [PubMed] [Google Scholar]
- 12.Adams JS, Hewison M: Extrarenal expression of the 25-hydroxyvitamin D-1-hydroxylase. Arch Biochem Biophys 523: 95–102, 2012 [DOI] [PMC free article] [PubMed] [Google Scholar]
- 13.Flammer AJ, Anderson T, Celermajer DS, Creager MA, Deanfield J, Ganz P, Hamburg NM, Lüscher TF, Shechter M, Taddei S, Vita JA, Lerman A: The assessment of endothelial function: From research into clinical practice. Circulation 126: 753–767, 2012 [DOI] [PMC free article] [PubMed] [Google Scholar]
- 14.Harris RA, Nishiyama SK, Wray DW, Richardson RS: Ultrasound assessment of flow-mediated dilation. Hypertension 55: 1075–1085, 2010 [DOI] [PMC free article] [PubMed] [Google Scholar]
- 15.Thijssen DH, Black MA, Pyke KE, Padilla J, Atkinson G, Harris RA, Parker B, Widlansky ME, Tschakovsky ME, Green DJ: Assessment of flow-mediated dilation in humans: A methodological and physiological guideline. Am J Physiol Heart Circ Physiol 300: H2–H12, 2011 [DOI] [PMC free article] [PubMed] [Google Scholar]
- 16.Lee MJ, Han SH, Lee JE, Choi HY, Yoon CY, Kim EJ, Han JH, Han JS, Oh HJ, Park JT, Kang SW, Yoo TH: Endothelial dysfunction is associated with major adverse cardiovascular events in peritoneal dialysis patients. Medicine (Baltimore) 93: e73, 2014 [DOI] [PMC free article] [PubMed] [Google Scholar]
- 17.Zoccali C, Curatola G, Panuccio V, Tripepi R, Pizzini P, Versace M, Bolignano D, Cutrupi S, Politi R, Tripepi G, Ghiadoni L, Thadhani R, Mallamaci F: Paricalcitol and endothelial function in chronic kidney disease trial. Hypertension 64: 1005–1011, 2014 [DOI] [PubMed] [Google Scholar]
- 18.Lundwall K, Jörneskog G, Jacobson SH, Spaak J: Paricalcitol, microvascular and endothelial function in non-diabetic chronic kidney disease: A randomized trial. Am J Nephrol 42: 265–273, 2015 [DOI] [PubMed] [Google Scholar]
- 19.Dreyer G, Tucker AT, Harwood SM, Pearse RM, Raftery MJ, Yaqoob MM: Ergocalciferol and microcirculatory function in chronic kidney disease and concomitant vitamin d deficiency: An exploratory, double blind, randomised controlled trial. PLoS One 9: e99461, 2014 [DOI] [PMC free article] [PubMed] [Google Scholar]
- 20.Maruhashi T, Soga J, Fujimura N, Idei N, Mikami S, Iwamoto Y, Kajikawa M, Matsumoto T, Hidaka T, Kihara Y, Chayama K, Noma K, Nakashima A, Goto C, Higashi Y: Nitroglycerine-induced vasodilation for assessment of vascular function: A comparison with flow-mediated vasodilation. Arterioscler Thromb Vasc Biol 33: 1401–1408, 2013 [DOI] [PubMed] [Google Scholar]
- 21.Maruhashi T, Nakashima A, Matsumoto T, Oda N, Iwamoto Y, Iwamoto A, Kajikawa M, Kihara Y, Chayama K, Goto C, Noma K, Higashi Y: Relationship between nitroglycerine-induced vasodilation and clinical severity of peripheral artery disease. Atherosclerosis 235: 65–70, 2014 [DOI] [PubMed] [Google Scholar]
- 22.Kajikawa M, Maruhashi T, Hida E, Iwamoto Y, Matsumoto T, Iwamoto A, Oda N, Kishimoto S, Matsui S, Hidaka T, Kihara Y, Chayama K, Goto C, Aibara Y, Nakashima A, Noma K, Higashi Y: Combination of flow-mediated vasodilation and nitroglycerine-induced vasodilation is more effective for prediction of cardiovascular events. Hypertension 67: 1045–1052, 2016 [DOI] [PubMed] [Google Scholar]
- 23.Aytaç MB, Deveci M, Bek K, Kayabey Ö, Ekinci Z: Effect of cholecalciferol on local arterial stiffness and endothelial dysfunction in children with chronic kidney disease. Pediatr Nephrol 31: 267–277, 2016 [DOI] [PubMed] [Google Scholar]
- 24.Higashi Y: Assessment of endothelial function. History, methodological aspects, and clinical perspectives. Int Heart J 56: 125–134, 2015 [DOI] [PubMed] [Google Scholar]
- 25.Kassi E, Adamopoulos C, Basdra EK, Papavassiliou AG: Role of vitamin D in atherosclerosis. Circulation 128: 2517–2531, 2013 [DOI] [PubMed] [Google Scholar]
- 26.Jablonski KL, Chonchol M, Pierce GL, Walker AE, Seals DR: 25-Hydroxyvitamin D deficiency is associated with inflammation-linked vascular endothelial dysfunction in middle-aged and older adults. Hypertension 57: 63–69, 2011 [DOI] [PMC free article] [PubMed] [Google Scholar]
- 27.Zisman AL, Hristova M, Ho LT, Sprague SM: Impact of ergocalciferol treatment of vitamin D deficiency on serum parathyroid hormone concentrations in chronic kidney disease. Am J Nephrol 27: 36–43, 2007 [DOI] [PubMed] [Google Scholar]
- 28.Goldsmith DJ: Pro: Should we correct vitamin D deficiency/insufficiency in chronic kidney disease patients with inactive forms of vitamin D or just treat them with active vitamin D forms? Nephrol Dial Transplant 31: 698–705, 2016 [DOI] [PubMed] [Google Scholar]
- 29.Zittermann A, Ernst JB, Birschmann I, Dittrich M: Effect of vitamin D or activated vitamin D on circulating 1,25-Dihydroxyvitamin D concentrations: A systematic review and metaanalysis of randomized controlled trials. Clin Chem 61: 1484–1494, 2015 [DOI] [PubMed] [Google Scholar]
- 30.Alborzi P, Patel NA, Peterson C, Bills JE, Bekele DM, Bunaye Z, Light RP, Agarwal R: Paricalcitol reduces albuminuria and inflammation in chronic kidney disease: A randomized double-blind pilot trial. Hypertension 52: 249–255, 2008 [DOI] [PubMed] [Google Scholar]
- 31.Okamoto LE, Raj SR, Gamboa A, Shibao CA, Arnold AC, Garland EM, Black BK, Farley G, Diedrich A, Biaggioni I: Sympathetic activation is associated with increased IL-6, but not CRP in the absence of obesity: Lessons from postural tachycardia syndrome and obesity. Am J Physiol Heart Circ Physiol 309: H2098–H2107, 2015 [DOI] [PMC free article] [PubMed] [Google Scholar]
- 32.Levey AS, Coresh J, Greene T, Marsh J, Stevens LA, Kusek JW, Van Lente F, . Chronic Kidney Disease Epidemiology Collaboration: Expressing the Modification of Diet in Renal Disease Study equation for estimating glomerular filtration rate with standardized serum creatinine values. Clin Chem 53: 766–772, 2007 [DOI] [PubMed] [Google Scholar]
- 33.Sempos CT, Vesper HW, Phinney KW, Thienpont LM, Coates PM; Vitamin D Standardization Program (VDSP) : Vitamin D status as an international issue: National surveys and the problem of standardization. Scand J Clin Lab Invest Suppl 243: 32–40, 2012 [DOI] [PubMed] [Google Scholar]
- 34.CDC Vitamin D Standardization-Certification Program (VDSCP)—Total 25hydroxy Vitamin D Certified Procedures (UPDATED 3/2016). Available at: http://www.cdc.gov/labstandards/pdf/hs/CDC_Certified_Vitamin_D_Procedures.pdf. Accessed May 9, 2016
Associated Data
This section collects any data citations, data availability statements, or supplementary materials included in this article.