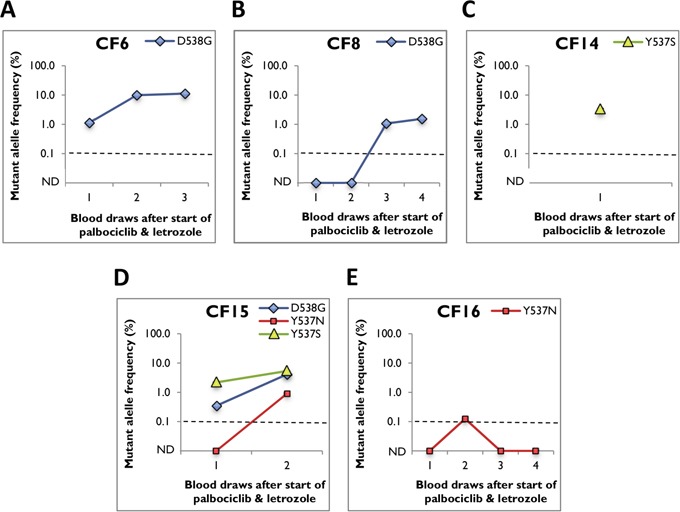
Figure 2. ESR1 mutant allele frequency in serial blood draws from positive cfDNA samples.

Average mutant allele frequency ± SEM is indicated using data from at least three replicates (after subtraction of background noise). Dotted line representing the LLoD (0.1%) was used as cut-off. ND represents mutation not detected. A. patient CF6, B. patient CF8, C. patient CF14, D. patient CF15, and E. patient CF16.
