
Figure 3. The correlation graphs of cg16672562 methylation with three traits in total, control and obese case groups.
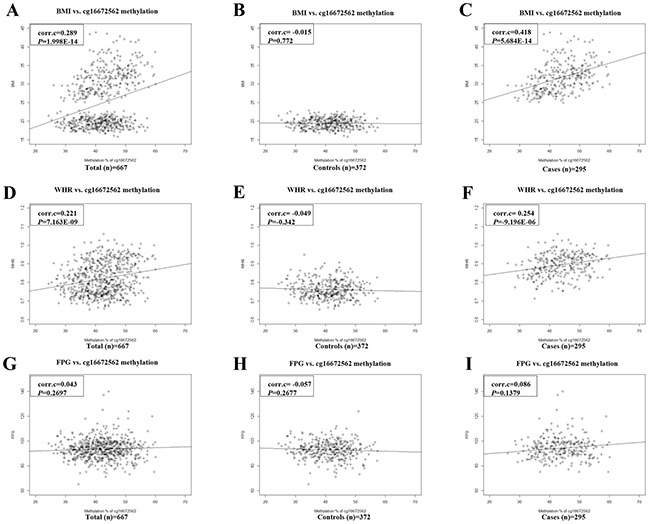
(A) BMI in total, (B) BMI in controls, (C) BMI in obese cases, (D) WHR in total, (E) WHR in controls, (F) WHR in obese cases, (G) FPG in total, (H) FPG in controls, and (I) FPG in obese cases. Correlation coefficient (corr.c) and P value are indicated at each graph on top left.